By InvestMacro | COT | Data Tables | COT Leaders | Downloads | COT Newsletter
Here are the latest charts and statistics for the Commitment of Traders (COT) data published by the Commodities Futures Trading Commission (CFTC).
The latest COT data is updated through Tuesday May 3rd 2022 and shows a quick view of how large traders (for-profit speculators and commercial entities) were positioned in the futures markets. All currency positions are in direct relation to the US dollar where, for example, a bet for the euro is a bet that the euro will rise versus the dollar while a bet against the euro will be a bet that the euro will decline versus the dollar.
Highlighting the COT currency data was the continued drop in speculator bets for European common currency futures contracts. Euro speculators reduced their bets for the third straight week this week and have now trimmed the net position by a total of -45,438 contracts over this three-week period. This decreasing sentiment among speculators accelerated this week with a large drop of -28,579 contracts and knocked the net contract level back into a bearish position for the first time since the beginning of October 2021.
The fundamental backdrop for the euro is one of weak growth and low interest rates compared to many of the other major currency countries. The Eurozone GDP for the first quarter of 2022 amounted to just 0.2 percent growth following a fourth quarter of 2021 growth reading of 0.3 percent. The war in Ukraine combined with surging inflation and weakening consumer demand has some banks believing a GDP contraction could be on the horizon while others see parity in the euro versus the US dollar as inevitable. Eurozone interest rates are forecasted to rise this year but they have been behind their major currency counterparts. The US, Canada, UK, Australia and New Zealand have all raised their benchmark interest rates over the past quarter and look likely to see more over the year, possibly widening the interest rate differential even more if the European Central Bank does not act.
This week was a very rare week when all the currencies we cover had lower speculator bets including the Euro (-28,579 contracts), Canadian dollar (-11,852 contracts), New Zealand dollar (-6,676 contracts), Mexican peso (-5,503 contracts), Japanese yen (-5,259 contracts), Brazil real (-5,096 contracts), British pound sterling (-4,192 contracts), Swiss franc (-1,038 contracts), US Dollar Index (-808 contracts), Australian dollar (-865 contracts) and Bitcoin (-24 contracts).
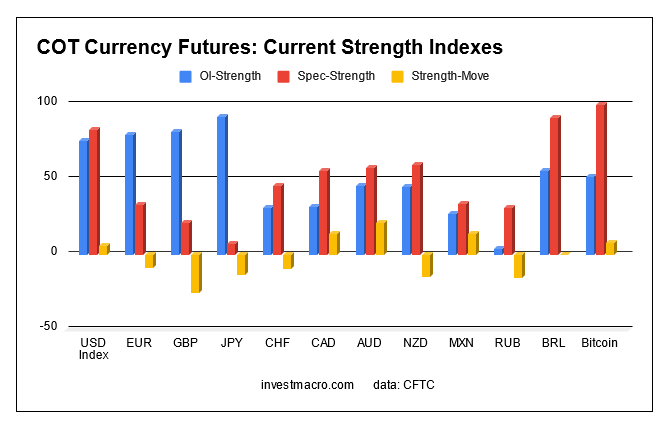
Speculator strength standings for each Commodity where strength index is current net position compared to past three years, above 80 is bullish extreme, below 20 is bearish extreme OI Strength = Current Open Interest level compared to last 3 years range Spec Strength = Current Net Speculator level compared to last 3 years range Strength Move = Six week change of Spec Strength
| May-03-2022 | OI | OI-Index | Spec-Net | Spec-Index | Com-Net | COM-Index | Smalls-Net | Smalls-Index |
|---|
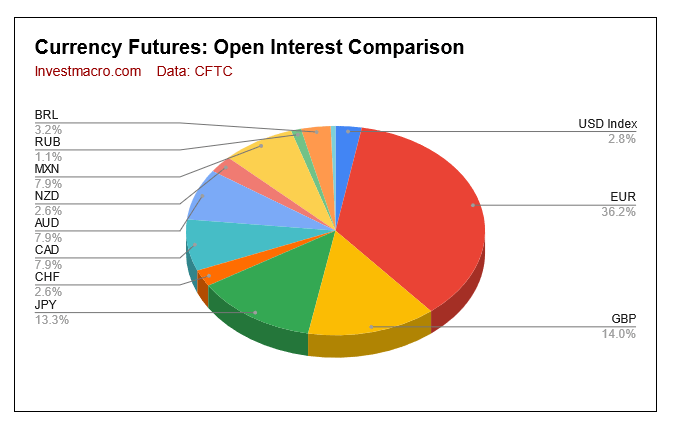
| USD Index | 54,092 | 76 | 33,071 | 83 | -35,684 | 15 | 2,613 | 45 |
| EUR | 694,926 | 80 | -6,378 | 33 | -24,586 | 69 | 30,964 | 26 |
| GBP | 268,496 | 82 | -73,813 | 21 | 89,026 | 82 | -15,213 | 24 |
| JPY | 254,813 | 92 | -100,794 | 7 | 120,264 | 94 | -19,470 | 14 |
| CHF | 49,385 | 31 | -13,907 | 46 | 30,542 | 68 | -16,635 | 7 |
| CAD | 152,779 | 32 | 9,029 | 56 | -12,959 | 51 | 3,930 | 38 |
| AUD | 152,257 | 46 | -28,516 | 58 | 34,225 | 44 | -5,709 | 39 |
| NZD | 50,844 | 45 | -6,610 | 60 | 9,879 | 46 | -3,269 | 14 |
| MXN | 151,933 | 27 | 14,623 | 34 | -18,552 | 65 | 3,929 | 60 |
| RUB | 20,930 | 4 | 7,543 | 31 | -7,150 | 69 | -393 | 24 |
| BRL | 61,549 | 56 | 41,788 | 91 | -43,371 | 9 | 1,583 | 83 |
| Bitcoin | 10,051 | 52 | 388 | 100 | -429 | 0 | 41 | 14 |
US Dollar Index Futures:
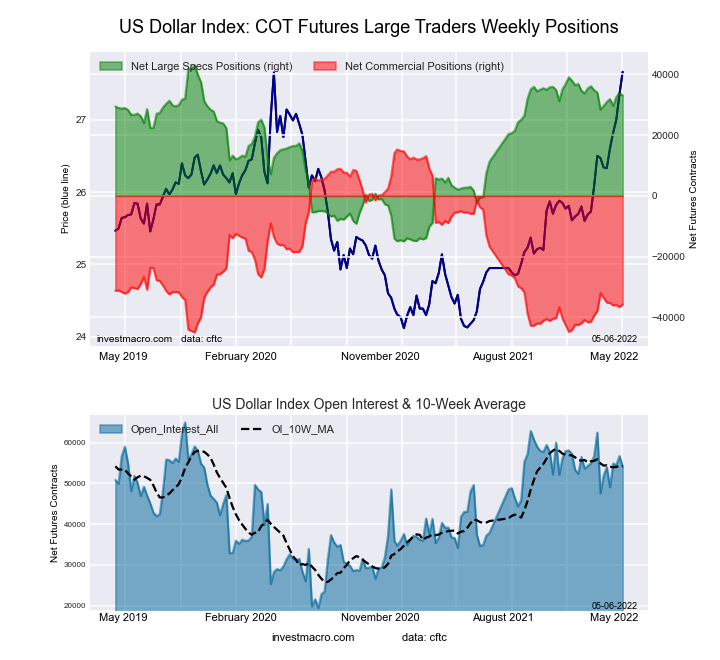 The US Dollar Index large speculator standing this week came in at a net position of 33,071 contracts in the data reported through Tuesday. This was a weekly lowering of -808 contracts from the previous week which had a total of 33,879 net contracts.
This week’s current strength score (the trader positioning range over the past three years, measured from 0 to 100) shows the speculators are currently Bullish-Extreme with a score of 82.8 percent. The commercials are Bearish-Extreme with a score of 15.3 percent and the small traders (not shown in chart) are Bearish with a score of 45.1 percent.
| US DOLLAR INDEX Statistics | SPECULATORS | COMMERCIALS | SMALL TRADERS |
| – Percent of Open Interest Longs: | 85.5 | 2.7 | 9.8 |
| – Percent of Open Interest Shorts: | 24.4 | 68.6 | 5.0 |
| – Net Position: | 33,071 | -35,684 | 2,613 |
| – Gross Longs: | 46,264 | 1,439 | 5,296 |
| – Gross Shorts: | 13,193 | 37,123 | 2,683 |
| – Long to Short Ratio: | 3.5 to 1 | 0.0 to 1 | 2.0 to 1 |
| NET POSITION TREND: | | | |
| – Strength Index Score (3 Year Range Pct): | 82.8 | 15.3 | 45.1 |
| – Strength Index Reading (3 Year Range): | Bullish-Extreme | Bearish-Extreme | Bearish |
| NET POSITION MOVEMENT INDEX: | | | |
| – 6-Week Change in Strength Index: | 5.9 | -3.6 | -13.9 |
Euro Currency Futures:
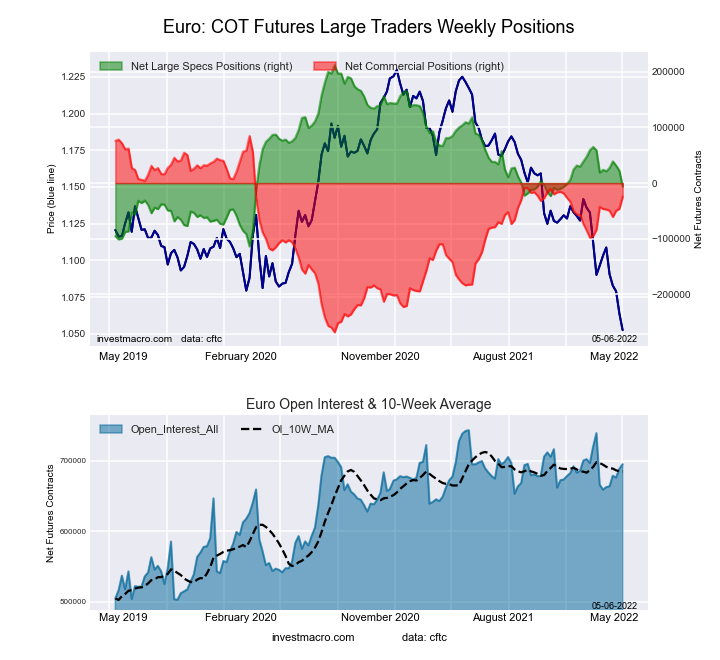 The Euro Currency large speculator standing this week came in at a net position of -6,378 contracts in the data reported through Tuesday. This was a weekly lowering of -28,579 contracts from the previous week which had a total of 22,201 net contracts.
This week’s current strength score (the trader positioning range over the past three years, measured from 0 to 100) shows the speculators are currently Bearish with a score of 33.0 percent. The commercials are Bullish with a score of 69.0 percent and the small traders (not shown in chart) are Bearish with a score of 25.7 percent.
| EURO Currency Statistics | SPECULATORS | COMMERCIALS | SMALL TRADERS |
| – Percent of Open Interest Longs: | 30.0 | 55.1 | 12.7 |
| – Percent of Open Interest Shorts: | 30.9 | 58.7 | 8.2 |
| – Net Position: | -6,378 | -24,586 | 30,964 |
| – Gross Longs: | 208,449 | 383,222 | 88,267 |
| – Gross Shorts: | 214,827 | 407,808 | 57,303 |
| – Long to Short Ratio: | 1.0 to 1 | 0.9 to 1 | 1.5 to 1 |
| NET POSITION TREND: | | | |
| – Strength Index Score (3 Year Range Pct): | 33.0 | 69.0 | 25.7 |
| – Strength Index Reading (3 Year Range): | Bearish | Bullish | Bearish |
| NET POSITION MOVEMENT INDEX: | | | |
| – 6-Week Change in Strength Index: | -9.3 | 6.2 | 13.9 |
British Pound Sterling Futures:
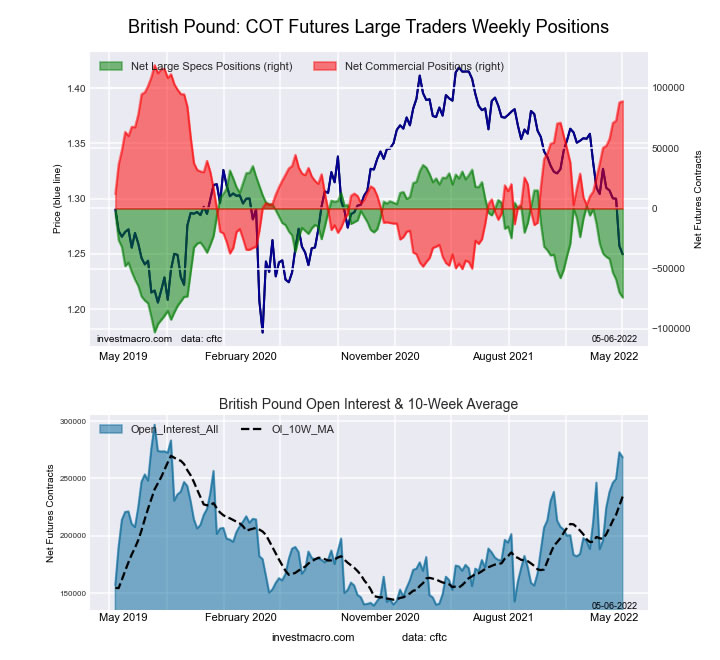
The British Pound Sterling large speculator standing this week came in at a net position of -73,813 contracts in the data reported through Tuesday. This was a weekly decline of -4,192 contracts from the previous week which had a total of -69,621 net contracts.
This week’s current strength score (the trader positioning range over the past three years, measured from 0 to 100) shows the speculators are currently Bearish with a score of 20.8 percent. The commercials are Bullish-Extreme with a score of 82.3 percent and the small traders (not shown in chart) are Bearish with a score of 24.1 percent.
| BRITISH POUND Statistics | SPECULATORS | COMMERCIALS | SMALL TRADERS |
| – Percent of Open Interest Longs: | 12.5 | 77.7 | 7.7 |
| – Percent of Open Interest Shorts: | 40.0 | 44.6 | 13.3 |
| – Net Position: | -73,813 | 89,026 | -15,213 |
| – Gross Longs: | 33,536 | 208,754 | 20,590 |
| – Gross Shorts: | 107,349 | 119,728 | 35,803 |
| – Long to Short Ratio: | 0.3 to 1 | 1.7 to 1 | 0.6 to 1 |
| NET POSITION TREND: | | | |
| – Strength Index Score (3 Year Range Pct): | 20.8 | 82.3 | 24.1 |
| – Strength Index Reading (3 Year Range): | Bearish | Bullish-Extreme | Bearish |
| NET POSITION MOVEMENT INDEX: | | | |
| – 6-Week Change in Strength Index: | -26.3 | 22.8 | -4.3 |
Japanese Yen Futures:
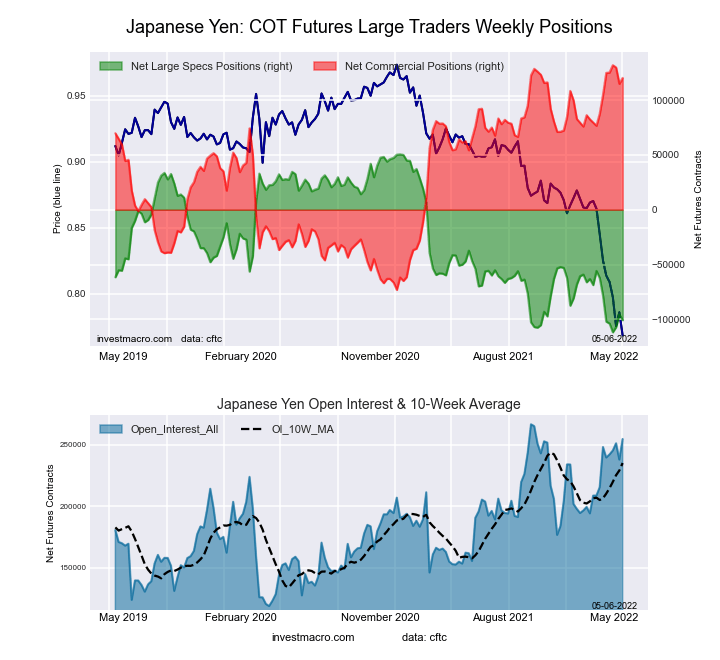 The Japanese Yen large speculator standing this week came in at a net position of -100,794 contracts in the data reported through Tuesday. This was a weekly lowering of -5,259 contracts from the previous week which had a total of -95,535 net contracts.
This week’s current strength score (the trader positioning range over the past three years, measured from 0 to 100) shows the speculators are currently Bearish-Extreme with a score of 6.8 percent. The commercials are Bullish-Extreme with a score of 94.3 percent and the small traders (not shown in chart) are Bearish-Extreme with a score of 13.9 percent.
| JAPANESE YEN Statistics | SPECULATORS | COMMERCIALS | SMALL TRADERS |
| – Percent of Open Interest Longs: | 7.3 | 84.6 | 7.1 |
| – Percent of Open Interest Shorts: | 46.8 | 37.4 | 14.7 |
| – Net Position: | -100,794 | 120,264 | -19,470 |
| – Gross Longs: | 18,585 | 215,563 | 18,007 |
| – Gross Shorts: | 119,379 | 95,299 | 37,477 |
| – Long to Short Ratio: | 0.2 to 1 | 2.3 to 1 | 0.5 to 1 |
| NET POSITION TREND: | | | |
| – Strength Index Score (3 Year Range Pct): | 6.8 | 94.3 | 13.9 |
| – Strength Index Reading (3 Year Range): | Bearish-Extreme | Bullish-Extreme | Bearish-Extreme |
| NET POSITION MOVEMENT INDEX: | | | |
| – 6-Week Change in Strength Index: | -13.7 | 7.5 | 13.9 |
Swiss Franc Futures:
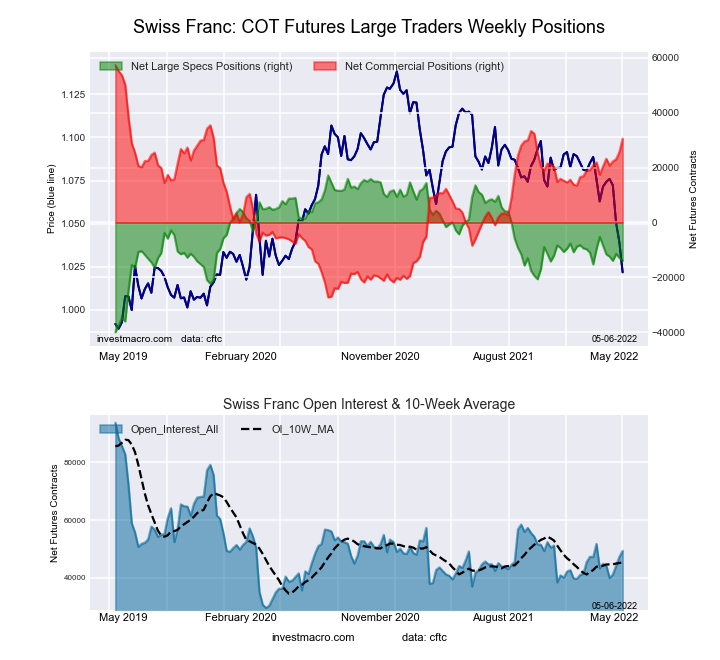 The Swiss Franc large speculator standing this week came in at a net position of -13,907 contracts in the data reported through Tuesday. This was a weekly decline of -1,038 contracts from the previous week which had a total of -12,869 net contracts.
This week’s current strength score (the trader positioning range over the past three years, measured from 0 to 100) shows the speculators are currently Bearish with a score of 45.7 percent. The commercials are Bullish with a score of 68.3 percent and the small traders (not shown in chart) are Bearish-Extreme with a score of 7.3 percent.
| SWISS FRANC Statistics | SPECULATORS | COMMERCIALS | SMALL TRADERS |
| – Percent of Open Interest Longs: | 8.8 | 75.8 | 15.0 |
| – Percent of Open Interest Shorts: | 37.0 | 13.9 | 48.7 |
| – Net Position: | -13,907 | 30,542 | -16,635 |
| – Gross Longs: | 4,357 | 37,429 | 7,397 |
| – Gross Shorts: | 18,264 | 6,887 | 24,032 |
| – Long to Short Ratio: | 0.2 to 1 | 5.4 to 1 | 0.3 to 1 |
| NET POSITION TREND: | | | |
| – Strength Index Score (3 Year Range Pct): | 45.7 | 68.3 | 7.3 |
| – Strength Index Reading (3 Year Range): | Bearish | Bullish | Bearish-Extreme |
| NET POSITION MOVEMENT INDEX: | | | |
| – 6-Week Change in Strength Index: | -9.6 | 11.9 | -14.5 |
Canadian Dollar Futures:
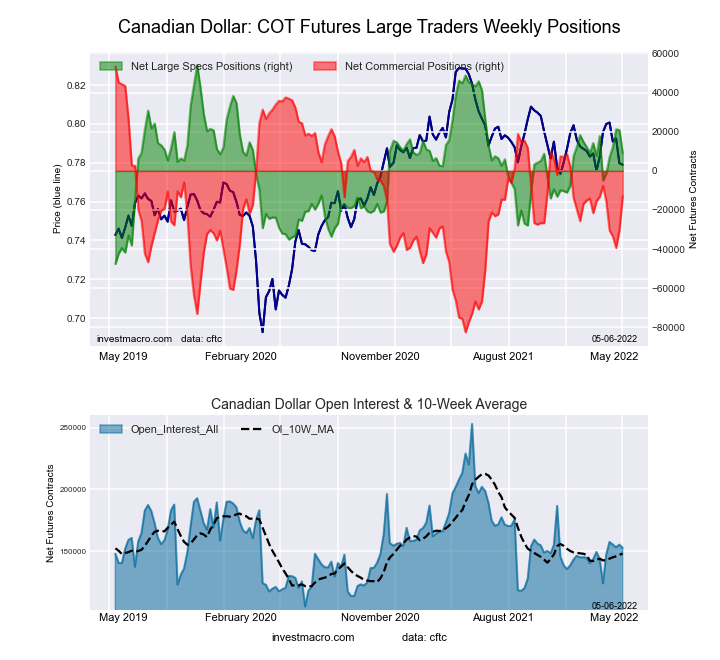 The Canadian Dollar large speculator standing this week came in at a net position of 9,029 contracts in the data reported through Tuesday. This was a weekly decrease of -11,852 contracts from the previous week which had a total of 20,881 net contracts.
This week’s current strength score (the trader positioning range over the past three years, measured from 0 to 100) shows the speculators are currently Bullish with a score of 55.7 percent. The commercials are Bullish with a score of 51.2 percent and the small traders (not shown in chart) are Bearish with a score of 37.6 percent.
| CANADIAN DOLLAR Statistics | SPECULATORS | COMMERCIALS | SMALL TRADERS |
| – Percent of Open Interest Longs: | 29.2 | 47.5 | 21.0 |
| – Percent of Open Interest Shorts: | 23.3 | 56.0 | 18.4 |
| – Net Position: | 9,029 | -12,959 | 3,930 |
| – Gross Longs: | 44,670 | 72,629 | 32,093 |
| – Gross Shorts: | 35,641 | 85,588 | 28,163 |
| – Long to Short Ratio: | 1.3 to 1 | 0.8 to 1 | 1.1 to 1 |
| NET POSITION TREND: | | | |
| – Strength Index Score (3 Year Range Pct): | 55.7 | 51.2 | 37.6 |
| – Strength Index Reading (3 Year Range): | Bullish | Bullish | Bearish |
| NET POSITION MOVEMENT INDEX: | | | |
| – 6-Week Change in Strength Index: | 13.8 | -4.0 | -17.1 |
Australian Dollar Futures:
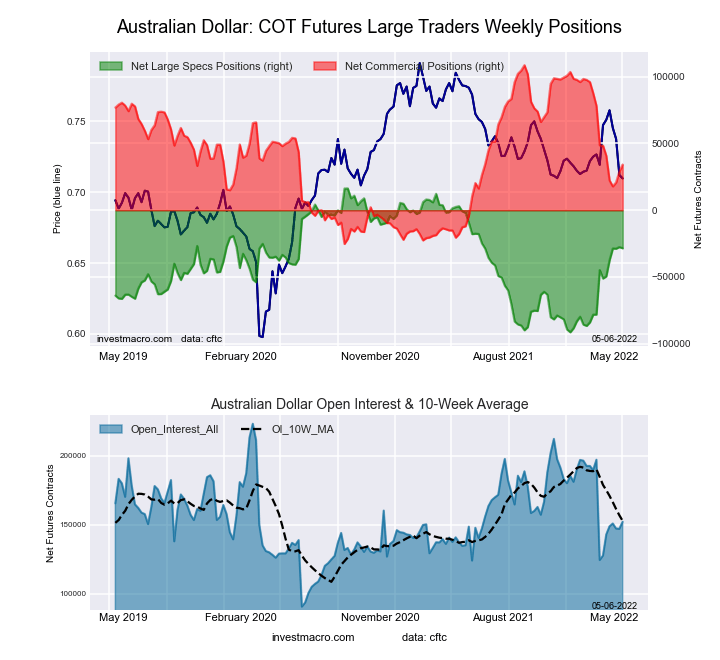 The Australian Dollar large speculator standing this week came in at a net position of -28,516 contracts in the data reported through Tuesday. This was a weekly decrease of -865 contracts from the previous week which had a total of -27,651 net contracts.
This week’s current strength score (the trader positioning range over the past three years, measured from 0 to 100) shows the speculators are currently Bullish with a score of 58.4 percent. The commercials are Bearish with a score of 44.4 percent and the small traders (not shown in chart) are Bearish with a score of 38.5 percent.
| AUSTRALIAN DOLLAR Statistics | SPECULATORS | COMMERCIALS | SMALL TRADERS |
| – Percent of Open Interest Longs: | 30.9 | 52.6 | 14.0 |
| – Percent of Open Interest Shorts: | 49.6 | 30.2 | 17.8 |
| – Net Position: | -28,516 | 34,225 | -5,709 |
| – Gross Longs: | 46,995 | 80,147 | 21,330 |
| – Gross Shorts: | 75,511 | 45,922 | 27,039 |
| – Long to Short Ratio: | 0.6 to 1 | 1.7 to 1 | 0.8 to 1 |
| NET POSITION TREND: | | | |
| – Strength Index Score (3 Year Range Pct): | 58.4 | 44.4 | 38.5 |
| – Strength Index Reading (3 Year Range): | Bullish | Bearish | Bearish |
| NET POSITION MOVEMENT INDEX: | | | |
| – 6-Week Change in Strength Index: | 21.0 | -10.6 | -20.8 |
New Zealand Dollar Futures:
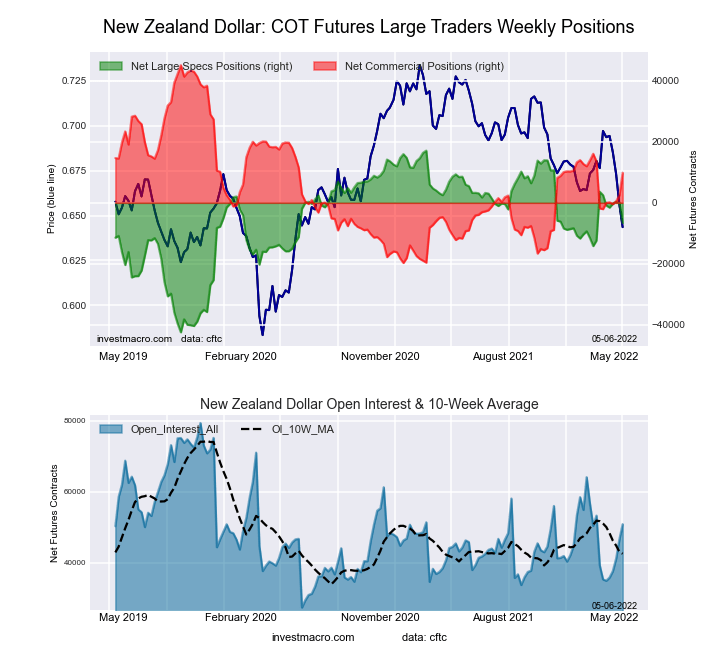 The New Zealand Dollar large speculator standing this week came in at a net position of -6,610 contracts in the data reported through Tuesday. This was a weekly decrease of -6,676 contracts from the previous week which had a total of 66 net contracts.
This week’s current strength score (the trader positioning range over the past three years, measured from 0 to 100) shows the speculators are currently Bullish with a score of 60.2 percent. The commercials are Bearish with a score of 45.6 percent and the small traders (not shown in chart) are Bearish-Extreme with a score of 14.4 percent.
| NEW ZEALAND DOLLAR Statistics | SPECULATORS | COMMERCIALS | SMALL TRADERS |
| – Percent of Open Interest Longs: | 34.3 | 60.6 | 4.8 |
| – Percent of Open Interest Shorts: | 47.3 | 41.1 | 11.2 |
| – Net Position: | -6,610 | 9,879 | -3,269 |
| – Gross Longs: | 17,427 | 30,789 | 2,423 |
| – Gross Shorts: | 24,037 | 20,910 | 5,692 |
| – Long to Short Ratio: | 0.7 to 1 | 1.5 to 1 | 0.4 to 1 |
| NET POSITION TREND: | | | |
| – Strength Index Score (3 Year Range Pct): | 60.2 | 45.6 | 14.4 |
| – Strength Index Reading (3 Year Range): | Bullish | Bearish | Bearish-Extreme |
| NET POSITION MOVEMENT INDEX: | | | |
| – 6-Week Change in Strength Index: | -15.3 | 18.4 | -32.3 |
Mexican Peso Futures:
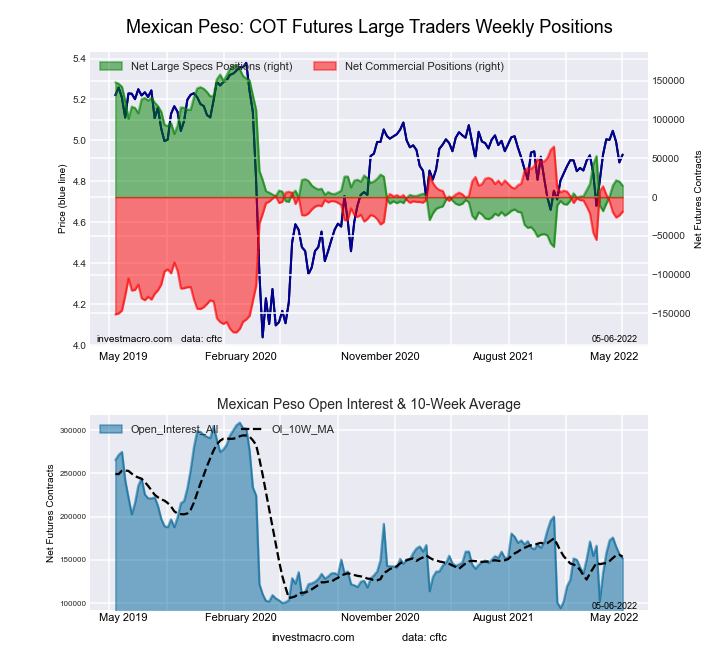 The Mexican Peso large speculator standing this week came in at a net position of 14,623 contracts in the data reported through Tuesday. This was a weekly reduction of -5,503 contracts from the previous week which had a total of 20,126 net contracts.
This week’s current strength score (the trader positioning range over the past three years, measured from 0 to 100) shows the speculators are currently Bearish with a score of 33.6 percent. The commercials are Bullish with a score of 65.1 percent and the small traders (not shown in chart) are Bullish with a score of 59.7 percent.
| MEXICAN PESO Statistics | SPECULATORS | COMMERCIALS | SMALL TRADERS |
| – Percent of Open Interest Longs: | 42.0 | 52.3 | 4.5 |
| – Percent of Open Interest Shorts: | 32.4 | 64.5 | 1.9 |
| – Net Position: | 14,623 | -18,552 | 3,929 |
| – Gross Longs: | 63,860 | 79,394 | 6,771 |
| – Gross Shorts: | 49,237 | 97,946 | 2,842 |
| – Long to Short Ratio: | 1.3 to 1 | 0.8 to 1 | 2.4 to 1 |
| NET POSITION TREND: | | | |
| – Strength Index Score (3 Year Range Pct): | 33.6 | 65.1 | 59.7 |
| – Strength Index Reading (3 Year Range): | Bearish | Bullish | Bullish |
| NET POSITION MOVEMENT INDEX: | | | |
| – 6-Week Change in Strength Index: | 13.9 | -13.5 | -0.9 |
Brazilian Real Futures:
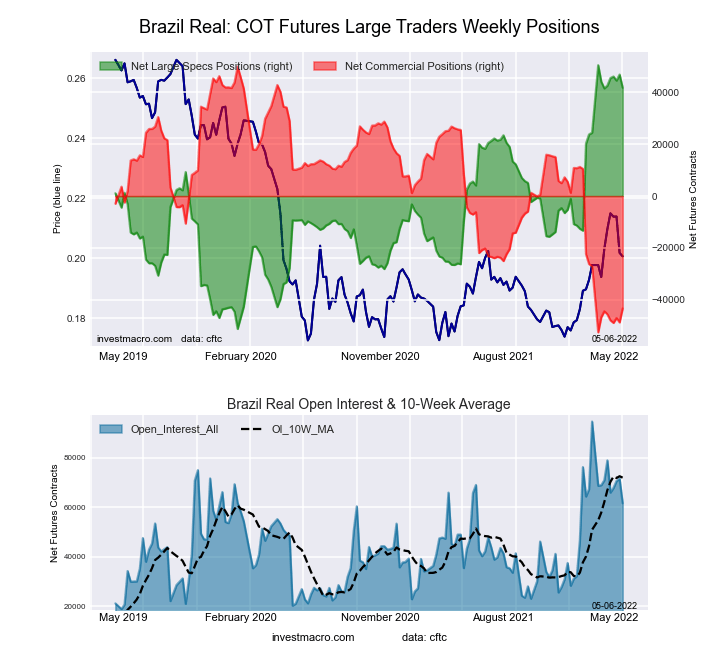 The Brazilian Real large speculator standing this week came in at a net position of 41,788 contracts in the data reported through Tuesday. This was a weekly lowering of -5,096 contracts from the previous week which had a total of 46,884 net contracts.
This week’s current strength score (the trader positioning range over the past three years, measured from 0 to 100) shows the speculators are currently Bullish-Extreme with a score of 91.4 percent. The commercials are Bearish-Extreme with a score of 9.0 percent and the small traders (not shown in chart) are Bullish-Extreme with a score of 83.3 percent.
| BRAZIL REAL Statistics | SPECULATORS | COMMERCIALS | SMALL TRADERS |
| – Percent of Open Interest Longs: | 81.2 | 13.5 | 5.3 |
| – Percent of Open Interest Shorts: | 13.3 | 83.9 | 2.8 |
| – Net Position: | 41,788 | -43,371 | 1,583 |
| – Gross Longs: | 49,991 | 8,280 | 3,278 |
| – Gross Shorts: | 8,203 | 51,651 | 1,695 |
| – Long to Short Ratio: | 6.1 to 1 | 0.2 to 1 | 1.9 to 1 |
| NET POSITION TREND: | | | |
| – Strength Index Score (3 Year Range Pct): | 91.4 | 9.0 | 83.3 |
| – Strength Index Reading (3 Year Range): | Bullish-Extreme | Bearish-Extreme | Bullish-Extreme |
| NET POSITION MOVEMENT INDEX: | | | |
| – 6-Week Change in Strength Index: | 0.2 | 1.1 | -15.4 |
Bitcoin Futures:
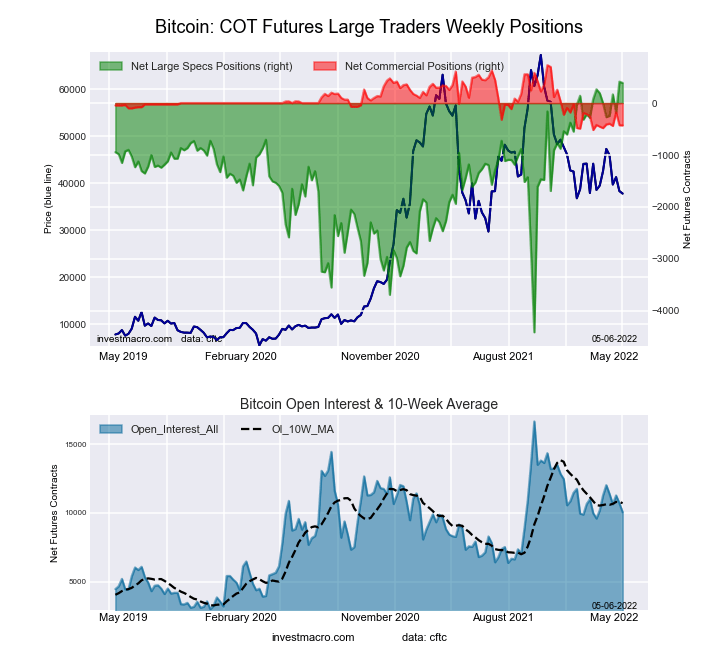 The Bitcoin large speculator standing this week came in at a net position of 388 contracts in the data reported through Tuesday. This was a weekly decrease of -24 contracts from the previous week which had a total of 412 net contracts.
This week’s current strength score (the trader positioning range over the past three years, measured from 0 to 100) shows the speculators are currently Bullish-Extreme with a score of 99.5 percent. The commercials are Bearish-Extreme with a score of 7.1 percent and the small traders (not shown in chart) are Bearish-Extreme with a score of 13.9 percent.
| BITCOIN Statistics | SPECULATORS | COMMERCIALS | SMALL TRADERS |
| – Percent of Open Interest Longs: | 80.8 | 3.0 | 8.6 |
| – Percent of Open Interest Shorts: | 76.9 | 7.2 | 8.2 |
| – Net Position: | 388 | -429 | 41 |
| – Gross Longs: | 8,121 | 298 | 867 |
| – Gross Shorts: | 7,733 | 727 | 826 |
| – Long to Short Ratio: | 1.1 to 1 | 0.4 to 1 | 1.0 to 1 |
| NET POSITION TREND: | | | |
| – Strength Index Score (3 Year Range Pct): | 99.5 | 7.1 | 13.9 |
| – Strength Index Reading (3 Year Range): | Bullish-Extreme | Bearish-Extreme | Bearish-Extreme |
| NET POSITION MOVEMENT INDEX: | | | |
| – 6-Week Change in Strength Index: | 8.0 | 4.2 | -10.0 |
Article By InvestMacro – Receive our weekly COT Reports by Email
*COT Report: The COT data, released weekly to the public each Friday, is updated through the most recent Tuesday (data is 3 days old) and shows a quick view of how large speculators or non-commercials (for-profit traders) were positioned in the futures markets.
The CFTC categorizes trader positions according to commercial hedgers (traders who use futures contracts for hedging as part of the business), non-commercials (large traders who speculate to realize trading profits) and nonreportable traders (usually small traders/speculators) as well as their open interest (contracts open in the market at time of reporting).See CFTC criteria here.


