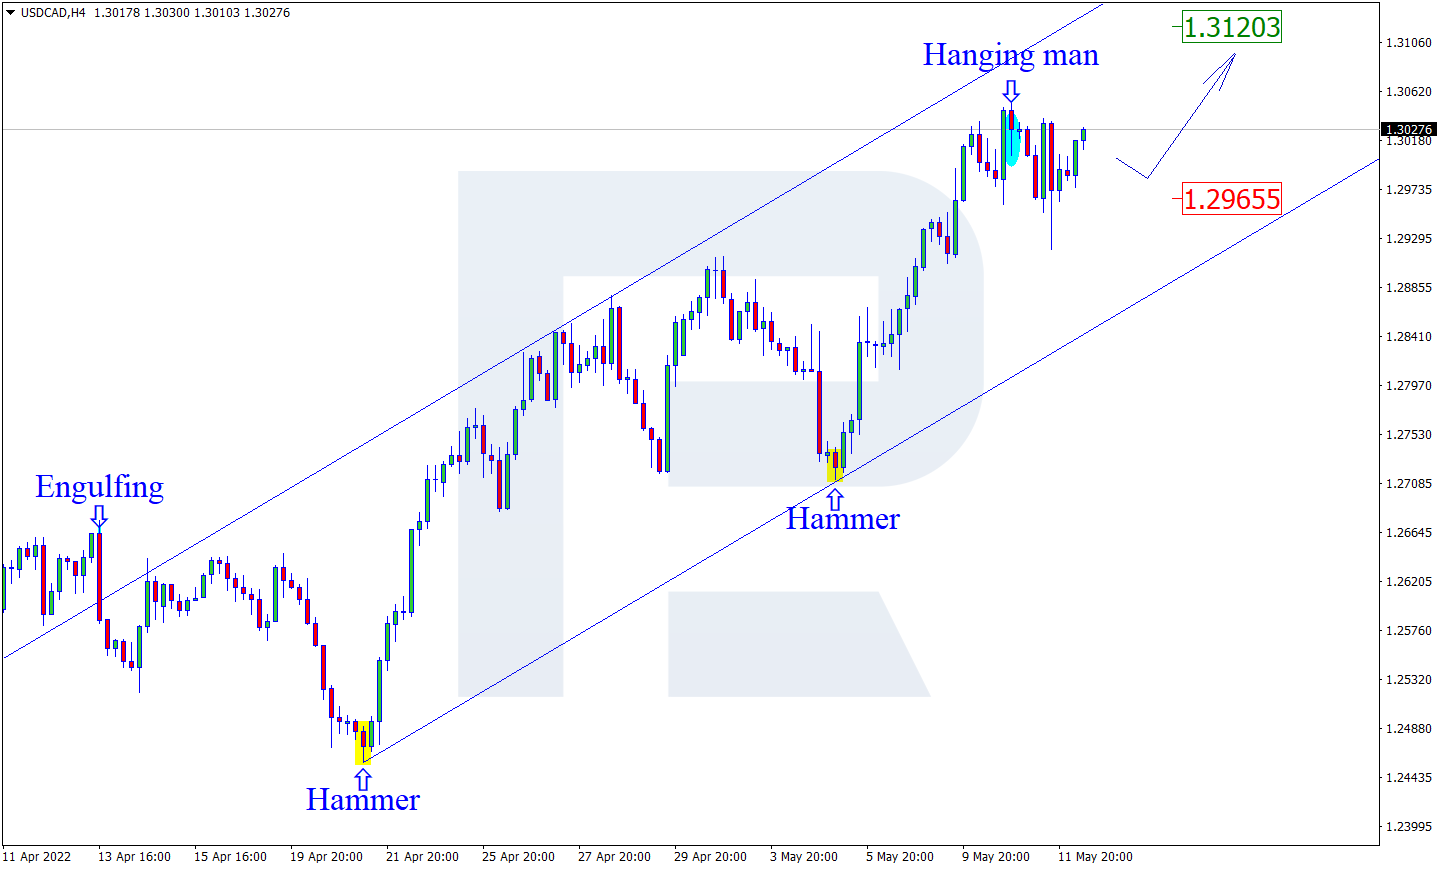
As we can see in the H4 chart, after forming a Hanging Man reversal pattern close to the resistance level, USDCAD is reversing in the form of a new descending impulse. In this case, the downside target may be at 1.2965. However, an alternative scenario implies that the asset may grow to break the resistance level at 1.3120 and continue the ascending tendency without any corrections.
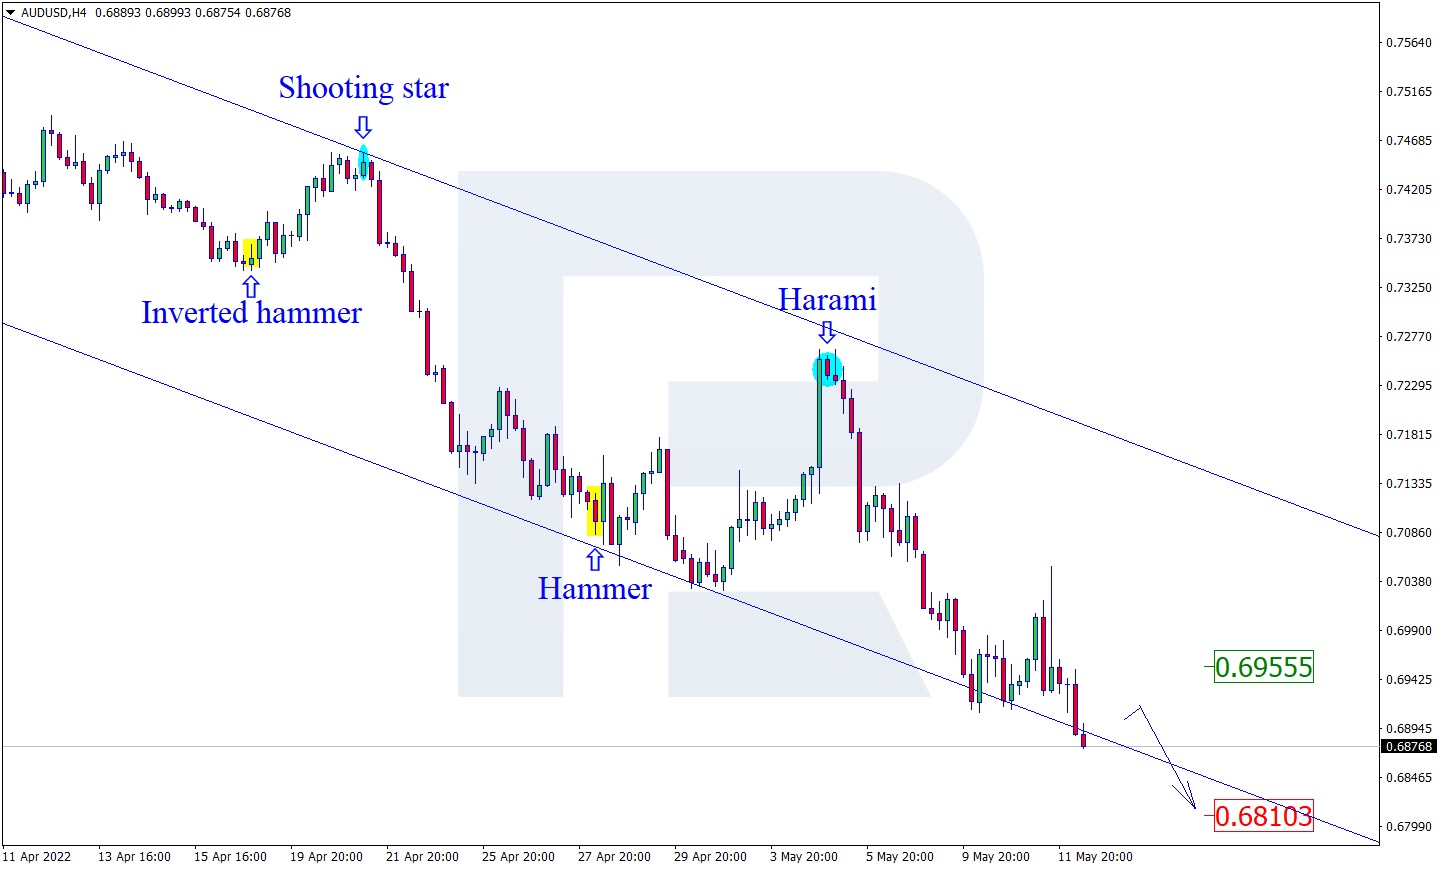
AUDUSD, “Australian Dollar vs US Dollar”
As we can see in the H4 chart, AUDUSD has formed a Harami reversal pattern near the resistance area. At the moment, the asset is reversing and starting a new descending impulse. In this case, the downside target may be the support level at 0.6810. After testing the level, the price may break it and continue the descending tendency. At the same time, an opposite scenario implies that the price may correct to reach 0.6955 before resuming the downtrend.
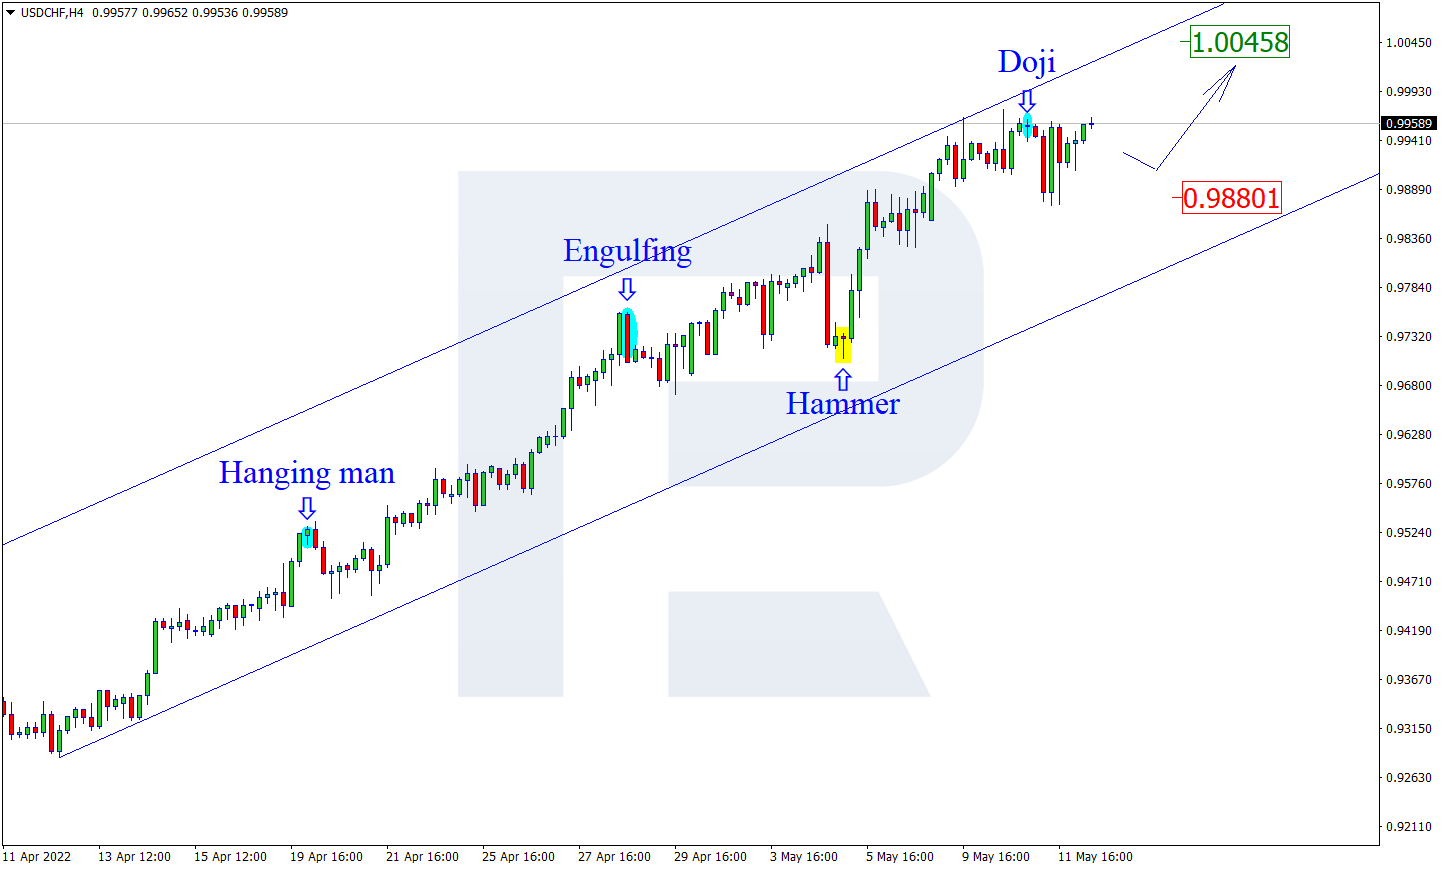
USDCHF, “US Dollar vs Swiss Franc”
As we can see in the H4 chart, after testing the resistance area, the pair has formed a Doji reversal pattern. At the moment, USDCHF may reverse in the form of a new descending impulse. In this case, the downside target may be at 0.9880. After testing the support level, the price may rebound from it and resume trading upwards. Still, there might be an alternative scenario, according to which the asset may grow to reach 1.0045 without any pullbacks.
Attention! Forecasts presented in this section only reflect the author’s private opinion and should not be considered as guidance for trading. RoboForex LP bears no responsibility for trading results based on trading recommendations described in these analytical reviews.
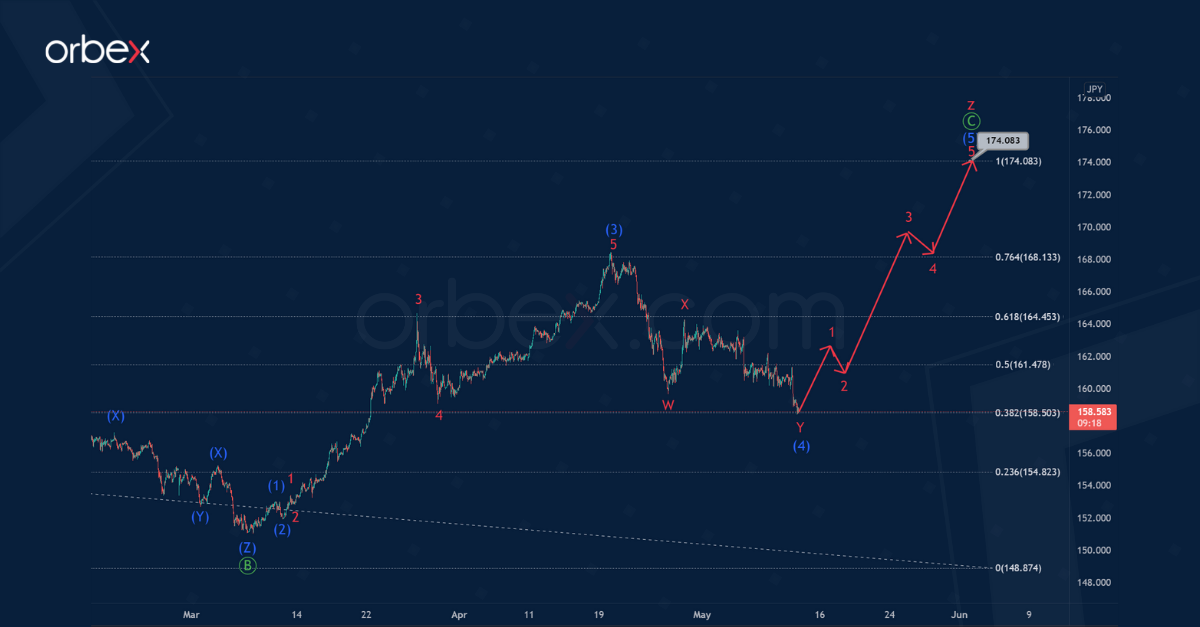
GBPJPY seems to be forming a large corrective trend, taking the form of a triple zigzag. On the 1H timeframe, the final actionary wave z of the cycle degree is in formation.
It is likely that the wave z takes the form of a simple zigzag Ⓐ-Ⓑ-Ⓒ of the primary degree. After the end of the correction Ⓑ, which took the form of a triple combination, prices began moving higher.
It is possible that the first four parts are completed as part of the potential impulse Ⓒ. Thus, in the next coming trading weeks, growth is likely within the intermediate impulse (5).
The completion of the entire wave Ⓒ is possible near 174.08. At that level, wave z will be equal to wave y.
Alternatively, it is assumed that the formation of an intermediate impulse (3), which is part of the primary wave Ⓒ, has come to an end near 168.43.
In the last section of the chart, we see a corrective decline in the intermediate wave (4). This correction could be a minor double zigzag.
It is possible that prices will fall to 155.15. At that level, correction wave (4) will be at 76.4% of impulse (3).
Orbex is a fully licensed broker that was established in 2011. Founded with a mission to serve its traders responsibly and provides traders with access to the world’s largest and most liquid financial markets. www.orbex.com
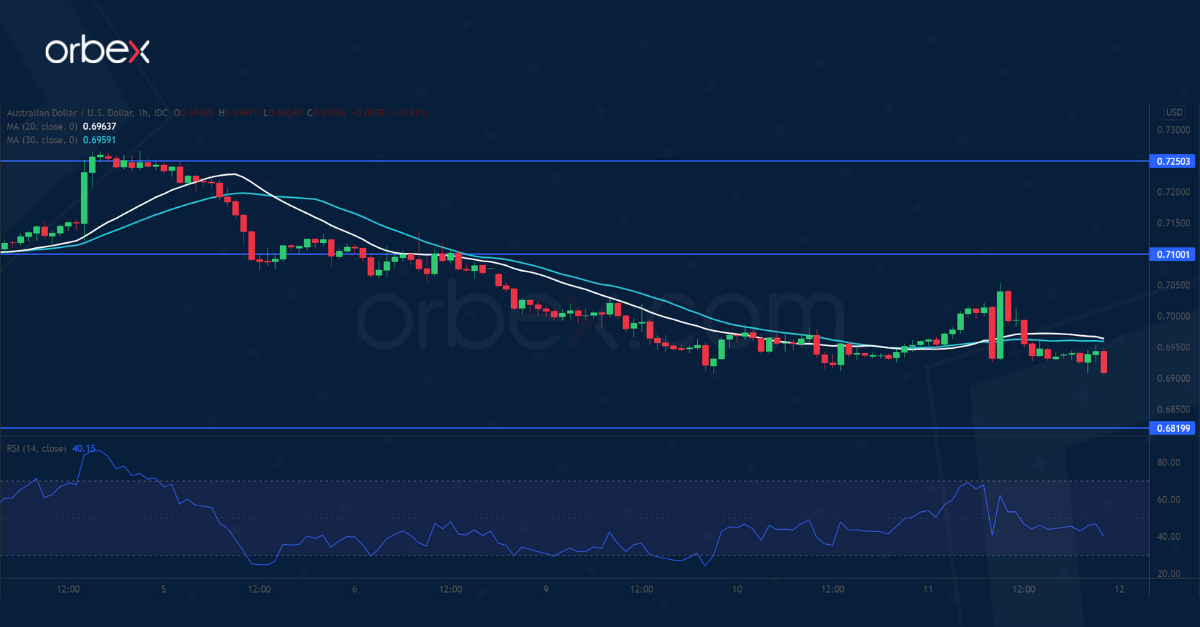
The Australian dollar struggles as Beijing vows to support its Covid-hit economy. A drop below the psychological level of 0.7000 near this year’s low may have put the Aussie on a bearish trajectory in the medium-term. On the hourly chart, the RSI’s double bottom in the oversold area may cause a limited rebound. Selling interest could be expected at 0.7100 at the origin of the latest sell-off. A drop below the intermediate support at 0.6920 would extend losses towards June 2020’s lows around 0.6820.
XAUUSD tests demand area
Bullion steadied after the US CPI receded in April. The price action has found some support at the base of the February bullish breakout. A bullish RSI divergence indicates a slowdown in the downward momentum, a prerequisite for a reversal. 1868 is a key resistance and a breakout would confirm the demand zone and prompt sellers to cover their bets. Then 1910 is the last hurdle before sentiment would turn around. On the downside, a break below 1831 would send the precious metal to the psychological level of 1800.
USOIL bounces higher
WTI crude rallies as Russia retaliates by sanctioning European gas companies. A fall below the rising trendline near 106.00 has put the bulls on the defensive. The price has met bids at 98.50 and in conjunction with a bullish RSI divergence could attract more buying interest. Optimism may gain traction if buyers succeed in holding above this demand zone. A close above support-turned-resistance at 107.00 would put the bulls back in the game. Then a break above 111.00 could trigger an extended rally above 117.00.
Orbex is a fully licensed broker that was established in 2011. Founded with a mission to serve its traders responsibly and provides traders with access to the world’s largest and most liquid financial markets. www.orbex.com
GBPUSD remains under bearish pressure; there is no good news.
The Pound sterling continues weakening against the USD on Thursday. the current quote for the instrument is 1.2205.
Today’s flow of statistics didn’t give the Pound a single chance to reach stability.
For example, it turned out that according to the preliminary report, the British economy added only 0.8% q/q in the first quarter of 2022 after gaining 1.3% q/q the quarter before and against the expected reading of 1.0% q/q. As for YoY, the GDP showed 8.7% against the expected reading of 9.0%.
The factors that slow down the British economy are quite common – the pandemic consequences, interruptions in the delivery chains, geopolitical tensions, and the necessity to adjust the country’s foreign policy. However, another thing that surfaces from time to time is Brexit, for example, the Northern Ireland issue. It’s kind of amazing that the status and the borders of such a small territory come with a high price tag. The lack of the Northern Ireland consensus might make trading operations and procedures between London and the European Union much more complicated, hurting the British business and GDP.
Industrial Production dropped 0.2% m/m in March against the expected growth of 0.1% m/m. It means that the negative tendency that started earlier is getting stronger: in February, the indicator lost 0.6% m/m. On YoY, it gained 1.9% against the expected reading of 2.3%. However, it’s not surprising – high inflation, the pandemic consequences, and interruptions in deliveries didn’t go anywhere and will continue to influence the economy in the future. in addition, there are problems with new orders. It’s bad news for the Pound.
Attention! Forecasts presented in this section only reflect the author’s private opinion and should not be considered as guidance for trading. RoboForex LP bears no responsibility for trading results based on trading recommendations described in these analytical reviews.
According to Executive Board member Isabelle Schnabel, the European Central Bank must respond to inflation, even if the factors pushing it to record levels are global in nature. The politician also added that global factors, which are largely driving inflation, do not mean that monetary policy can or should remain on the sidelines. Hence, it is necessary to act decisively now rather than act more later. At the moment, The ECB has maintained a soft stimulative monetary policy, which negatively affects the euro.
From the technical point of view, the trend on the EUR/USD currency pair on the hourly time frame is still bearish. The price is trading in a wide price corridor, and the MACD indicator has become inactive. Under such market conditions, traders can look for sell deals from the resistance level of 1.0646, but only after the additional confirmation. Buy trades can be considered on intraday timeframes from the support level of 1.0453, but only with short targets and confirmation.
Alternative scenario: if the price breaks out through the 1.0646 resistance level and fixes above, the uptrend will likely resume.
News feed for 2022.05.12:
– US Initial Jobless Claims (w/w) at 15:30 (GMT+3);
– US Producer Price Index (m/m) at 15:30 (GMT+3);
– US FOMC Member Daly Speaks at 22:00 (GMT+3).
The GBP/USD currency pair
Technical indicators of the currency pair:
Prev Open: 1.2314
Prev Close: 1.2246
% chg. over the last day: -0.55%
The British pound continues to lose ground against the dollar and the euro, although the Bank of England has already raised interest rates three times, and the ECB will only raise the rate in the second half of the year. Analysts believe that the Bank of England failed to forecast and completely misinterpreted the reasons for inflation. At the same time, Central Bank representatives do not make any statements. UK GDP declined by 0.1% last month, with industrial and manufacturing also showing a decline of 0.2%. The UK is slowly moving towards stagflation (a slowdown in economic growth with high inflation).
On the hourly time frame, the GBP/USD currency pair trend is still bearish. The price continues to decline, but the MACD indicator shows signs of divergence. Under such market conditions, sell trades should be looked for from the resistance level of 1.2276 intraday. For buy deals, traders may consider the level of 1.2127 if the price continues to decrease after the inflation data.
Alternative scenario: if the price breaks down through the 1.2519 resistance level and fixes above, the mid-term uptrend will likely be resumed.
News feed for 2022.05.12:
– UK GDP (m/m, q/q) at 09:00 (GMT+3);
– UK Industrial Production (m/m) at 09:00 (GMT+3);
– UK Manufacturing Production (m/m) at 09:00 (GMT+3).
The USD/JPY currency pair
Technical indicators of the currency pair:
Prev Open: 130.43
Prev Close: 129.96
% chg. over the last day: -0.36%
From a fundamental point of view, there is no change. The Bank of Japan’s prolonged stimulus program is increasingly being criticized for fueling an unwanted yen drop. Investors are paying attention to the widening gap between ultra-low interest rates in Japan and rising rates in other major economies. The Bank of Japan’s ultra-soft policy allows the government to maintain huge spending despite Japan’s growing national debt. But the country’s inflation rate is already approaching the 2% target, so analysts believe that the soft monetary policy is close to ending.
Trading recommendations
Support levels: 129.42, 128.55, 127.29, 126.91, 126.00, 125.57
Resistance levels: 130.12, 130.99
The medium-term trend on the USD/JPY currency pair is still bullish. Volatility has increased, with the price continuing to trade in a wide sideways. Under such market conditions, it is best to look for buy deals, expecting the continuation of the uptrend. First of all, it is worth considering the support level of 129.42. A resistance level of 130.12 or 130.99 may be considered for sell deals, but only with additional confirmation and short targets.
Alternative scenario: If the price fixes below 128.55, the uptrend will likely be broken.
There is no news feed for today.
The USD/CAD currency pair
Technical indicators of the currency pair:
Prev Open: 1.3021
Prev Close: 1.2992
% chg. over the last day: -0.22%
The Canadian dollar is a commodity currency and is highly dependent not only on the monetary policy of the Bank of Canada but also on the dynamics of the dollar index and oil prices. Oil prices jumped by 5% on Wednesday after Russia imposed sanctions on 31 companies that imposed sanctions on Moscow after the invasion of Ukraine. That gave momentum to the Canadian dollar, but after US CPI news was released, the rise in the dollar index offset the strengthening of the Canadian dollar.
Trading recommendations
Support levels: 1.2954, 1.2838, 1.2908, 1.2774, 1.2692, 1.2644, 1.2607, 1.2521
Resistance levels: 1.3044
The USD/CAD currency pair is bullish in terms of technical analysis. The price has reached the daily resistance level. The MACD indicator has become inactive. Trade is worth it only with short targets because, fundamentally, both the dollar index and the Canadian dollar are inclined to grow. Under such market conditions, it is better to look for buy trades on the lower timeframes from the support level of 1.2954, but only with additional confirmation. For sell deals, it is better to consider the resistance level of 1.3044, but it is also better with confirmation and short targets.
Alternative scenario: if the price breaks through and consolidates below 1.2838, the downtrend will likely be resumed.
This article reflects a personal opinion and should not be interpreted as an investment advice, and/or offer, and/or a persistent request for carrying out financial transactions, and/or a guarantee, and/or a forecast of future events.
– Global sentiment brightened on Wednesday with equities rebounding after a rally in technology companies helped reverse most of the losses on Wall Street overnight.
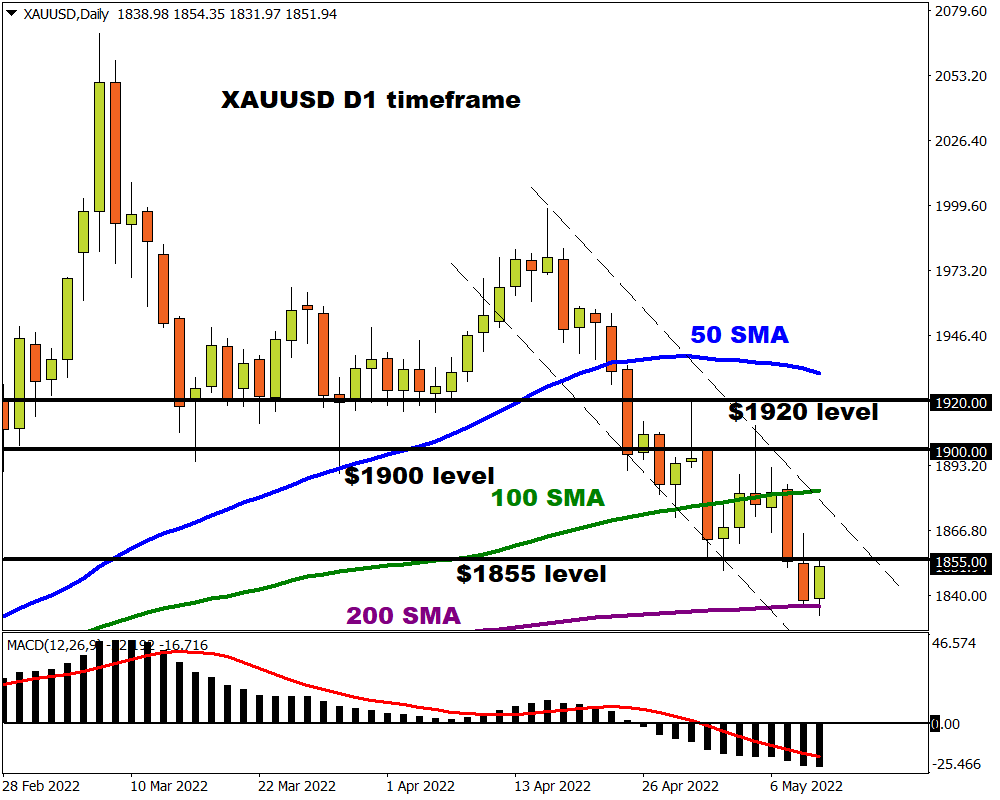
We already knew this would be an explosively volatile week for financial markets thanks to speeches from numerous Fed officials, ongoing geopolitical risks, and anticipation ahead of the US inflation report. Since Monday, there have been some significant movements with the dollar rallying to levels not seen in 20 years! Oil prices closed over 6% lower on Monday while gold secured a daily close under the $1855 support! There was some action in the FX space, with commodity currencies like the Australian Dollar and New Zealand dollar depreciating across the board.
With just less than one hour until the latest US CPI report is published, here and some technical setups we have our eyes on.
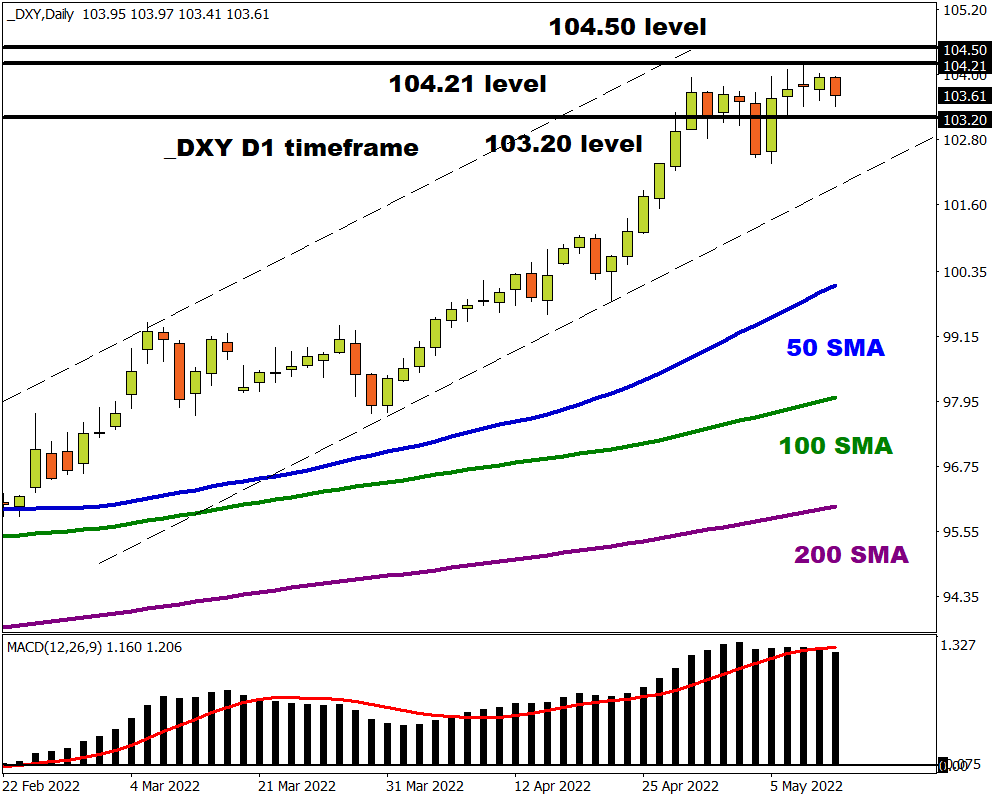
Dollar Index hovers near 20 year high
King Dollar marched into the week on a high note, reaching levels not seen in 20 years on Monday as U.S Treasury yields climbed on Fed rate hike expectations. Although prices have slightly retreated, the risk-off sentiment stemming from geopolitical risks should keep the DXY buoyed. Dollar volatility could remain a key theme, especially if the pending US CPI report exceeds expectations. Bulls may shift into higher gear on hawkish comments from Fed officials.
Looking at the technical picture, a strong daily close above 104.00 could open a path towards 104.50 and beyond. Sustained weakness below 104.21 could encourage a decline back towards 103.20.
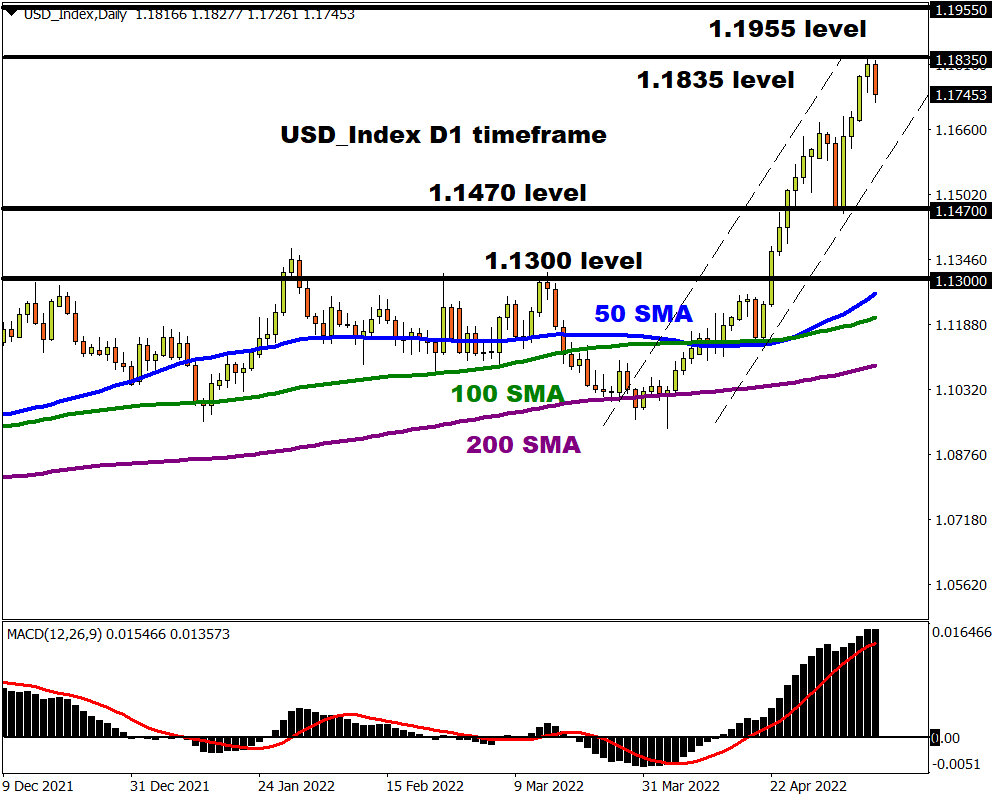
Equally weighted USD bullish
The subtitle says it all.
Prices are heavily bullish on the daily charts. There have been consistently higher highs and higher lows while prices are trading above the 50,100 and 200-day Simple Moving Average. A strong daily close above 1.1835 could encourage a move towards 1.1955. If bulls run out of steam below 1.1835, this could result in a technical throwback that sees prices trade back towards 1.1660 – 1.1600 before bulls return to the scene.
If prices sink back towards 1.1470, the equally-weighted USD index may decline back towards 1. 1300.
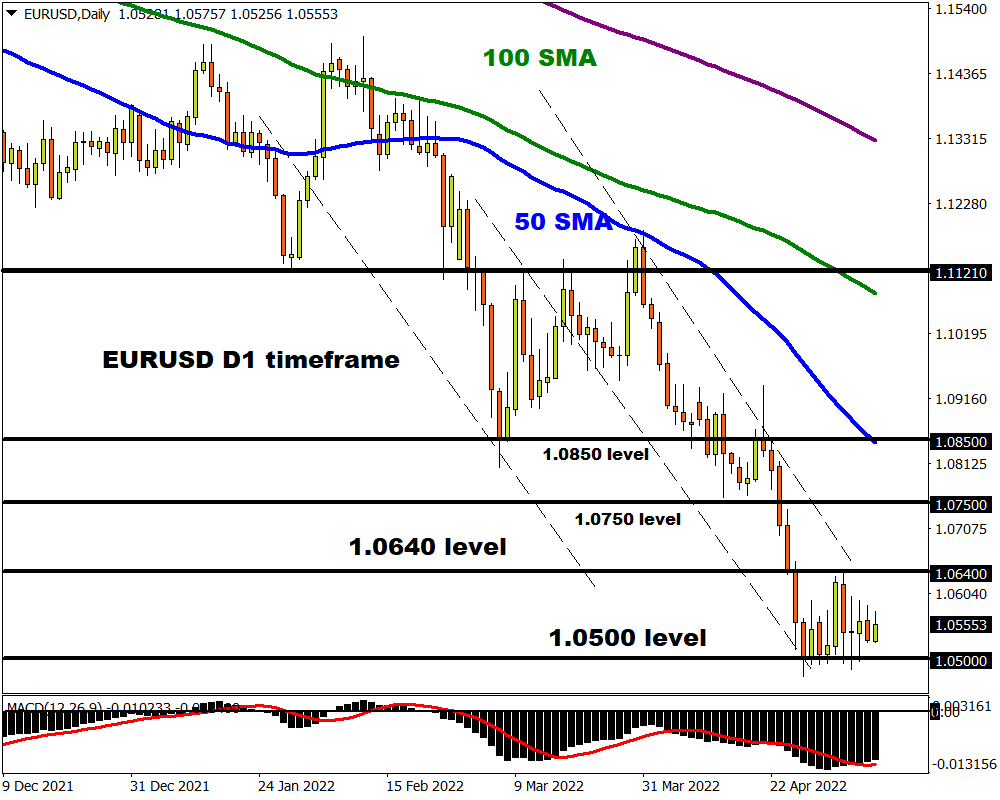
EURUSD on standby…
Where the EURUSD concludes this week may be heavily influenced by the US inflation data. The key levels of interest can be found at 1.0640 and 1.0500. A strong dollar could drag the currency pair well below 1.0500, opening the doors towards 1.0350. Should 1.0500 prove to be reliable support, this could trigger a rebound back to 1.0640.
Bonus: Gold glitters ahead of CPI data
A softer dollar has injected gold bugs with renewed confidence ahead of the US inflation. Prices have staged a rebound from the daily 200-day Simple Moving Average but are still below the $1855 support level. Regardless of the recent rebound, the precious metal may face headwinds in the form of rising treasury yields and expectations over the Fed maintaining an aggressive approach towards monetary policy. On the technical front, prices are bearish on the daily charts with support found at $1855. It will be interesting to see whether bulls can defend this level of bear’s drag prices even lower. Whatever the outcome, volatility is certainly on the cards.
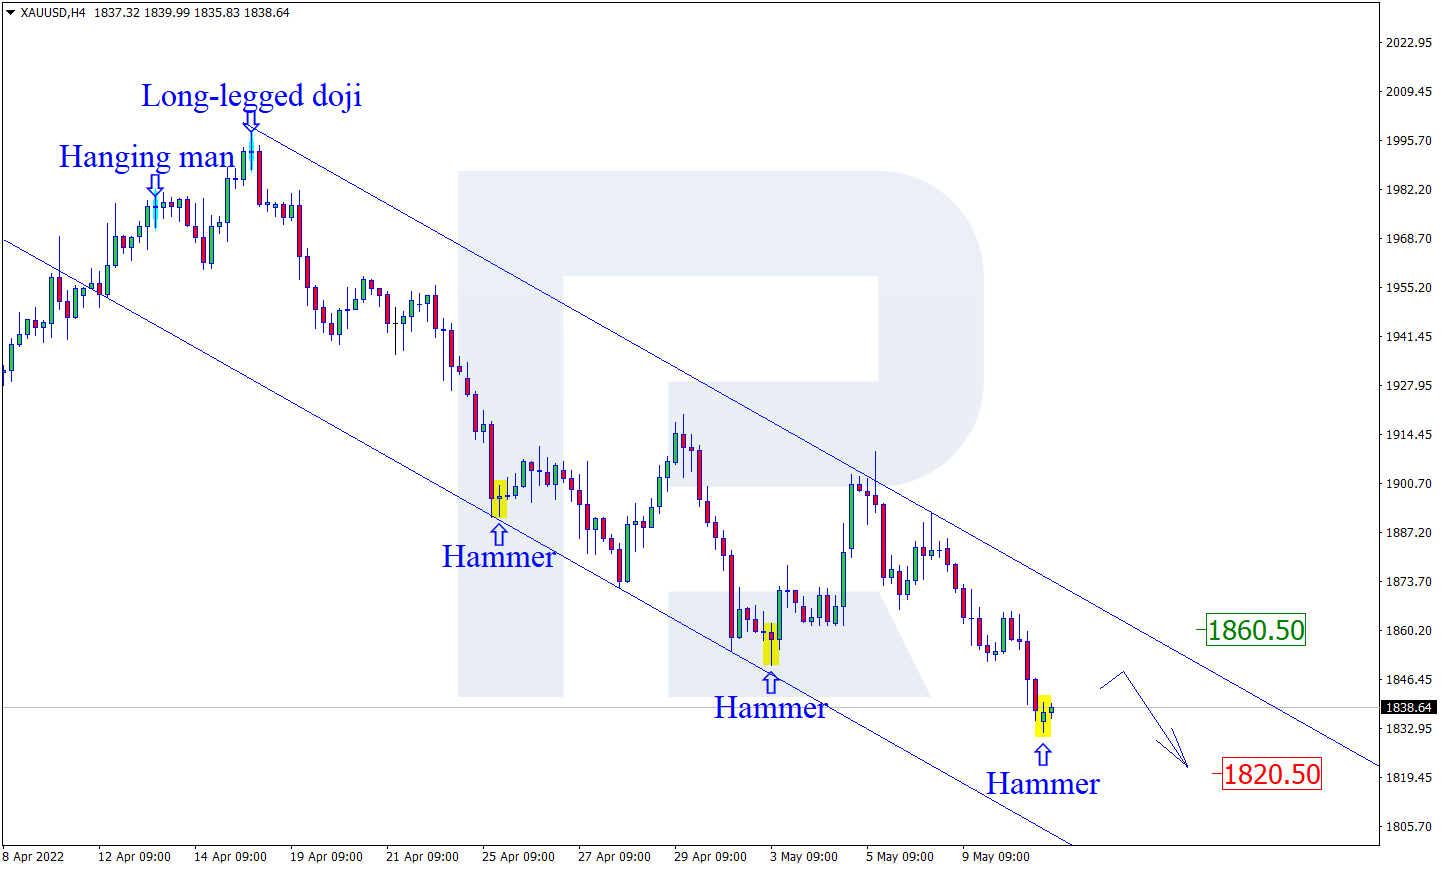
As we can see in the H4 chart, XAUUSD has formed a Hammer reversal pattern not far from the support area. At the moment, the asset is reversing in the form of another ascending impulse. In this case, the upside target may be the resistance level at 1860.50. At the same time, an opposite scenario implies that the price may fall to reach 1820.50 and continue the descending tendency without any pullbacks.
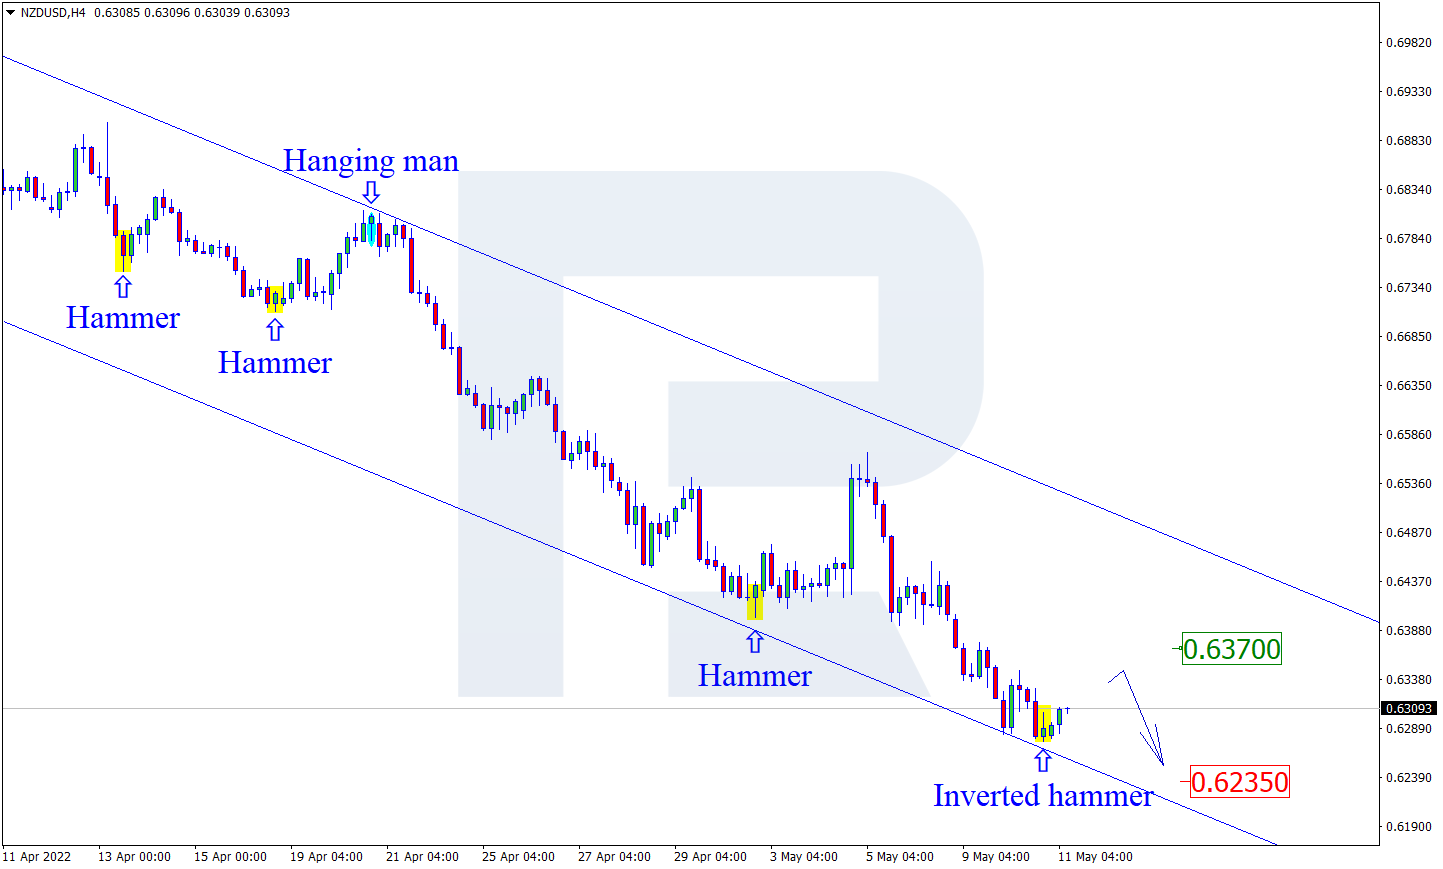
NZDUSD, “New Zealand vs US Dollar”
As we can see in the H4 chart, NZDUSD has formed an Inverted Hammer reversal pattern close to the support area. At the moment, the asset is reversing in the form of a new rising impulse. In this case, the upside target may be at 0.6370. After that, the asset may rebound from the resistance level and resume moving downwards. However, an alternative scenario implies that the price may fall to reach 0.6235 without any corrections.
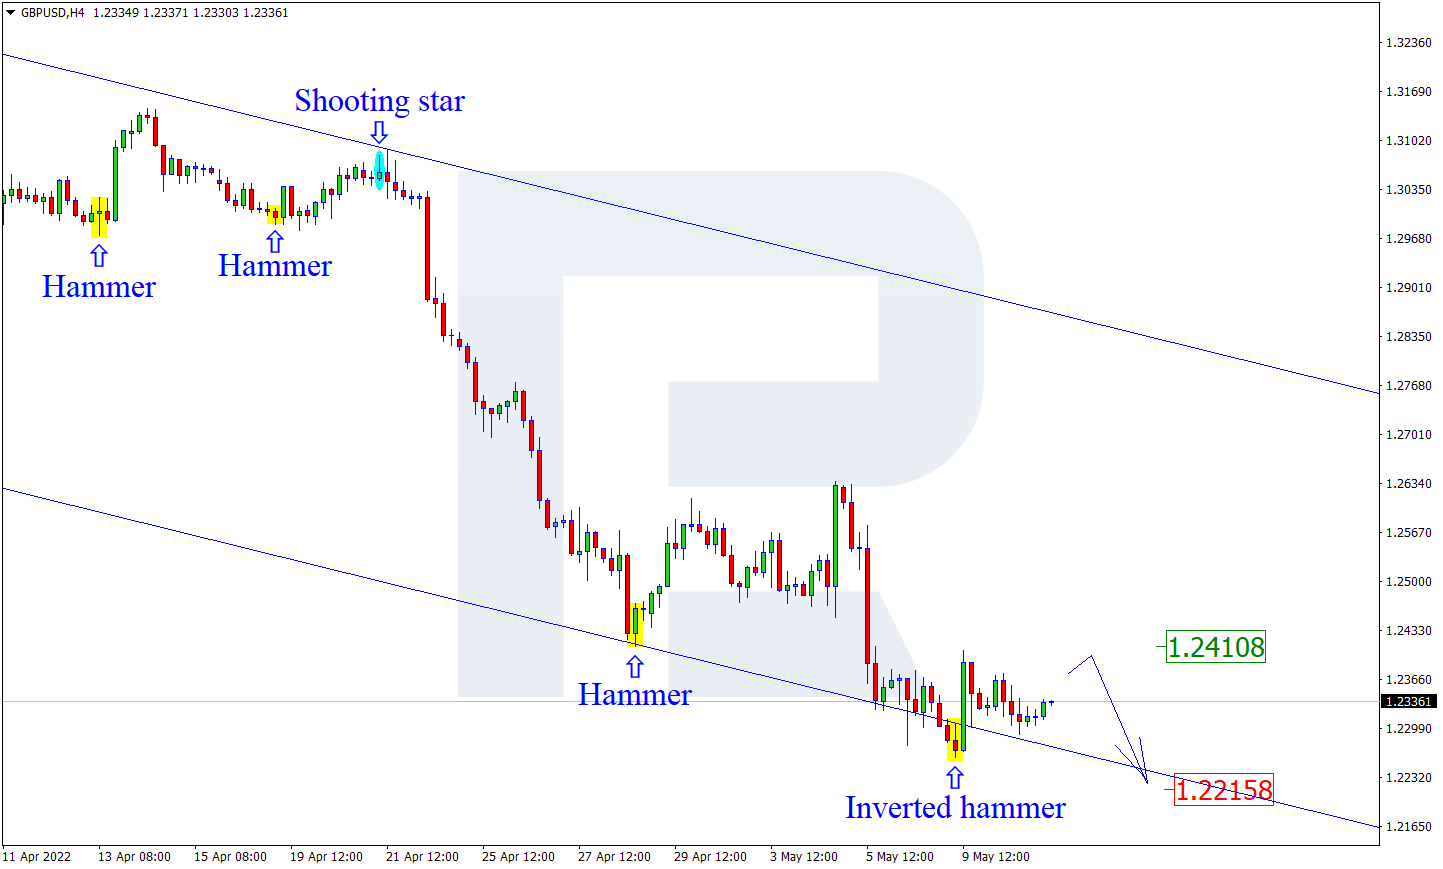
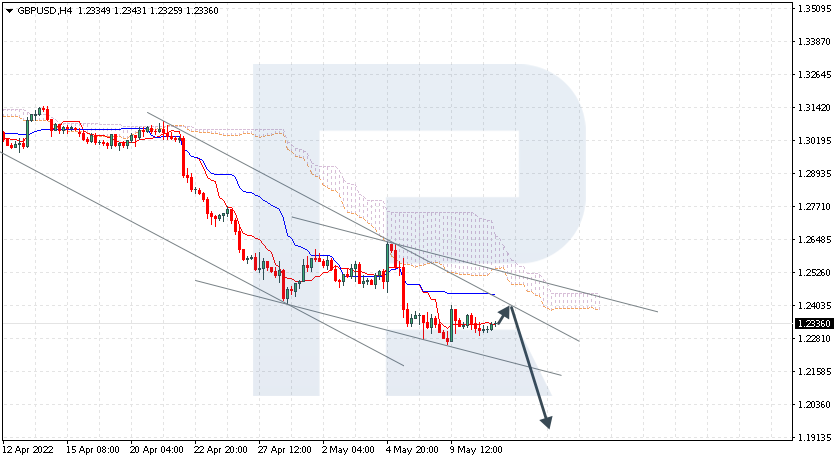
GBPUSD, “Great Britain Pound vs US Dollar”
As we can see in the H4 chart, GBPUSD has formed an Inverted Hammer reversal pattern near the support level. At the moment, the pair is reversing and may form a new correctional impulse. In this case, the upside target correctional may be at 1.2410. After testing the resistance area, the market may rebound from it and resume trading downwards. Still, there might be an alternative scenario, according to which the asset may fall to reach 1.2215 without any pullbacks.
Attention! Forecasts presented in this section only reflect the author’s private opinion and should not be considered as guidance for trading. RoboForex LP bears no responsibility for trading results based on trading recommendations described in these analytical reviews.
GBPUSD is rebounding from the resistance level. The instrument is currently moving below Ichimoku Cloud, thus indicating a descending tendency. The markets could indicate that the price may re-test Tenkan-Sen and Kijun-Sen at 1.2385 and then resume moving downwards to reach 1.1965 Another signal in favour of a further downtrend will be a rebound from the descending channel’s upside border. However, the bearish scenario may no longer be valid if the price breaks the cloud’s upside border and fixes above 1.2545. In this case, the pair may continue growing towards 1.2635. To confirm further decline, the asset must break the bearish channel’s downside border and fix below 1.2145.
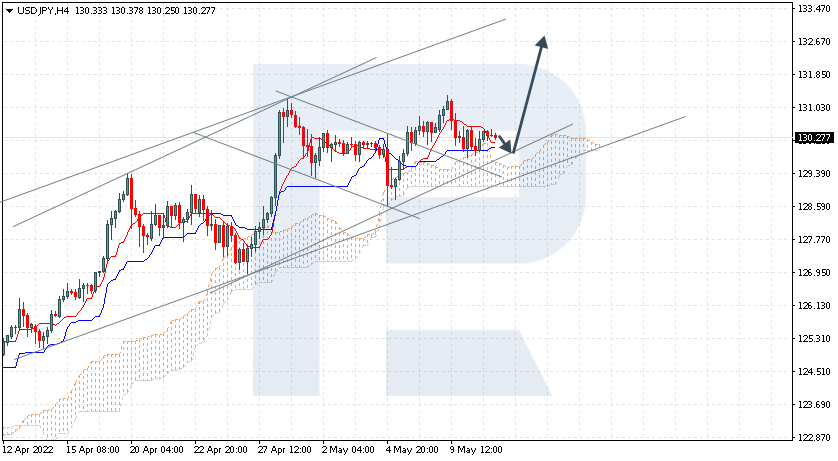
USDJPY, “US Dollar vs Japanese Yen”
USDJPY is correcting within the bullish channel. The instrument is currently moving above Ichimoku Cloud, thus indicating an ascending tendency. The markets could indicate that the price may test Tenkan-Sen and Kijun-Sen at 130.05 and then resume moving upwards to reach 132.65. Another signal in favour of a further uptrend will be a rebound from the rising channel’s downside border. However, the bullish scenario may no longer be valid if the price breaks the cloud’s downside border and fixes below 128.45. In this case, the pair may continue falling towards 127.55.
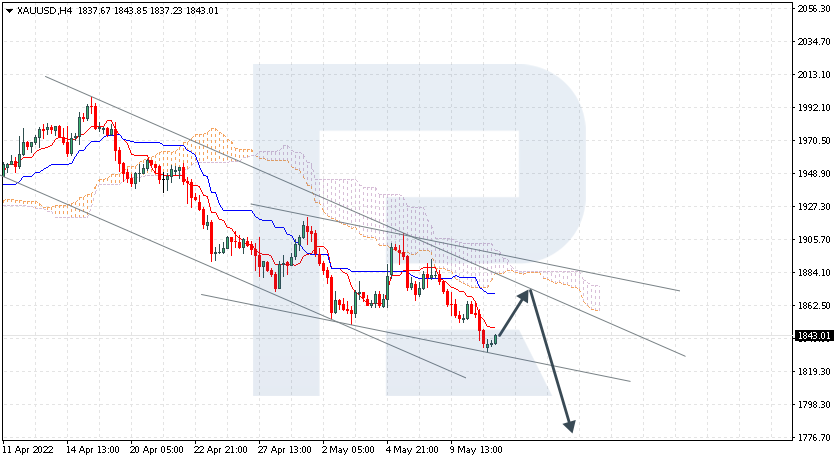
XAUUSD, “Gold vs US Dollar”
XAUUSD is rebounding from the bearish channel’s downside border. The instrument is currently moving below Ichimoku Cloud, thus indicating a descending tendency. The markets could indicate that the price may test Tenkan-Sen and Kijun-Sen at 1865.00 and then resume moving downwards to reach 1775.00. Another signal in favour of a further downtrend will be a rebound from the descending channel’s upside border. However, the bearish scenario may no longer be valid if the price breaks the cloud’s upside border and fixes above 1905.00. In this case, the pair may continue growing towards 1945.00.
Attention! Forecasts presented in this section only reflect the author’s private opinion and should not be considered as guidance for trading. RoboForex LP bears no responsibility for trading results based on trading recommendations described in these analytical reviews.
Today, investors and traders will closely monitor the April US Consumer Price Index for any signs that inflation may begin to cool off. Analysts expect annual inflation to fall to 8.1% (current level – 8.5%). Investors’ attention will also be focused on the inflation level in Germany, where analysts expect to see prices rise by 0.8%.
From the technical point of view, the trend on the EUR/USD currency pair on the hourly time frame is still bearish. The price forms a wide price corridor, the MACD indicator has become inactive, and volatility is reduced in anticipation of inflation data. Such narrowing of liquidity usually leads to sharp impulse movements. Under such market conditions, traders can look for sell deals from the resistance level of 1.0646, but only after the additional confirmation. Buy trades can be considered on intraday timeframes from the support level of 1.0453, but only with short targets and confirmation.
Alternative scenario: if the price breaks out through the 1.0723 resistance level and fixes above, the uptrend will likely resume.
News feed for 2022.05.11:
– US FOMC Member Bostic Speaks at 02:00 (GMT+3);
– German Consumer Price Index (m/m) at 09:00 (GMT+3);
– Eurozone ECB President Lagarde Speaks at 11:00 (GMT+3);
– US Consumer Price Index (m/m) at 15:30 (GMT+3).
The GBP/USD currency pair
Technical indicators of the currency pair:
Prev Open: 1.2329
Prev Close: 1.2315
% chg. over the last day: -0.11%
The British pound has lost ground against the euro, where the ECB has not yet raised interest rates. This means that the Bank of England is losing control, as the Bank of England has already raised interest rates three times, while the ECB will raise rates only in the second half of the year. Bank of England spokesman Michael Saunders said yesterday that UK inflation is expected to peak at 9% annually. Analysts believe that the Bank of England failed in its forecasting and completely misinterpreted the causes of high inflation.
On the hourly time frame, the GBP/USD currency pair trend is still bearish. The price forms a wide price corridor, the MACD indicator has become inactive, and trading activity has decreased. Such liquidity narrowing, as a rule, leads to sharp impulse movements. Under such market conditions, sell trades should be looked for from the resistance level of 1.2450 or 1.2519 intraday. For buy deals, traders may consider the level of 1.2127 if the price continues to decrease after the inflation data.
Alternative scenario: if the price breaks down through the 1.2695 resistance level and fixes above, the mid-term uptrend will likely be resumed.
There is no news feed for today.
The USD/JPY currency pair
Technical indicators of the currency pair:
Prev Open: 130.24
Prev Close: 130.43
% chg. over the last day: +0.15%
The Bank of Japan’s prolonged stimulus program has been increasingly criticized for fueling an unwanted yen drop. Investors are paying attention to the widening gap between ultra-low interest rates in Japan and rising rates in other major economies. The Bank of Japan’s ultra-soft policy allows the government to support huge spending despite Japan’s growing national debt. But the country’s inflation rate is already approaching the 2% target, so analysts believe that the soft monetary policy is close to ending.
Trading recommendations
Support levels: 129.42, 128.55, 127.29, 126.91, 126.00, 125.57
Resistance levels: 130.99
The medium-term trend on the USD/JPY currency pair is still bullish. The price is forming a wide price corridor, and the MACD indicator has become inactive. With a high probability, the situation will not change before the inflation data. Under such market conditions, it is best to look for buy deals, expecting the continuation of the uptrend. First of all, it is worth considering the support level of 129.42. A resistance level of 130.99 may be considered for sell deals, but only with additional confirmation and short targets.
Alternative scenario: If the price fixes below 128.55, the uptrend will likely be broken.
There is no news feed for today.
The USD/CAD currency pair
Technical indicators of the currency pair:
Prev Open: 1.3012
Prev Close: 1.3028
% chg. over the last day: +0.12%
The Canadian dollar is a commodity currency and is highly dependent not only on the monetary policy of the Bank of Canada but also on the dynamics of the dollar index and oil prices. Oil prices continue to fall as tighter quarantine measures in Shanghai continue to raise demand concerns. This is negatively affecting the Canadian dollar.
Trading recommendations
Support levels: 1.2992, 1.2838, 1.2908, 1.2774, 1.2692, 1.2644, 1.2607, 1.2521
Resistance levels: 1.3044
The USD/CAD currency pair is bullish in terms of technical analysis. The price has reached the daily resistance level. The MACD indicator is in the positive zone, but the divergence of higher time frames is increasing. Trade is worth it only with short targets because, fundamentally, both the dollar index and the Canadian dollar are inclined to grow. Under such market conditions, it is better to look for buy trades on the lower timeframes from the support level of 1.2992, but only with additional confirmation. For sell deals, it is better to consider the resistance level of 1.3044, but it is also better with confirmation and short targets.
Alternative scenario: if the price breaks through and consolidates below 1.2693, the downtrend will likely be resumed.
This article reflects a personal opinion and should not be interpreted as an investment advice, and/or offer, and/or a persistent request for carrying out financial transactions, and/or a guarantee, and/or a forecast of future events.
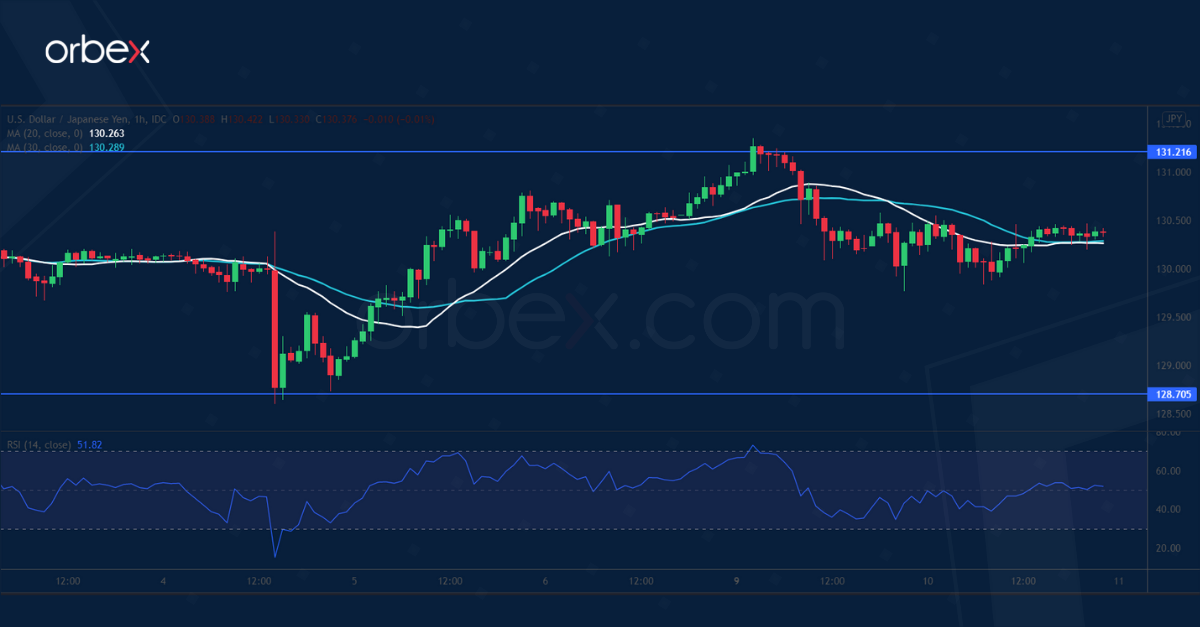
The US dollar retreated as traders took profit ahead of inflation data. The pair has been struggling to hold onto its new high above 131.20. A break below the immediate support at 130.20 reveals the bulls’ caution in chasing after bids. Profit-taking may drive the price action lower and trigger a much-needed consolidation phase. 128.70 at the base of a previous bullish breakout coincides with the 20-day moving average, making it an area of interest. 127.00 on the 30-day moving average is a critical floor for the current uptrend.
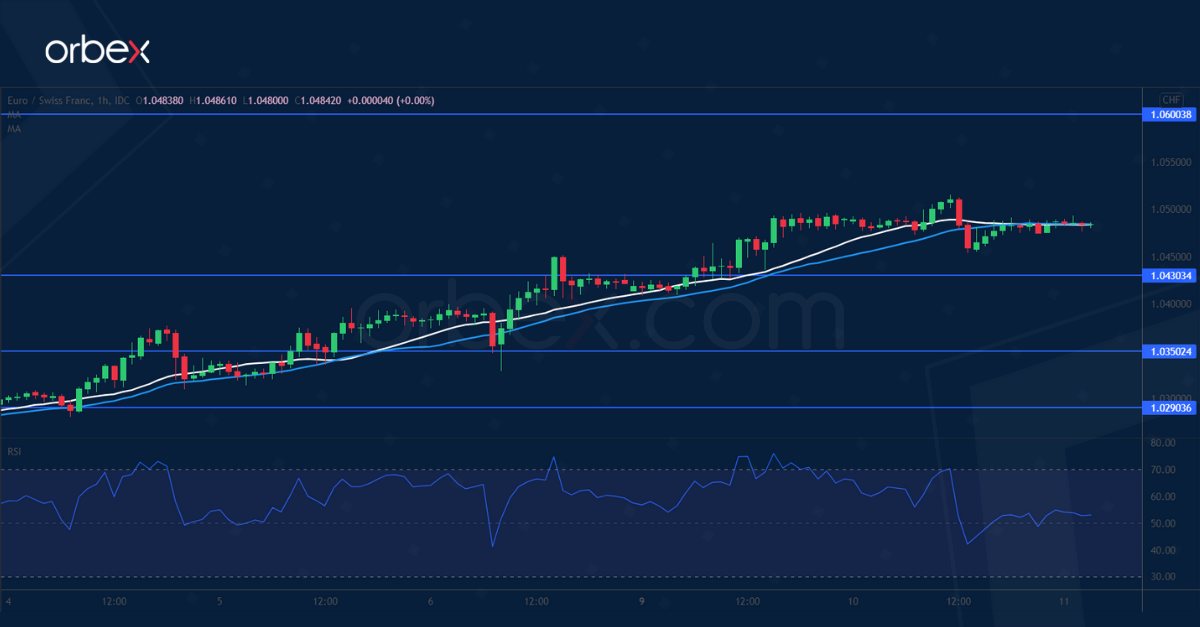
EURCHF to reach 3-month high
The euro strengthens as the German Bundesbank chief calls for rate moves in July. The rally accelerated after it broke above the daily resistance at 1.0450. A combination of short-covering and momentum buying has propelled the euro above the psychological level of 1.0500. This February’s highs near 1.0600 are the next target. As the RSI repeatedly ventures into the overbought area, a pullback could alleviate the pressure from overextension. 1.0430 is a fresh support where trend followers may see an opportunity to jump in.
SPX 500 sees limited bounce
The S&P 500 fell as concerns over an economic slowdown grew. Sentiment is having a hard time to stabilise after the index fell below its 12-month low (4050). The RSI’s oversold condition may briefly help lift offers as intraday traders unwind their positions. However, it would be too soon to call a bottom due to a lack of bids. Most buyers are wary of catching a falling knife and would stay on the sidelines for now. A rebound is likely to meet stiff selling pressure around 4180. 3880 could be the next stop when volatility makes its return.
Orbex is a fully licensed broker that was established in 2011. Founded with a mission to serve its traders responsibly and provides traders with access to the world’s largest and most liquid financial markets. www.orbex.com