by JustForex
The EUR/USD currency pair
- Prev Open: 1.0618
- Prev Close: 1.0539
- % chg. over the last day: -0.75%
An important non-farm payroll report will be published in the US today. This figure is taken into account by the US Federal Reserve for monetary policy regulation. Analysts expect employment to rise by 390,000 (previously 421,000) and the unemployment rate to drop to 3.5%. If the data is worse than expected, the dollar index may fall sharply again, and vice versa. In any case, volatility in currency pairs with the dollar will rise sharply.
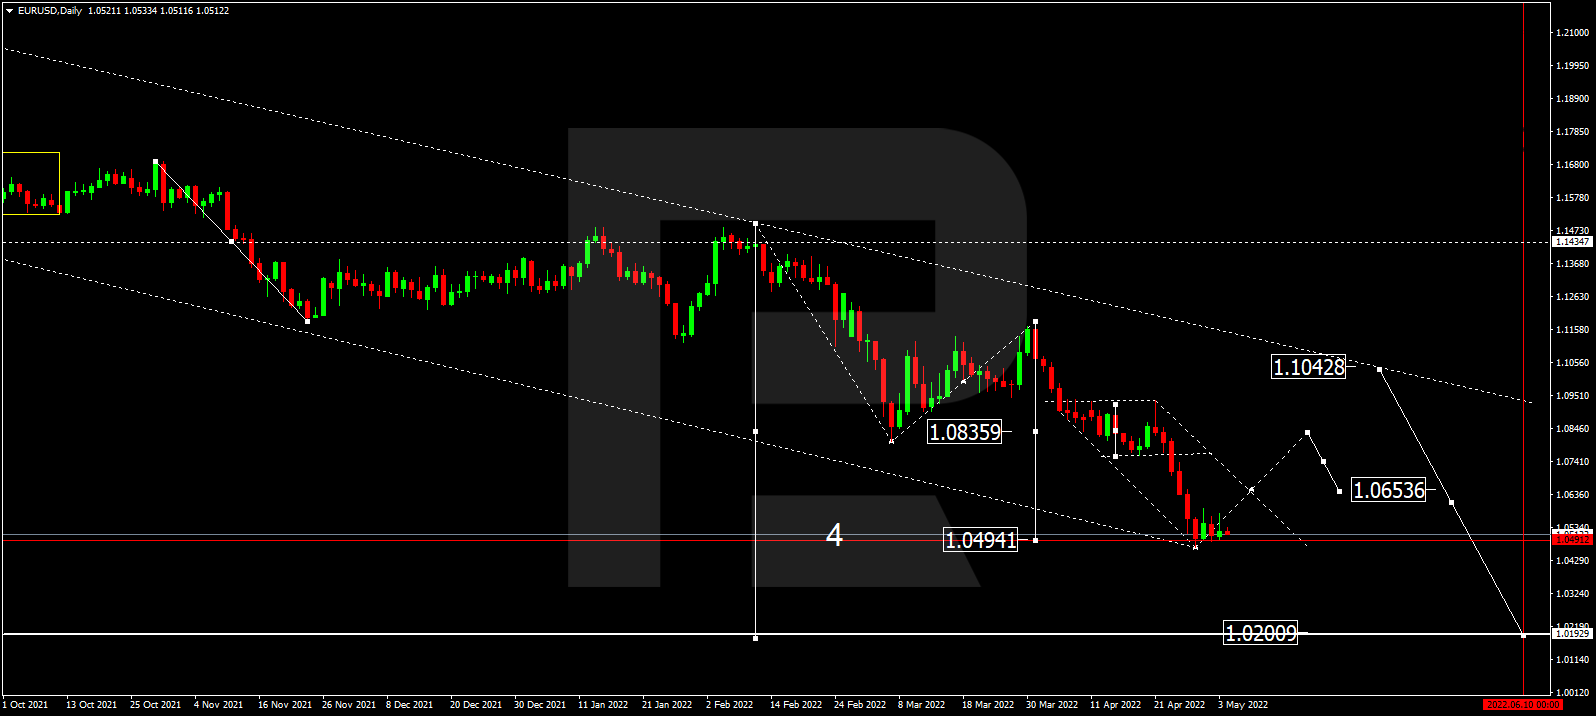
- Support levels: 1.0453
- Resistance levels: 1.0580, 1.0633, 1.0723, 1.0766, 1.0799, 1.0869, 1.0955
From the technical point of view, the trend on the EUR/USD currency pair on the hourly time frame is still bearish. The price has dropped below the moving average again, and the MACD indicator has become negative. Under such market conditions, traders can look for sell deals from the resistance level of 1.0580, but only after the additional confirmation. Buy trades can be considered on intraday timeframes from the support level of 1.0453, but only with short targets and confirmation.
Alternative scenario: if the price breaks out through the 1.0770 resistance level and fixes above, the uptrend will likely resume.

- – German Industrial Production (m/m) at 09:00 (GMT+3);
- – US Nonfarm Payrolls (m/m) at 15:30 (GMT+3);
- – US Unemployment Rate (m/m) at 15:30 (GMT+3);
- – US FOMC Member Williams Speaks at 16:15 (GMT+3).
The GBP/USD currency pair
- Prev Open: 1.2625
- Prev Close: 1.2355
- % chg. over the last day: -2.18%
The Bank of England raised the interest rate by another 0.25% to 1%. The vote showed that six bank representatives voted for a 0.25% rate hike, while three members insisted on 0.5%. The Monetary Policy Report indicates that global inflationary pressures have sharply risen since Russia invaded Ukraine. This has led to a significant deterioration in global and UK growth prospects. According to the May report’s forecast, inflation is expected to continue to rise, averaging just over 9% in the second quarter of 2022 and averaging just over 10% at its peak in the fourth quarter of 2022. The outlook has been extremely negative, reflected in the British pound’s price.
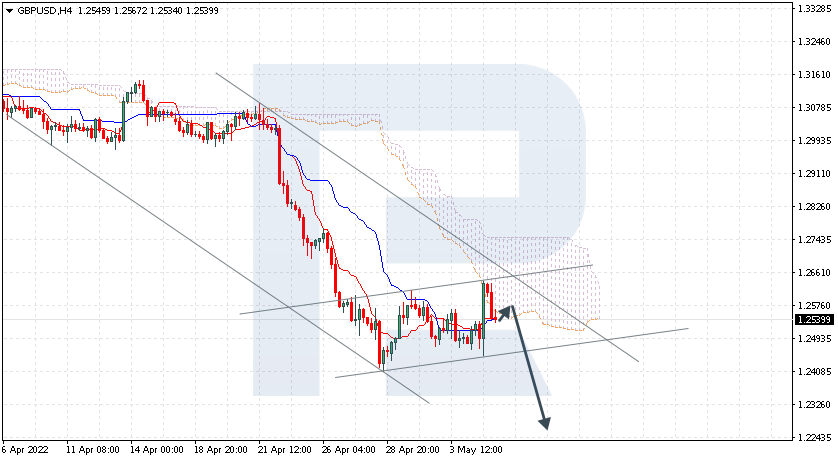
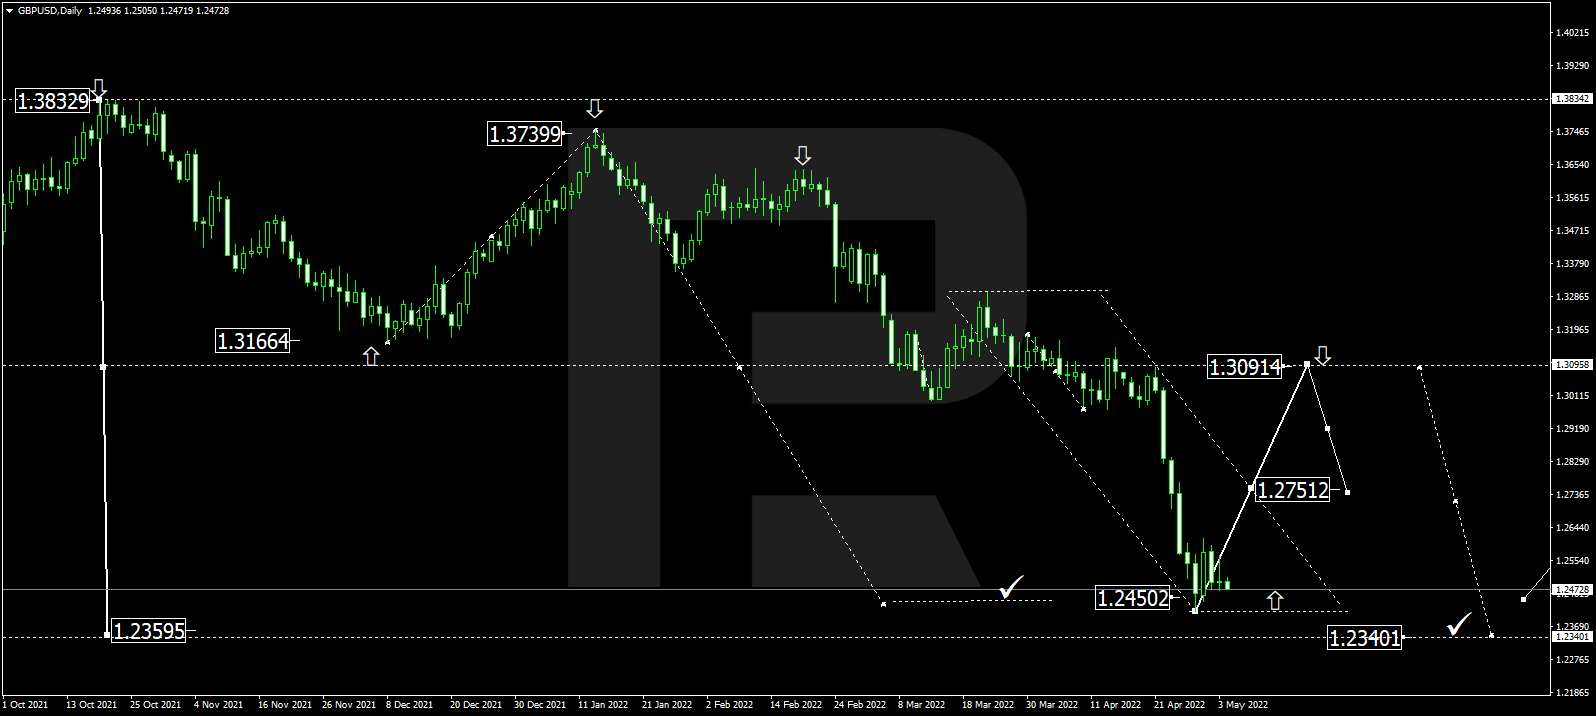
- Support levels: 1.2293, 1.2127
- Resistance levels: 1.2450, 1.2519, 1.2602, 1.2695, 1.2792, 1.2981, 1.3010, 1.3114
On the hourly time frame, the GBP/USD currency pair trend is still bearish. The MACD indicator is negative again, and selling pressure remains high. Under such market conditions, sell trades should be looked for from the resistance level of 1.2450 intraday. For buy deals, traders may consider the level of 1.2293, but only with short targets and after confirmation in the form of buyers’ initiative.
Alternative scenario: if the price breaks down through the 1.2695 resistance level and fixes above, the mid-term uptrend will likely be resumed.

- – UK Construction PMI (m/m) at 11:30 (GMT+3).
The USD/JPY currency pair
- Prev Open: 129.04
- Prev Close: 130.18
- % chg. over the last day: +0.88%
The fundamental picture of the USD/JPY currency pair remains unchanged. The monetary policy of the US and Japan central banks is still at different poles, which will contribute to the growth of USD/JPY quotes in the mid-term perspective. Therefore, any pullback should be used as an opportunity to buy. But inflation in Japan is rising and approaching the 2% target. In Tokyo, consumer price inflation has reached 1.9% year on year. Once the country’s inflation rate reaches 2%, the Bank of Japan will abandon its ultra-soft monetary policy.
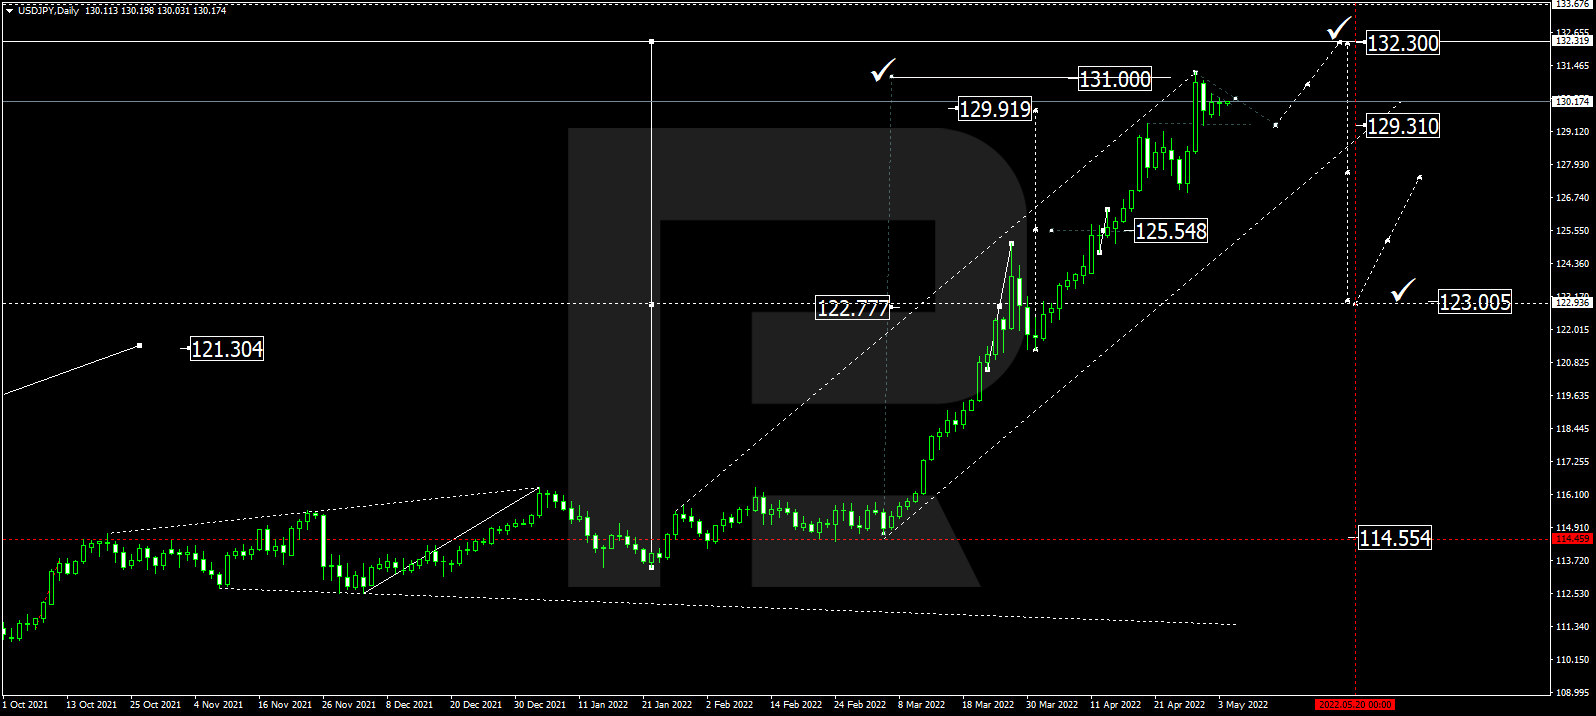
- Support levels: 129.42, 128.55, 127.29, 126.91, 126.00, 125.57
- Resistance levels: 130.80
The medium-term trend on the USD/JPY currency pair is still bullish. The MACD indicator has become positive, and the buying pressure has increased. Under such market conditions, it is best to look for buy deals, expecting the continuation of the uptrend. First of all, it is worth considering the support level of 129.42, but with additional confirmation. A resistance level of 130.80 may be considered for sell deals, but only with short targets.
Alternative scenario: If the price fixes below 128.55, the uptrend will likely be broken.

The USD/CAD currency pair
- Prev Open: 1.2742
- Prev Close: 1.2834
- % chg. over the last day: +0.72%
The Canadian dollar is a commodity currency and depends not only on the monetary policy of the Bank of Canada but also on the dollar index and on the prices of energy commodities such as oil. The dollar index jumped sharply yesterday, while oil prices also rose. On Thursday, a US Senate committee passed a bill that could bring the Organization of Petroleum Exporting Countries (OPEC) and its partners to lawsuits for conspiring to raise crude oil prices. Analysts believe that this situation would temporarily boost oil prices.
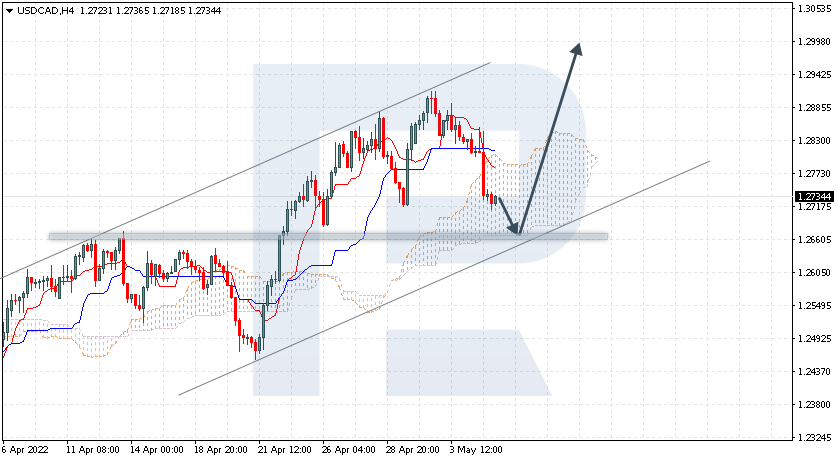
- Support levels: 1.2774, 1.2692, 1.2644, 1.2607, 1.2521
- Resistance levels: 1.2908
The USD/CAD currency pair is bullish in terms of technical analysis. The price is forming a wide price corridor. The MACD indicator is positive again, and the buyer’s pressure has increased. Trade is worth it only with short targets because, fundamentally, both the dollar index and the Canadian dollar are inclined to grow. Under such market conditions, it is better to look for buy trades on the lower timeframes from the support level of 1.2774, but it is better with additional confirmation. For sell deals, it is better to consider the resistance level of 1.2908, but it is also better with confirmation and short targets.
Alternative scenario: if the price breaks through and consolidates below 1.2693, the downtrend will likely be resumed.

- – Canada Unemployment Rate (m/m) at 15:30 (GMT+3);
- – Canada Ivey PMI (m/m) at 17:00 (GMT+3).
by JustForex
This article reflects a personal opinion and should not be interpreted as an investment advice, and/or offer, and/or a persistent request for carrying out financial transactions, and/or a guarantee, and/or a forecast of future events.