By InvestMacro | COT | Data Tables | COT Leaders | Downloads | COT Newsletter
Click for larger image
Here are the latest charts and statistics for the Commitment of Traders (COT) data published by the Commodities Futures Trading Commission (CFTC).
The latest COT data is updated through Tuesday May 17th and shows a quick view of how large traders (for-profit speculators and commercial entities) were positioned in the futures markets. All currency positions are in direct relation to the US dollar where, for example, a bet for the euro is a bet that the euro will rise versus the dollar while a bet against the euro will be a bet that the euro will decline versus the dollar.
Highlighting the COT currency data was the commodity currency speculator positions that have been on the defensive in recent weeks. Canadian dollar positions declined for a fourth straight week this week and have fallen by a total of -35,722 contracts over the past four weeks. This has pushed the overall speculator standing into a bearish position for a second straight week and to the most bearish level since October 2021. Previously, from the middle of January, CAD positions had started to trend higher and mostly maintained a bullish position into April, reaching a 40-week high on April 19th before seeing speculator sentiment weaken (-14,496 contracts this week).
Australian dollar spec positions slipped for a third straight week this week and the overall speculator position has now hit a 7-week low. Aussie positions have maintained a bearish speculator bias since last May (52 consecutive weeks in bearish territory) but had recently seen a reprieve of the weak sentiment. Aussie positions improved strongly from late-February to late-April with a 10-week contract rise of +59,043 positions from February 22nd to April 26th. The speculator positions hit the least bearish level (on April 26th) of the previous 42 weeks before these past 3 weeks has seen speculators re-up their bearish levels.
New Zealand dollar speculators also added to their bearish bets for a fourth straight week and have now pushed the position to the most bearish level since March 17th of 2020, a span of 113 weeks. Kiwi speculator positions had spent almost all of 2021 in bullish levels but spec bets started to falter at the end of the year and into the new year (through early March). Recently, positions had turned positive to bullish positioning in the middle of March and again later in April before turning lower in recent weeks. The NZD speculator sentiment has now been in bearish territory for the past three weeks after dropping by a total of -18,132 contracts from April 26th to this week.
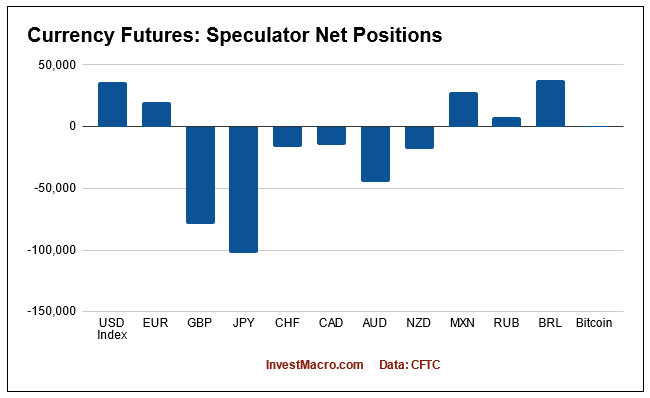
Overall, the currencies with higher speculator bets this week were the US Dollar Index (1,437 contracts), Japanese yen (8,145 contracts), Euro (3,810 contracts), British pound sterling (357 contracts), Bitcoin (103 contracts) and the Mexican peso (11,490 contracts).
The currencies with declining bets were the New Zealand dollar (-4,771 contracts), Canadian dollar (-9,089 contracts), Australian dollar (-2,928 contracts), Brazil real (-2,683 contracts) and the Swiss franc (-829 contracts).
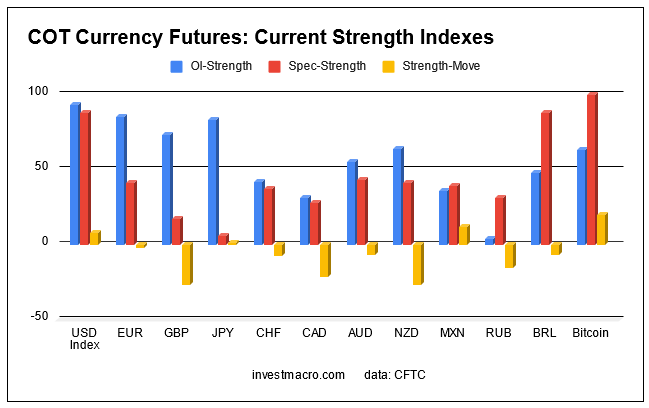
Speculator strength standings for each Commodity where strength index is current net position compared to past three years, above 80 is bullish extreme, below 20 is bearish extreme OI Strength = Current Open Interest level compared to last 3 years range Spec Strength = Current Net Speculator level compared to last 3 years range Strength Move = Six week change of Spec Strength
| May-17-2022 | OI | OI-Index | Spec-Net | Spec-Index | Com-Net | COM-Index | Smalls-Net | Smalls-Index |
|---|
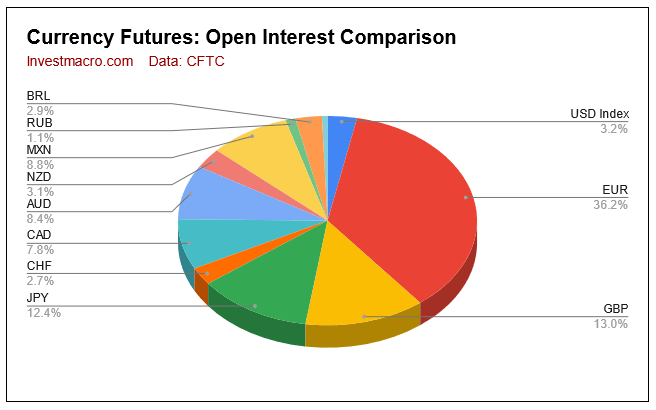
| USD Index | 61,899 | 93 | 36,213 | 88 | -39,506 | 9 | 3,293 | 53 |
| EUR | 706,712 | 85 | 20,339 | 41 | -51,517 | 61 | 31,178 | 26 |
| GBP | 253,811 | 73 | -79,241 | 17 | 94,344 | 85 | -15,103 | 24 |
| JPY | 241,308 | 83 | -102,309 | 6 | 115,062 | 92 | -12,753 | 28 |
| CHF | 53,291 | 42 | -16,592 | 37 | 31,181 | 72 | -14,589 | 14 |
| CAD | 151,585 | 31 | -14,496 | 28 | 12,591 | 75 | 1,905 | 34 |
| AUD | 163,809 | 55 | -44,642 | 43 | 54,437 | 59 | -9,795 | 29 |
| NZD | 60,804 | 64 | -17,767 | 41 | 21,390 | 63 | -3,623 | 10 |
| MXN | 170,924 | 36 | 28,215 | 39 | -32,249 | 59 | 4,034 | 60 |
| RUB | 20,930 | 4 | 7,543 | 31 | -7,150 | 69 | -393 | 24 |
| BRL | 55,990 | 48 | 38,095 | 88 | -39,436 | 13 | 1,341 | 80 |
| Bitcoin | 11,644 | 63 | 806 | 100 | -875 | 0 | 69 | 15 |
US Dollar Index Futures:
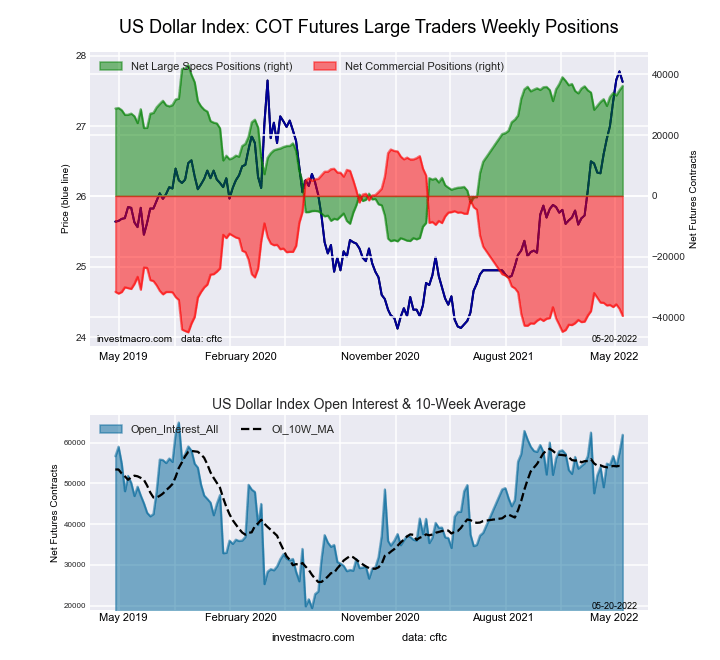 The US Dollar Index large speculator standing this week resulted in a net position of 36,213 contracts in the data reported through Tuesday. This was a weekly rise of 1,437 contracts from the previous week which had a total of 34,776 net contracts.
This week’s current strength score (the trader positioning range over the past three years, measured from 0 to 100) shows the speculators are currently Bullish-Extreme with a score of 88.2 percent. The commercials are Bearish-Extreme with a score of 9.0 percent and the small traders (not shown in chart) are Bullish with a score of 52.5 percent.
| US DOLLAR INDEX Statistics | SPECULATORS | COMMERCIALS | SMALL TRADERS |
| – Percent of Open Interest Longs: | 86.5 | 3.4 | 8.8 |
| – Percent of Open Interest Shorts: | 28.0 | 67.2 | 3.5 |
| – Net Position: | 36,213 | -39,506 | 3,293 |
| – Gross Longs: | 53,519 | 2,105 | 5,449 |
| – Gross Shorts: | 17,306 | 41,611 | 2,156 |
| – Long to Short Ratio: | 3.1 to 1 | 0.1 to 1 | 2.5 to 1 |
| NET POSITION TREND: | | | |
| – Strength Index Score (3 Year Range Pct): | 88.2 | 9.0 | 52.5 |
| – Strength Index Reading (3 Year Range): | Bullish-Extreme | Bearish-Extreme | Bullish |
| NET POSITION MOVEMENT INDEX: | | | |
| – 6-Week Change in Strength Index: | 7.5 | -7.2 | -0.5 |
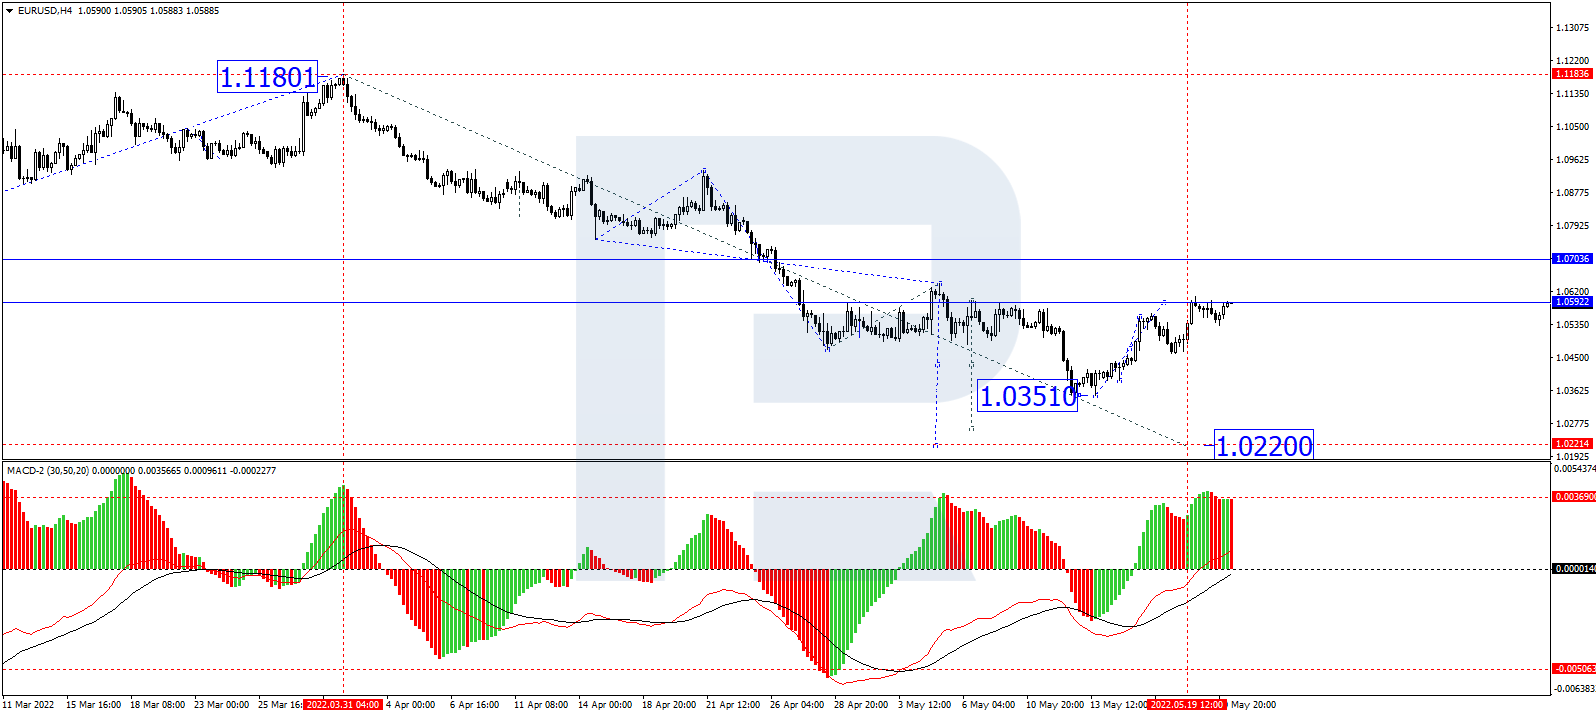
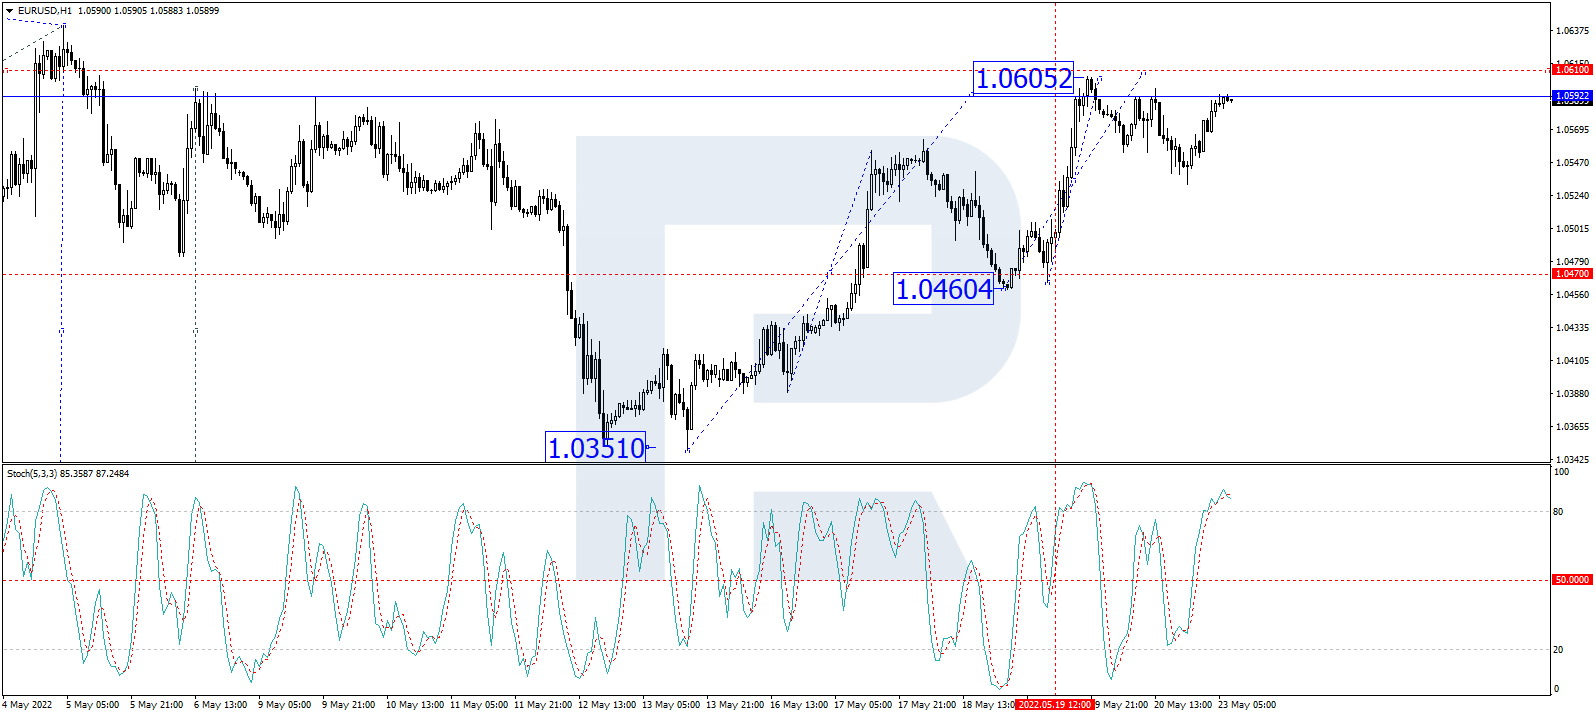
Euro Currency Futures:
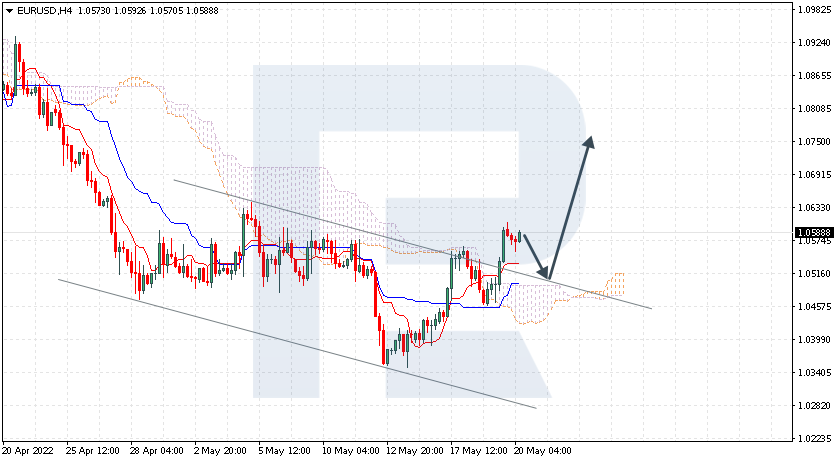
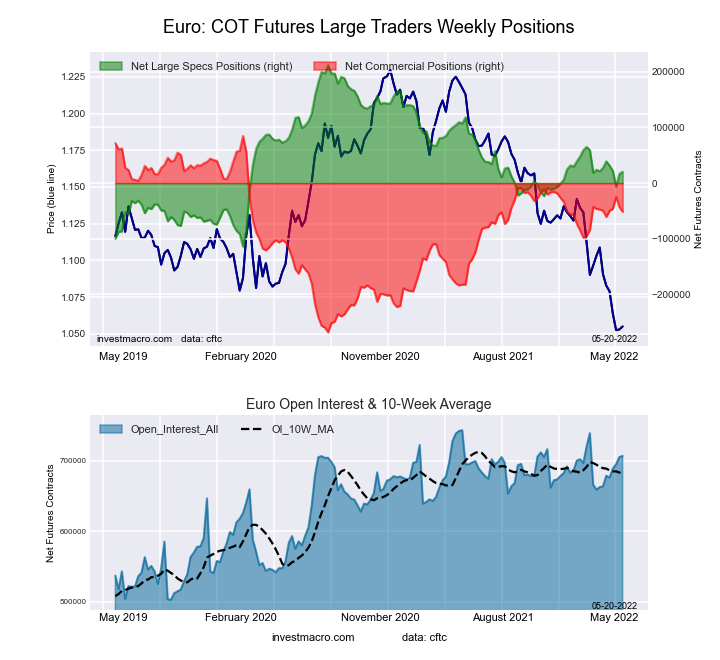 The Euro Currency large speculator standing this week resulted in a net position of 20,339 contracts in the data reported through Tuesday. This was a weekly boost of 3,810 contracts from the previous week which had a total of 16,529 net contracts.
This week’s current strength score (the trader positioning range over the past three years, measured from 0 to 100) shows the speculators are currently Bearish with a score of 41.2 percent. The commercials are Bullish with a score of 61.4 percent and the small traders (not shown in chart) are Bearish with a score of 26.0 percent.
| EURO Currency Statistics | SPECULATORS | COMMERCIALS | SMALL TRADERS |
| – Percent of Open Interest Longs: | 32.7 | 52.7 | 12.1 |
| – Percent of Open Interest Shorts: | 29.8 | 59.9 | 7.7 |
| – Net Position: | 20,339 | -51,517 | 31,178 |
| – Gross Longs: | 230,770 | 372,113 | 85,455 |
| – Gross Shorts: | 210,431 | 423,630 | 54,277 |
| – Long to Short Ratio: | 1.1 to 1 | 0.9 to 1 | 1.6 to 1 |
| NET POSITION TREND: | | | |
| – Strength Index Score (3 Year Range Pct): | 41.2 | 61.4 | 26.0 |
| – Strength Index Reading (3 Year Range): | Bearish | Bullish | Bearish |
| NET POSITION MOVEMENT INDEX: | | | |
| – 6-Week Change in Strength Index: | -2.2 | -0.5 | 14.8 |
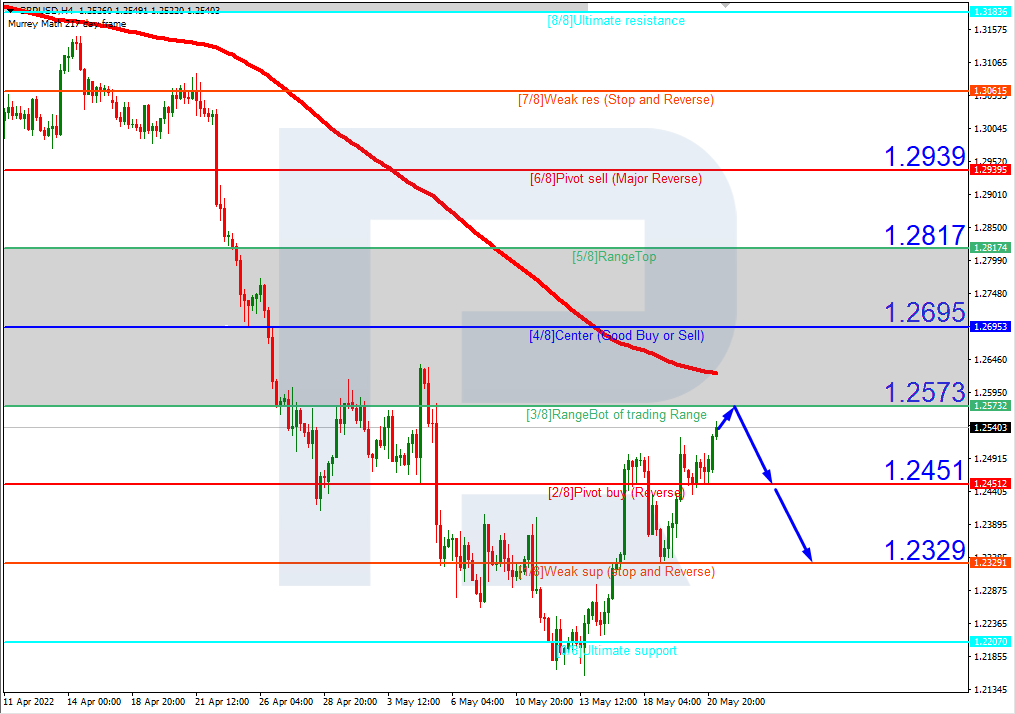
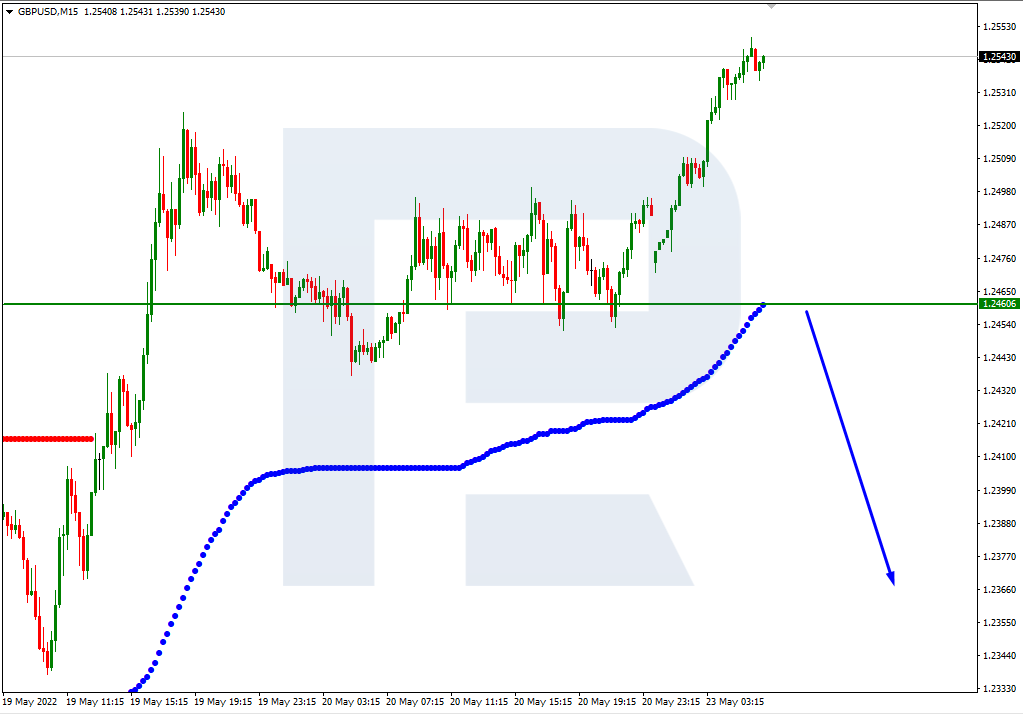
British Pound Sterling Futures:
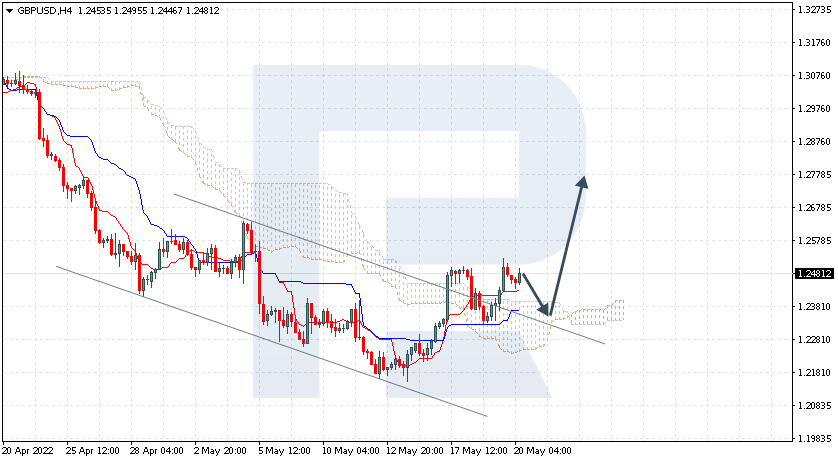
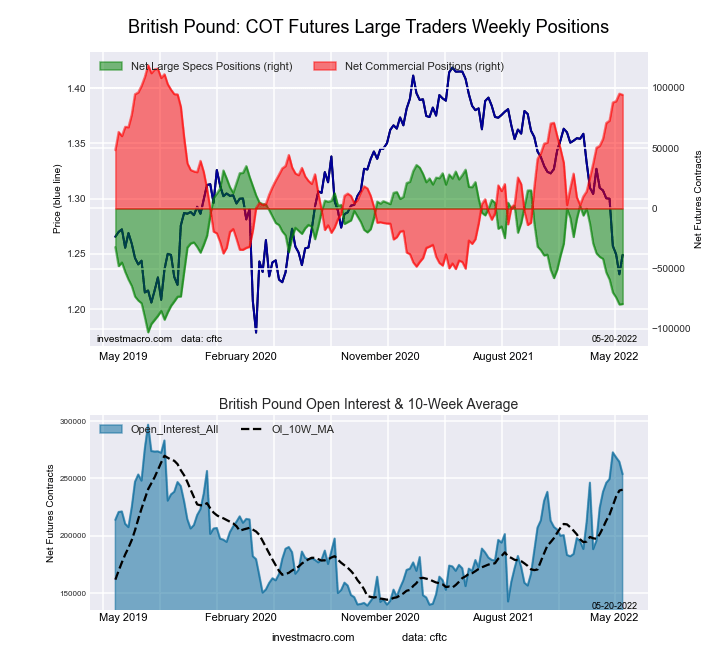 The British Pound Sterling large speculator standing this week resulted in a net position of -79,241 contracts in the data reported through Tuesday. This was a weekly advance of 357 contracts from the previous week which had a total of -79,598 net contracts.
This week’s current strength score (the trader positioning range over the past three years, measured from 0 to 100) shows the speculators are currently Bearish-Extreme with a score of 16.9 percent. The commercials are Bullish-Extreme with a score of 85.5 percent and the small traders (not shown in chart) are Bearish with a score of 24.3 percent.
| BRITISH POUND Statistics | SPECULATORS | COMMERCIALS | SMALL TRADERS |
| – Percent of Open Interest Longs: | 10.5 | 79.4 | 8.2 |
| – Percent of Open Interest Shorts: | 41.7 | 42.3 | 14.1 |
| – Net Position: | -79,241 | 94,344 | -15,103 |
| – Gross Longs: | 26,613 | 201,647 | 20,811 |
| – Gross Shorts: | 105,854 | 107,303 | 35,914 |
| – Long to Short Ratio: | 0.3 to 1 | 1.9 to 1 | 0.6 to 1 |
| NET POSITION TREND: | | | |
| – Strength Index Score (3 Year Range Pct): | 16.9 | 85.5 | 24.3 |
| – Strength Index Reading (3 Year Range): | Bearish-Extreme | Bullish-Extreme | Bearish |
| NET POSITION MOVEMENT INDEX: | | | |
| – 6-Week Change in Strength Index: | -27.0 | 21.6 | 1.9 |
Japanese Yen Futures:
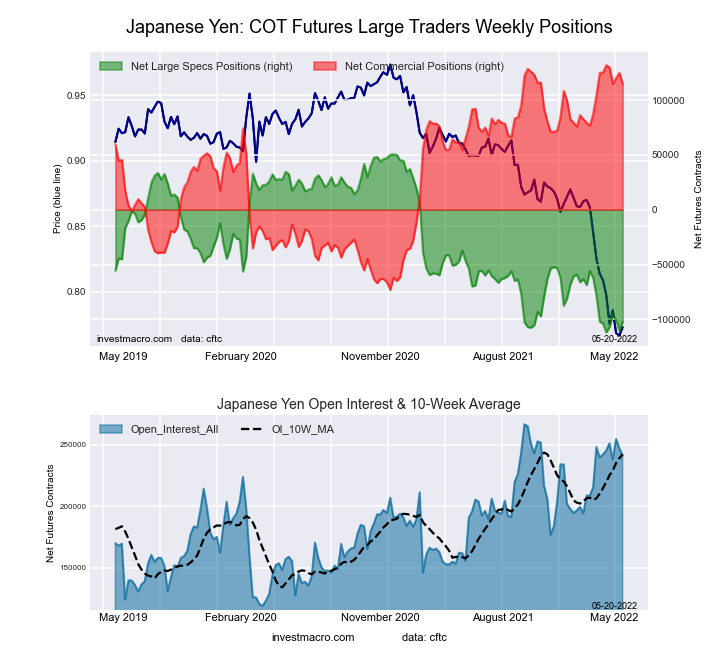 The Japanese Yen large speculator standing this week resulted in a net position of -102,309 contracts in the data reported through Tuesday. This was a weekly advance of 8,145 contracts from the previous week which had a total of -110,454 net contracts.
This week’s current strength score (the trader positioning range over the past three years, measured from 0 to 100) shows the speculators are currently Bearish-Extreme with a score of 5.9 percent. The commercials are Bullish-Extreme with a score of 91.8 percent and the small traders (not shown in chart) are Bearish with a score of 27.5 percent.
| JAPANESE YEN Statistics | SPECULATORS | COMMERCIALS | SMALL TRADERS |
| – Percent of Open Interest Longs: | 5.0 | 84.7 | 8.7 |
| – Percent of Open Interest Shorts: | 47.4 | 37.0 | 14.0 |
| – Net Position: | -102,309 | 115,062 | -12,753 |
| – Gross Longs: | 12,113 | 204,417 | 20,933 |
| – Gross Shorts: | 114,422 | 89,355 | 33,686 |
| – Long to Short Ratio: | 0.1 to 1 | 2.3 to 1 | 0.6 to 1 |
| NET POSITION TREND: | | | |
| – Strength Index Score (3 Year Range Pct): | 5.9 | 91.8 | 27.5 |
| – Strength Index Reading (3 Year Range): | Bearish-Extreme | Bullish-Extreme | Bearish |
| NET POSITION MOVEMENT INDEX: | | | |
| – 6-Week Change in Strength Index: | 0.9 | -5.0 | 17.6 |
Swiss Franc Futures:
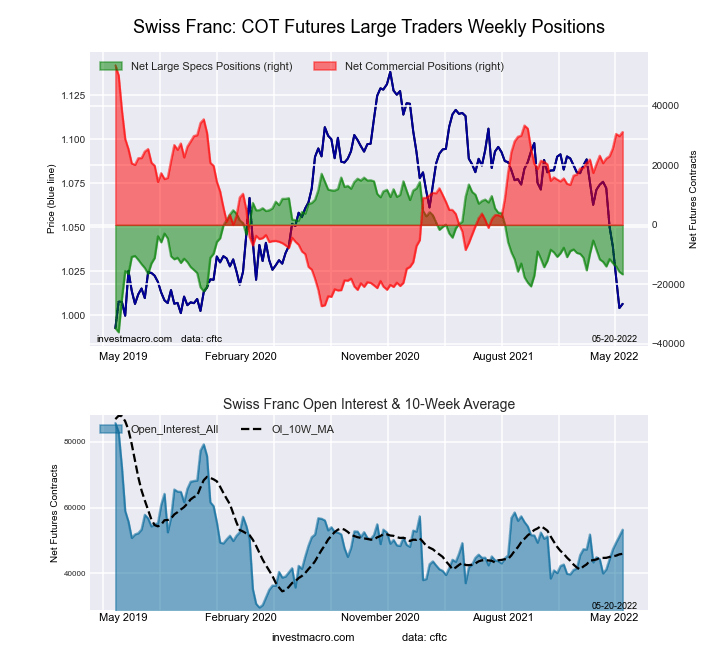 The Swiss Franc large speculator standing this week resulted in a net position of -16,592 contracts in the data reported through Tuesday. This was a weekly reduction of -829 contracts from the previous week which had a total of -15,763 net contracts.
This week’s current strength score (the trader positioning range over the past three years, measured from 0 to 100) shows the speculators are currently Bearish with a score of 36.6 percent. The commercials are Bullish with a score of 72.3 percent and the small traders (not shown in chart) are Bearish-Extreme with a score of 13.8 percent.
| SWISS FRANC Statistics | SPECULATORS | COMMERCIALS | SMALL TRADERS |
| – Percent of Open Interest Longs: | 9.8 | 74.5 | 15.2 |
| – Percent of Open Interest Shorts: | 41.0 | 16.0 | 42.6 |
| – Net Position: | -16,592 | 31,181 | -14,589 |
| – Gross Longs: | 5,240 | 39,722 | 8,094 |
| – Gross Shorts: | 21,832 | 8,541 | 22,683 |
| – Long to Short Ratio: | 0.2 to 1 | 4.7 to 1 | 0.4 to 1 |
| NET POSITION TREND: | | | |
| – Strength Index Score (3 Year Range Pct): | 36.6 | 72.3 | 13.8 |
| – Strength Index Reading (3 Year Range): | Bearish | Bullish | Bearish-Extreme |
| NET POSITION MOVEMENT INDEX: | | | |
| – 6-Week Change in Strength Index: | -7.9 | 12.9 | -19.8 |
Canadian Dollar Futures:
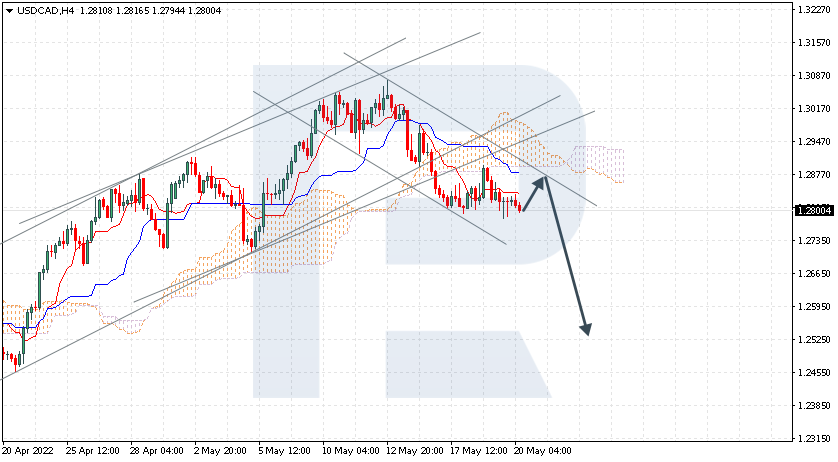
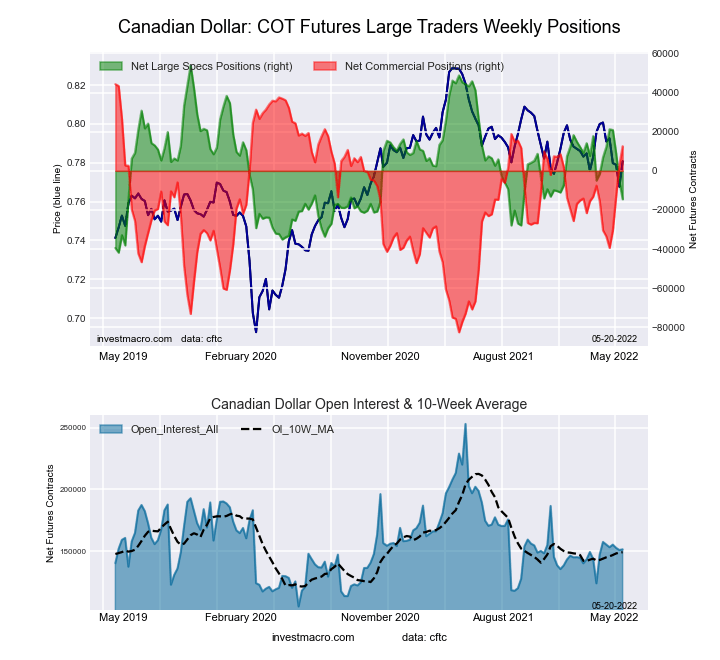 The Canadian Dollar large speculator standing this week resulted in a net position of -14,496 contracts in the data reported through Tuesday. This was a weekly reduction of -9,089 contracts from the previous week which had a total of -5,407 net contracts.
This week’s current strength score (the trader positioning range over the past three years, measured from 0 to 100) shows the speculators are currently Bearish with a score of 28.5 percent. The commercials are Bullish with a score of 75.0 percent and the small traders (not shown in chart) are Bearish with a score of 33.6 percent.
| CANADIAN DOLLAR Statistics | SPECULATORS | COMMERCIALS | SMALL TRADERS |
| – Percent of Open Interest Longs: | 23.8 | 52.7 | 20.6 |
| – Percent of Open Interest Shorts: | 33.4 | 44.4 | 19.3 |
| – Net Position: | -14,496 | 12,591 | 1,905 |
| – Gross Longs: | 36,069 | 79,825 | 31,228 |
| – Gross Shorts: | 50,565 | 67,234 | 29,323 |
| – Long to Short Ratio: | 0.7 to 1 | 1.2 to 1 | 1.1 to 1 |
| NET POSITION TREND: | | | |
| – Strength Index Score (3 Year Range Pct): | 28.5 | 75.0 | 33.6 |
| – Strength Index Reading (3 Year Range): | Bearish | Bullish | Bearish |
| NET POSITION MOVEMENT INDEX: | | | |
| – 6-Week Change in Strength Index: | -22.4 | 33.9 | -43.0 |
Australian Dollar Futures:
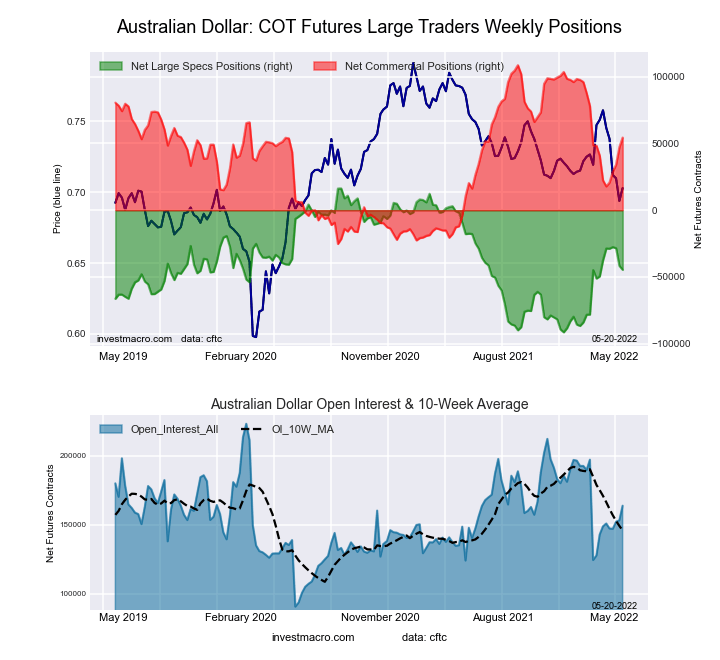 The Australian Dollar large speculator standing this week resulted in a net position of -44,642 contracts in the data reported through Tuesday. This was a weekly decrease of -2,928 contracts from the previous week which had a total of -41,714 net contracts.
This week’s current strength score (the trader positioning range over the past three years, measured from 0 to 100) shows the speculators are currently Bearish with a score of 43.4 percent. The commercials are Bullish with a score of 59.5 percent and the small traders (not shown in chart) are Bearish with a score of 28.5 percent.
| AUSTRALIAN DOLLAR Statistics | SPECULATORS | COMMERCIALS | SMALL TRADERS |
| – Percent of Open Interest Longs: | 25.3 | 60.4 | 11.7 |
| – Percent of Open Interest Shorts: | 52.6 | 27.1 | 17.7 |
| – Net Position: | -44,642 | 54,437 | -9,795 |
| – Gross Longs: | 41,473 | 98,903 | 19,187 |
| – Gross Shorts: | 86,115 | 44,466 | 28,982 |
| – Long to Short Ratio: | 0.5 to 1 | 2.2 to 1 | 0.7 to 1 |
| NET POSITION TREND: | | | |
| – Strength Index Score (3 Year Range Pct): | 43.4 | 59.5 | 28.5 |
| – Strength Index Reading (3 Year Range): | Bearish | Bullish | Bearish |
| NET POSITION MOVEMENT INDEX: | | | |
| – 6-Week Change in Strength Index: | -6.6 | 24.0 | -60.9 |
New Zealand Dollar Futures:
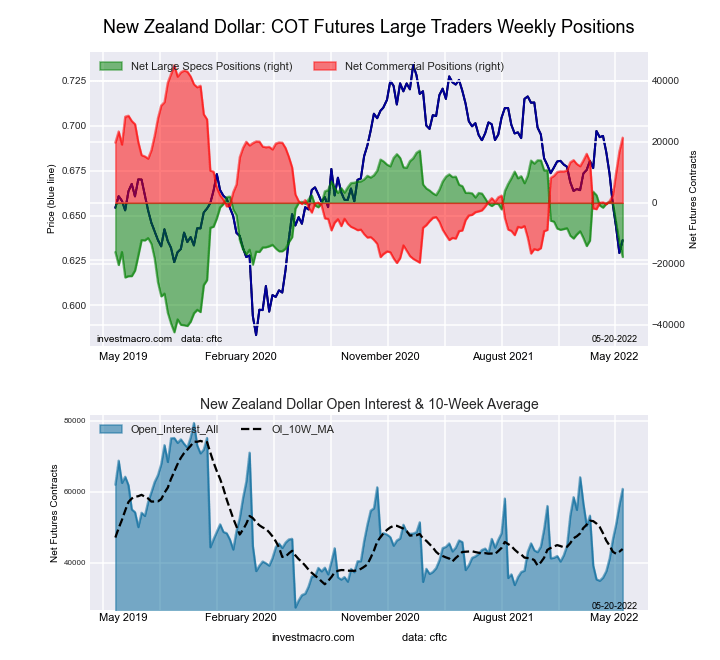 The New Zealand Dollar large speculator standing this week resulted in a net position of -17,767 contracts in the data reported through Tuesday. This was a weekly decrease of -4,771 contracts from the previous week which had a total of -12,996 net contracts.
This week’s current strength score (the trader positioning range over the past three years, measured from 0 to 100) shows the speculators are currently Bearish with a score of 41.5 percent. The commercials are Bullish with a score of 63.4 percent and the small traders (not shown in chart) are Bearish-Extreme with a score of 10.4 percent.
| NEW ZEALAND DOLLAR Statistics | SPECULATORS | COMMERCIALS | SMALL TRADERS |
| – Percent of Open Interest Longs: | 24.7 | 71.1 | 3.9 |
| – Percent of Open Interest Shorts: | 53.9 | 35.9 | 9.8 |
| – Net Position: | -17,767 | 21,390 | -3,623 |
| – Gross Longs: | 14,998 | 43,219 | 2,358 |
| – Gross Shorts: | 32,765 | 21,829 | 5,981 |
| – Long to Short Ratio: | 0.5 to 1 | 2.0 to 1 | 0.4 to 1 |
| NET POSITION TREND: | | | |
| – Strength Index Score (3 Year Range Pct): | 41.5 | 63.4 | 10.4 |
| – Strength Index Reading (3 Year Range): | Bearish | Bullish | Bearish-Extreme |
| NET POSITION MOVEMENT INDEX: | | | |
| – 6-Week Change in Strength Index: | -27.2 | 32.7 | -57.5 |
Mexican Peso Futures:
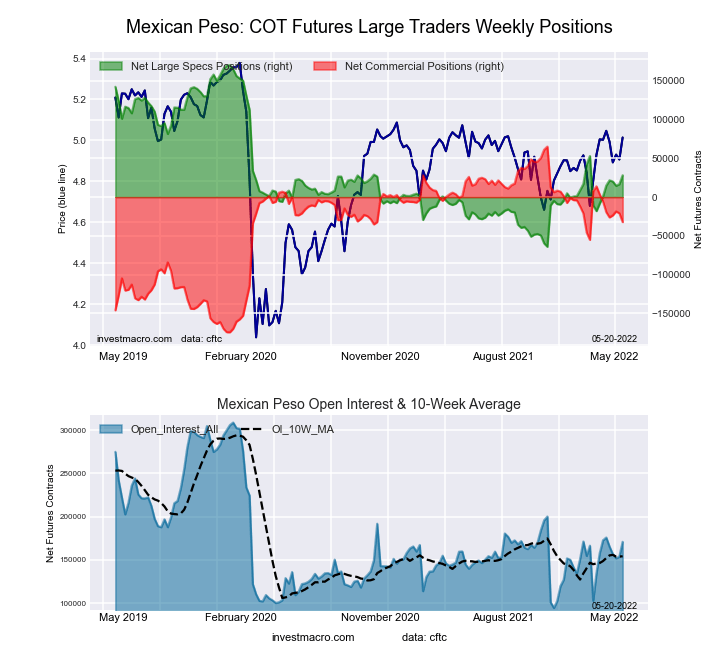 The Mexican Peso large speculator standing this week resulted in a net position of 28,215 contracts in the data reported through Tuesday. This was a weekly gain of 11,490 contracts from the previous week which had a total of 16,725 net contracts.
This week’s current strength score (the trader positioning range over the past three years, measured from 0 to 100) shows the speculators are currently Bearish with a score of 39.4 percent. The commercials are Bullish with a score of 59.4 percent and the small traders (not shown in chart) are Bullish with a score of 60.1 percent.
| MEXICAN PESO Statistics | SPECULATORS | COMMERCIALS | SMALL TRADERS |
| – Percent of Open Interest Longs: | 45.5 | 49.1 | 4.1 |
| – Percent of Open Interest Shorts: | 29.0 | 67.9 | 1.7 |
| – Net Position: | 28,215 | -32,249 | 4,034 |
| – Gross Longs: | 77,819 | 83,844 | 7,000 |
| – Gross Shorts: | 49,604 | 116,093 | 2,966 |
| – Long to Short Ratio: | 1.6 to 1 | 0.7 to 1 | 2.4 to 1 |
| NET POSITION TREND: | | | |
| – Strength Index Score (3 Year Range Pct): | 39.4 | 59.4 | 60.1 |
| – Strength Index Reading (3 Year Range): | Bearish | Bullish | Bullish |
| NET POSITION MOVEMENT INDEX: | | | |
| – 6-Week Change in Strength Index: | 11.6 | -11.0 | -3.5 |
Brazilian Real Futures:
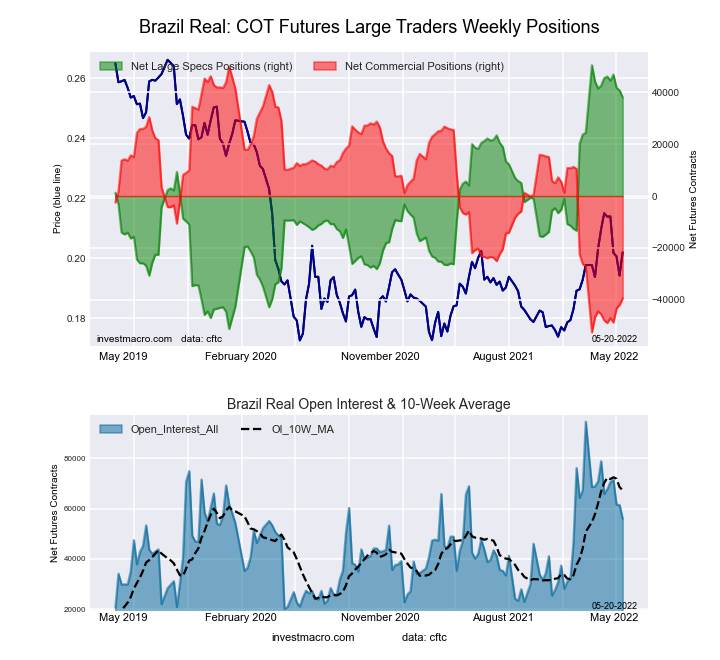 The Brazilian Real large speculator standing this week resulted in a net position of 38,095 contracts in the data reported through Tuesday. This was a weekly decline of -2,683 contracts from the previous week which had a total of 40,778 net contracts.
This week’s current strength score (the trader positioning range over the past three years, measured from 0 to 100) shows the speculators are currently Bullish-Extreme with a score of 87.8 percent. The commercials are Bearish-Extreme with a score of 12.8 percent and the small traders (not shown in chart) are Bullish-Extreme with a score of 80.5 percent.
| BRAZIL REAL Statistics | SPECULATORS | COMMERCIALS | SMALL TRADERS |
| – Percent of Open Interest Longs: | 76.8 | 16.9 | 6.1 |
| – Percent of Open Interest Shorts: | 8.7 | 87.3 | 3.7 |
| – Net Position: | 38,095 | -39,436 | 1,341 |
| – Gross Longs: | 42,989 | 9,470 | 3,438 |
| – Gross Shorts: | 4,894 | 48,906 | 2,097 |
| – Long to Short Ratio: | 8.8 to 1 | 0.2 to 1 | 1.6 to 1 |
| NET POSITION TREND: | | | |
| – Strength Index Score (3 Year Range Pct): | 87.8 | 12.8 | 80.5 |
| – Strength Index Reading (3 Year Range): | Bullish-Extreme | Bearish-Extreme | Bullish-Extreme |
| NET POSITION MOVEMENT INDEX: | | | |
| – 6-Week Change in Strength Index: | -7.3 | 8.3 | -12.8 |
Bitcoin Futures:
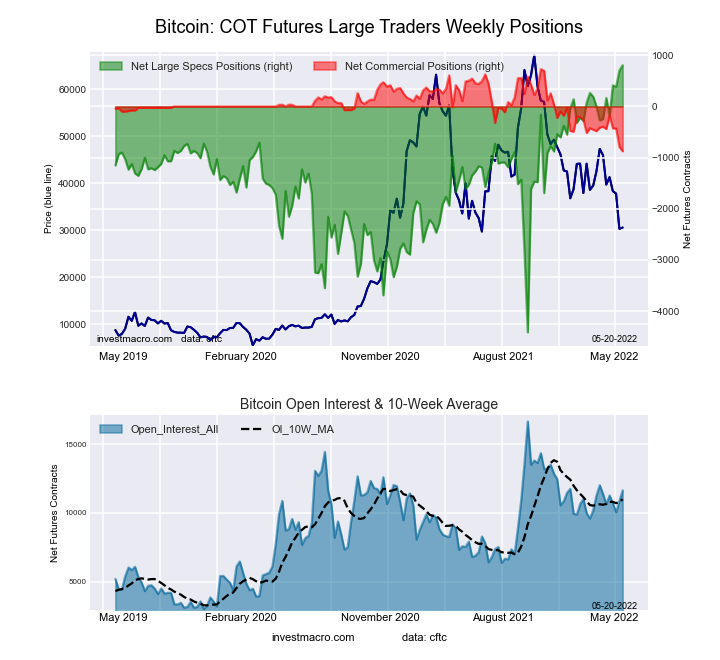 The Bitcoin large speculator standing this week resulted in a net position of 806 contracts in the data reported through Tuesday. This was a weekly gain of 103 contracts from the previous week which had a total of 703 net contracts.
This week’s current strength score (the trader positioning range over the past three years, measured from 0 to 100) shows the speculators are currently Bullish-Extreme with a score of 100.0 percent. The commercials are Bearish-Extreme with a score of 0.0 percent and the small traders (not shown in chart) are Bearish-Extreme with a score of 14.5 percent.
| BITCOIN Statistics | SPECULATORS | COMMERCIALS | SMALL TRADERS |
| – Percent of Open Interest Longs: | 82.1 | 1.7 | 9.3 |
| – Percent of Open Interest Shorts: | 75.2 | 9.2 | 8.7 |
| – Net Position: | 806 | -875 | 69 |
| – Gross Longs: | 9,564 | 194 | 1,081 |
| – Gross Shorts: | 8,758 | 1,069 | 1,012 |
| – Long to Short Ratio: | 1.1 to 1 | 0.2 to 1 | 1.1 to 1 |
| NET POSITION TREND: | | | |
| – Strength Index Score (3 Year Range Pct): | 100.0 | 0.0 | 14.5 |
| – Strength Index Reading (3 Year Range): | Bullish-Extreme | Bearish-Extreme | Bearish-Extreme |
| NET POSITION MOVEMENT INDEX: | | | |
| – 6-Week Change in Strength Index: | 20.1 | -29.8 | -13.0 |
Article By InvestMacro – Receive our weekly COT Reports by Email
*COT Report: The COT data, released weekly to the public each Friday, is updated through the most recent Tuesday (data is 3 days old) and shows a quick view of how large speculators or non-commercials (for-profit traders) were positioned in the futures markets.
The CFTC categorizes trader positions according to commercial hedgers (traders who use futures contracts for hedging as part of the business), non-commercials (large traders who speculate to realize trading profits) and nonreportable traders (usually small traders/speculators) as well as their open interest (contracts open in the market at time of reporting).See CFTC criteria here.


