by JustForex
The EUR/USD currency pair
- Prev Open: 1.0683
- Prev Close: 1.0729
- % chg. over the last day: +0.43%
US GDP declines amid a strengthening labor market point to pre-recession signs. On the other hand, the decline in GDP is due to the fact that the US spends more on imports than other countries on exports from the United States. This led to a trade deficit, which contributed to the GDP contraction.
- Support levels: 1.0689, 1.0643, 1.0680, 1.0611, 1.0568, 1.0509, 1.0445, 1.0379
- Resistance levels: 1.0759, 1.0799, 1.0869
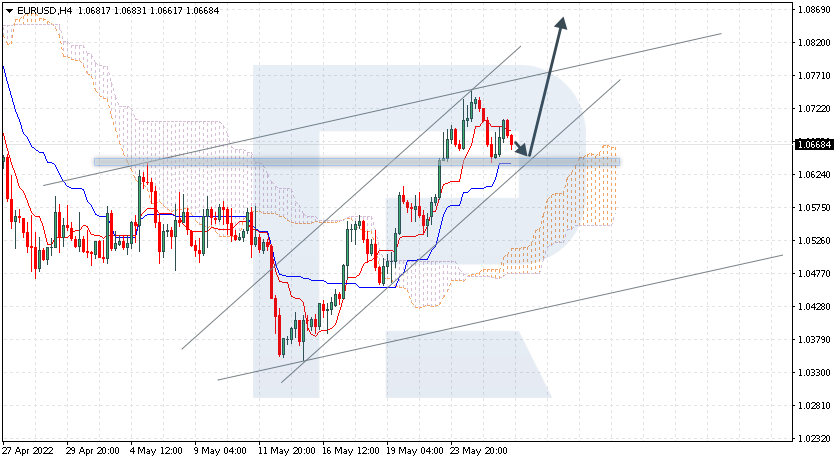
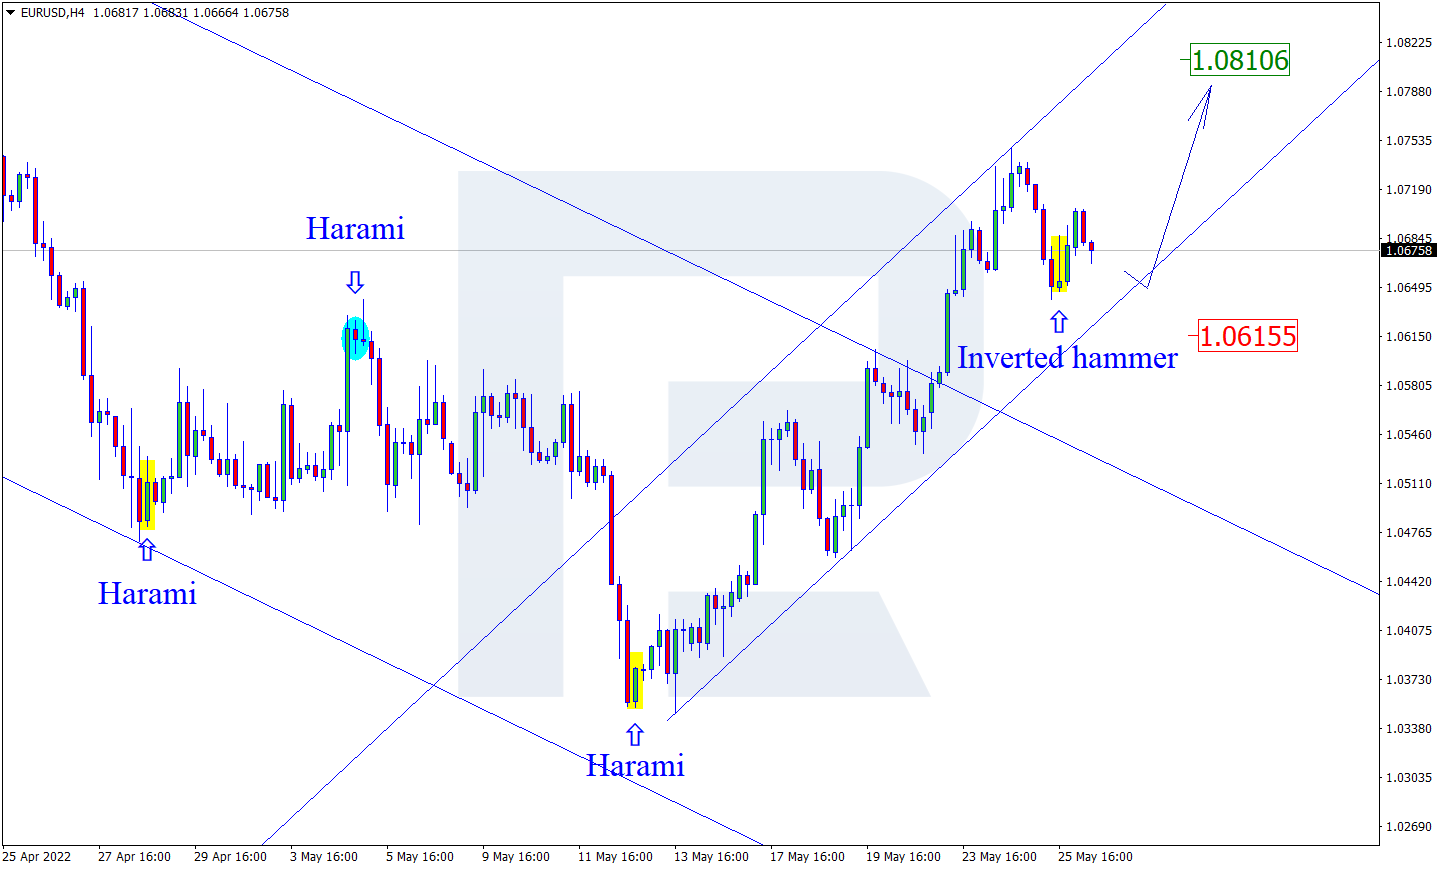
From a technical point of view, the trend on the EUR/USD currency pair on the hourly time frame is bullish. The MACD indicator is positive again, but the divergence has increased, indicating that it is becoming harder for the price to move up. Under such market conditions, investors can look for buy trades on intraday time frames from the support level of 1.0689, but only with confirmation. Sell trades can be considered from the resistance level of 1.0759 but only after the additional confirmation.
Alternative scenario: if the price breaks out through the 1.0611 support level and fixes below, the downtrend will likely resume.

- – US FOMC Member Bullard Speaks at 14:35 (GMT+3);
- – US PCE Price index (m/m) at 15:30 (GMT+3);
- – US Michigan Consumer Sentiment (m/m) at 17:00 (GMT+3).
The GBP/USD currency pair
- Prev Open: 1.2564
- Prev Close: 1.2608
- % chg. over the last day: +0.35%
Yield spreads on the UK, and US government bonds are falling, which positively affects the strength of the British currency. On the other hand, inflation in the UK is now higher than in the US, and the Bank of England should actively raise rates but is afraid of driving the economy into recession. For now, analysts see a 0.25% interest rate hike at the next Bank of England meeting. The UK plans to impose a temporary tax on energy profits to offset losses from inflation.
- Support levels: 1.2612, 1.2525, 1.2437, 1.2398, 1.2283, 1.2199
- Resistance levels: 1.2669, 1.2792, 1.2981
On the hourly time frame, the GBP/USD currency pair trend is bullish. The MACD indicator is positive, but the divergence is getting stronger, which indicates the weakness of the buyers. Under such market conditions, buy deals may be considered from the support level of 1.2525, but only with additional confirmation. Sell deals should be looked for from the resistance level of 1.2669, but with confirmation in the form of sellers’ initiative.
Alternative scenario: if the price breaks down through the 1.2437 support level and fixes below, the mid-term downtrend will likely resume.

The USD/JPY currency pair
- Prev Open: 127.26
- Prev Close: 127.07
- % chg. over the last day: -0.15%
Bank of Japan Governor Kuroda said again that the Central Bank should continue to ease monetary policy. When asked how the Bank of Japan would normalize it, the answer was : “When exiting easy policy, the BoJ will likely combine rate hike with balance sheet reduction through specific means, the timing will depend on economic, price and financial developments at the time.” Core consumer prices in Tokyo remained at 1.9%, the same as last month, according to the last data released on Friday.
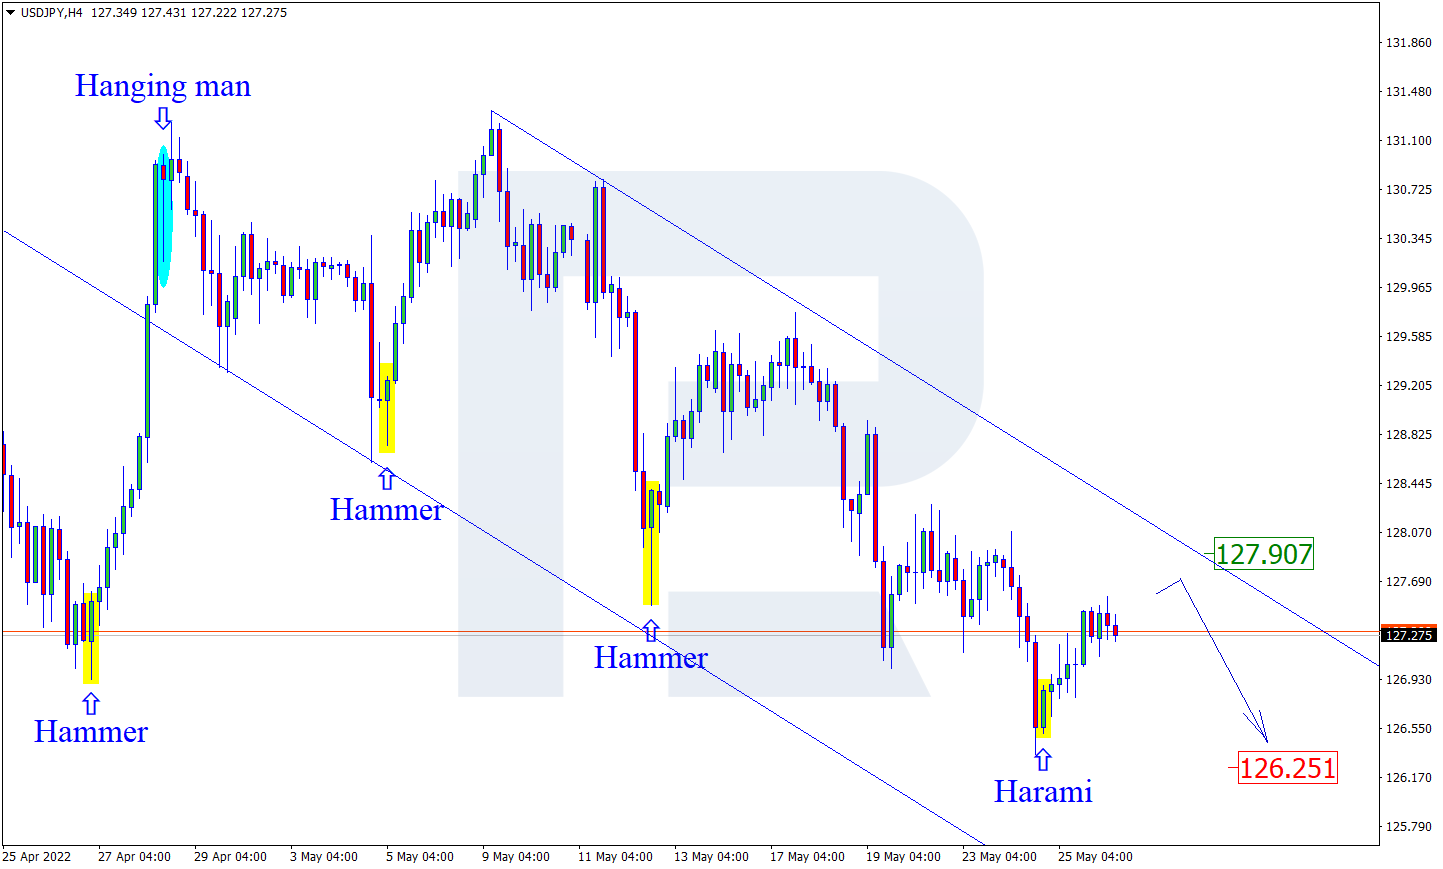
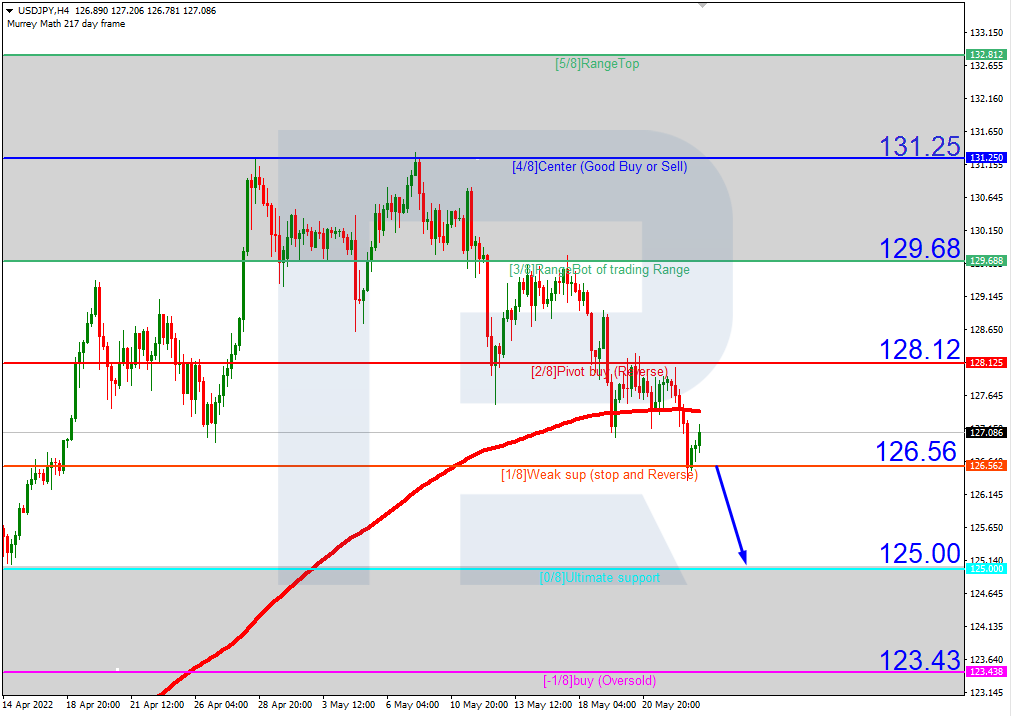
- Support levels: 126.25, 125.47
- Resistance levels: 127.53, 128.29, 128.73, 129.07, 130.12, 130.99
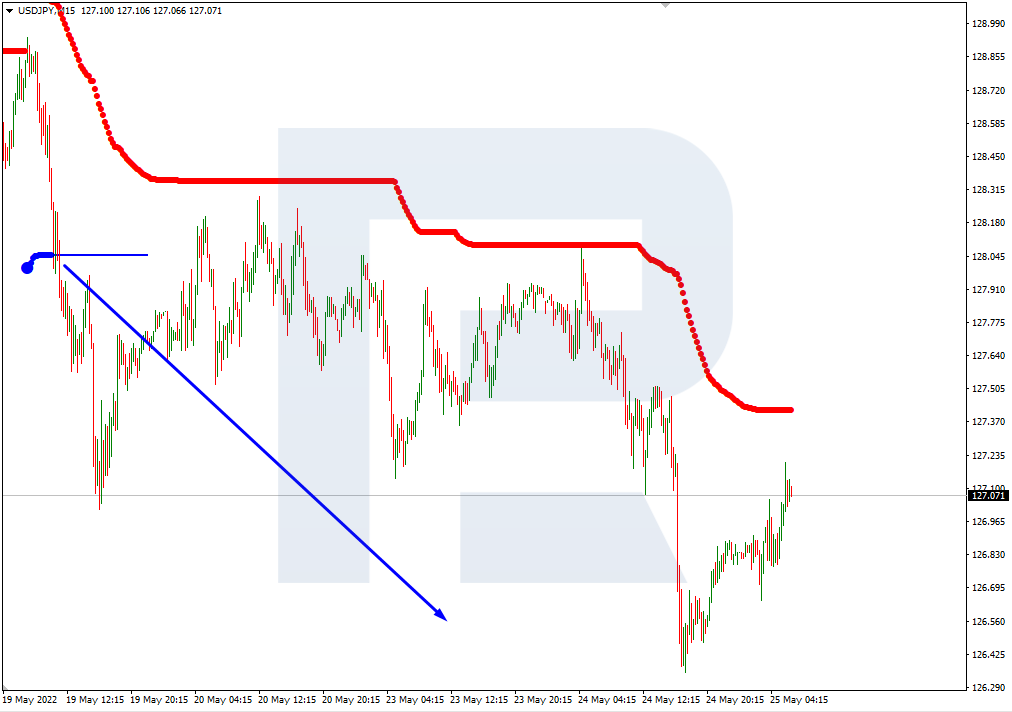
The medium-term trend on the USD/JPY currency is bearish. The MACD indicator is in the positive zone, but the buyer’s pressure is weak. Buy trades can be considered from the support level of 126.25, but with confirmation. For sell deals, resistance level of 127.53 may be considered, but only with additional confirmation.
Alternative scenario: If the price fixes above 128.73, the uptrend will likely resume.

- – Japan Tokyo Core CPI (m/m) at 02:30 (GMT+3).
The USD/CAD currency pair
- Prev Open: 1.2816
- Prev Close: 1.2769
- % chg. over the last day: -0.37%
The fundamental picture of the USD/CAD currency pair remains the same. The Bank of Canada is on the path to aggressively rising rates, as well as the US Federal Reserve. Oil prices jumped by 3% on Thursday, reaching a two-week high, which gave confidence to the Canadian dollar since it’s a commodity currency. Traders should only trade USD/CAD with short targets as ,fundamentally, both the dollar index and the Canadian dollar are essentially supported by the central bank.
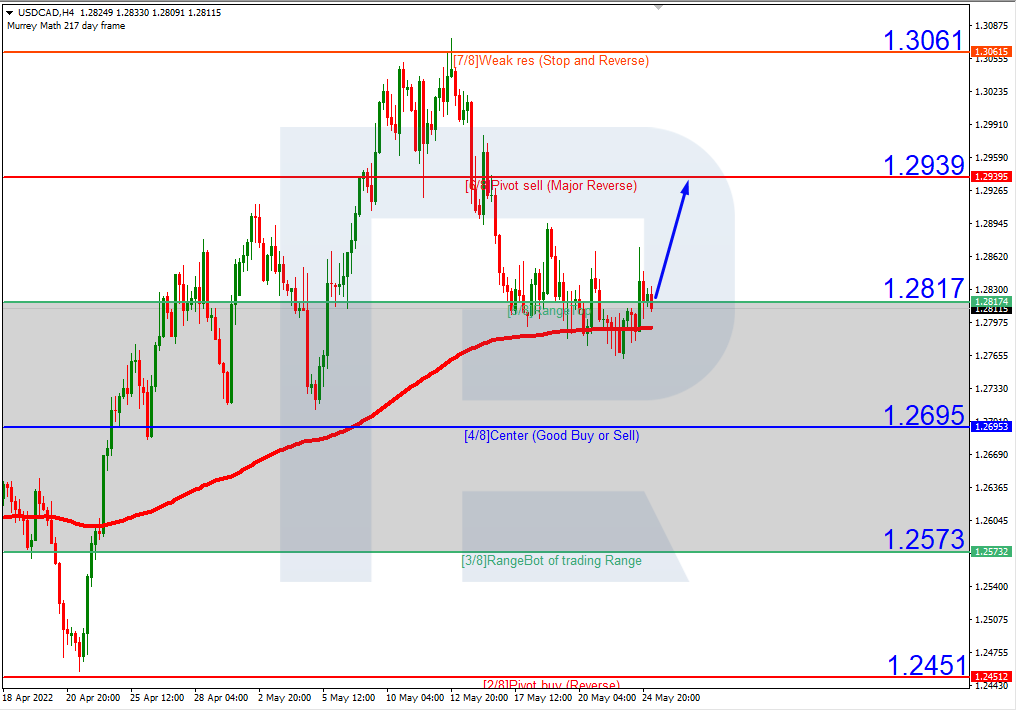
- Support levels: 1.2736, 1.2692, 1.2644, 1.2607, 1.2521
- Resistance levels: 1.2787, 1.2893, 1.2953, 1.3000, 1.3052
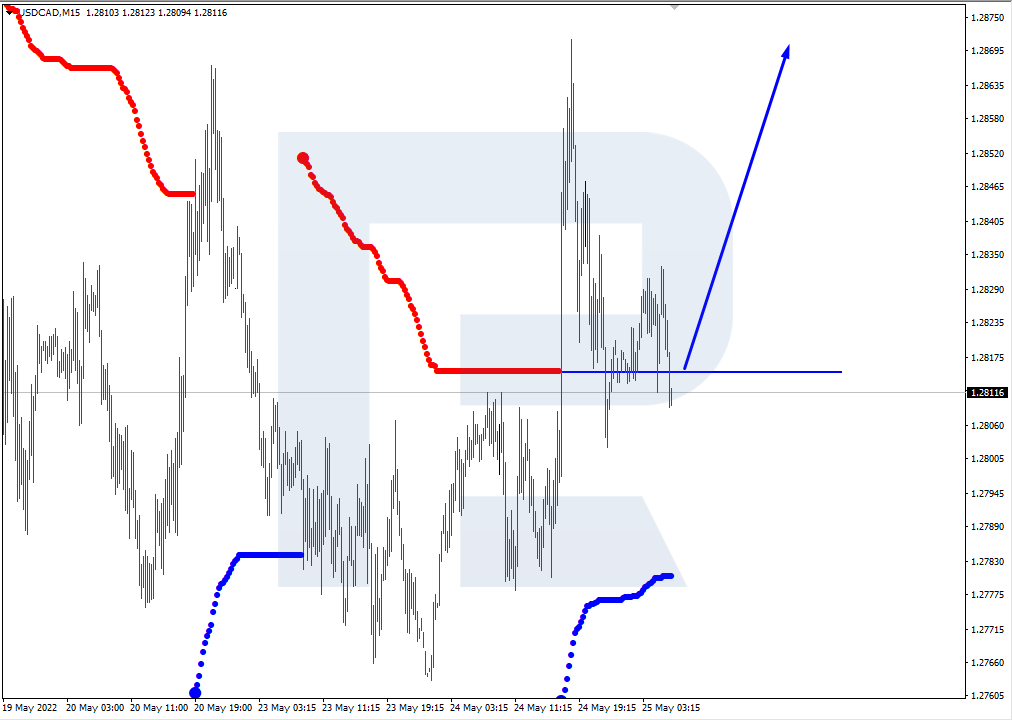
The USD/CAD currency pair is bearish in terms of technical analysis. The MACD indicator has become bearish, but the sellers’ pressure is slowly decreasing due to the growth of divergence. Under such market conditions, it is better to look for buy trades on the lower time frames from the support level of 1.2736, but only with additional confirmation. For sell deals, it is better to consider the resistance level of 1.2787, but also better with confirmation and short targets.
Alternative scenario: if the price breaks through and consolidates above 1.2953, the uptrend will likely resume.

by JustForex
This article reflects a personal opinion and should not be interpreted as an investment advice, and/or offer, and/or a persistent request for carrying out financial transactions, and/or a guarantee, and/or a forecast of future events.