Archive for Forex and Currency News – Page 136

The Analytical Overview of the Main Currency Pairs on 2022.05.20

by JustForex

The EUR/USD currency pair

Technical indicators of the currency pair:
  • Prev Open: 1.0462
  • Prev Close: 1.0583
  • % chg. over the last day: +1.15%

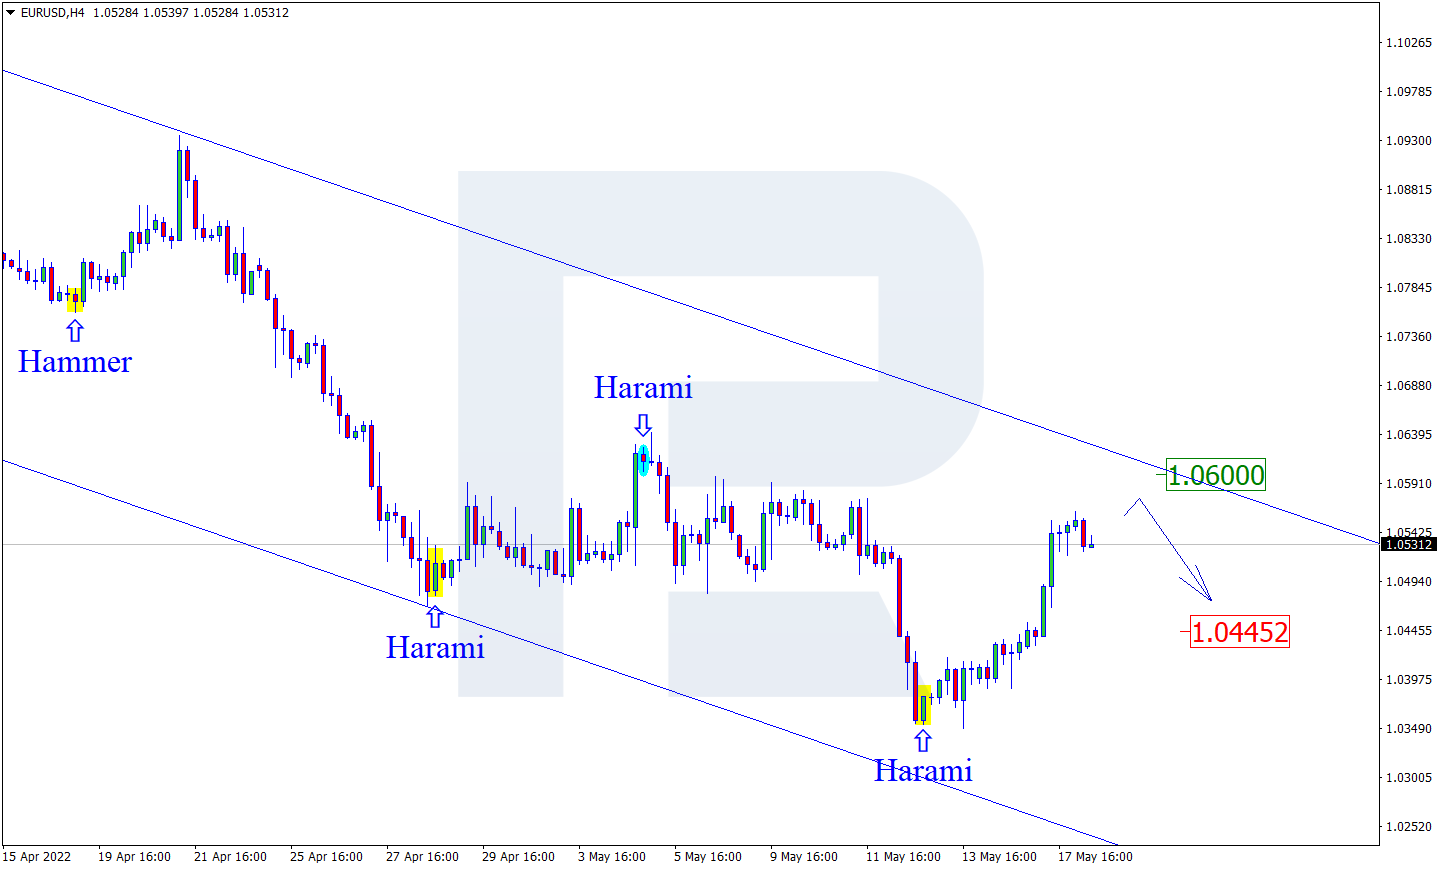
The minutes of the European Central Bank’s April monetary policy meeting showed that inflation concerns prompted dovish central bank officials to support a 0.25-point rate hike as early as July. The rest of the representatives favor an immediate 0.5% hike. At the same time, net asset purchases will cease in late June. As the market began to consider the risks of a 0.5% interest rate hike, the euro began to strengthen.

Trading recommendations
  • Support levels: 1.0545, 1.0509, 1.0445, 1.0379, 1.0342
  • Resistance levels: 1.0595, 1.0646, 1.0723, 1.0766, 1.0799, 1.0869

From a technical point of view, the trend on the EUR/USD currency pair on the hour timeframe has changed to bullish. The price broke through the priority change level and consolidated above the moving averages. The MACD indicator became positive, but a divergence appeared. Under such market conditions, investors can look for buy trades on intraday time frames from the support level of 1.0545, but only with short targets and confirmation. Sell trades can be considered from the resistance level of 1.0595, but only after the additional confirmation.

Alternative scenario: if the price breaks out through the 1.0445 support level and fixes below, the downtrend will likely resume.

EUR/USD
There is no news feed for today.

The GBP/USD currency pair

Technical indicators of the currency pair:
  • Prev Open: 1.2335
  • Prev Close: 1.2470
  • % chg. over the last day: +1.09%

Consumer sentiment in the UK has fallen to its lowest level since 1974. Consumers are increasingly pessimistic about the economy amid a deepening cost-of-living crisis. Investor fears are growing that the UK, like the US, is facing a recession. The inflationary blow to living standards is already forcing consumers to tighten their belts as rising prices for necessities such as food, fuel, and energy are forcing them to cut other costs.

Trading recommendations
  • Support levels: 1.2437, 1.2398, 1.2283, 1.2199
  • Resistance levels: 1.2485, 1.2519, 1.2602, 1.2695, 1.2792, 1.2981

On the hourly time frame, the GBP/USD currency pair trend changed to bullish. The MACD indicator became positive, but divergence appeared. Under such market conditions, buy deals may be considered from the support level of 1.2398, but only with additional confirmation. Sell deals should be looked for from the resistance level of 1.2485, but with confirmation in the form of sellers’ initiative.

Alternative scenario: if the price breaks down through the 1.2282 support level and fixes below, the mid-term downtrend will likely resume.

GBP/USD
News feed for 2022.05.20:
  • – UK Retail Sales (m/m) at 09:00 (GMT+3).

The USD/JPY currency pair

Technical indicators of the currency pair:
  • Prev Open: 128.13
  • Prev Close: 127.82
  • % chg. over the last day: -0.24%

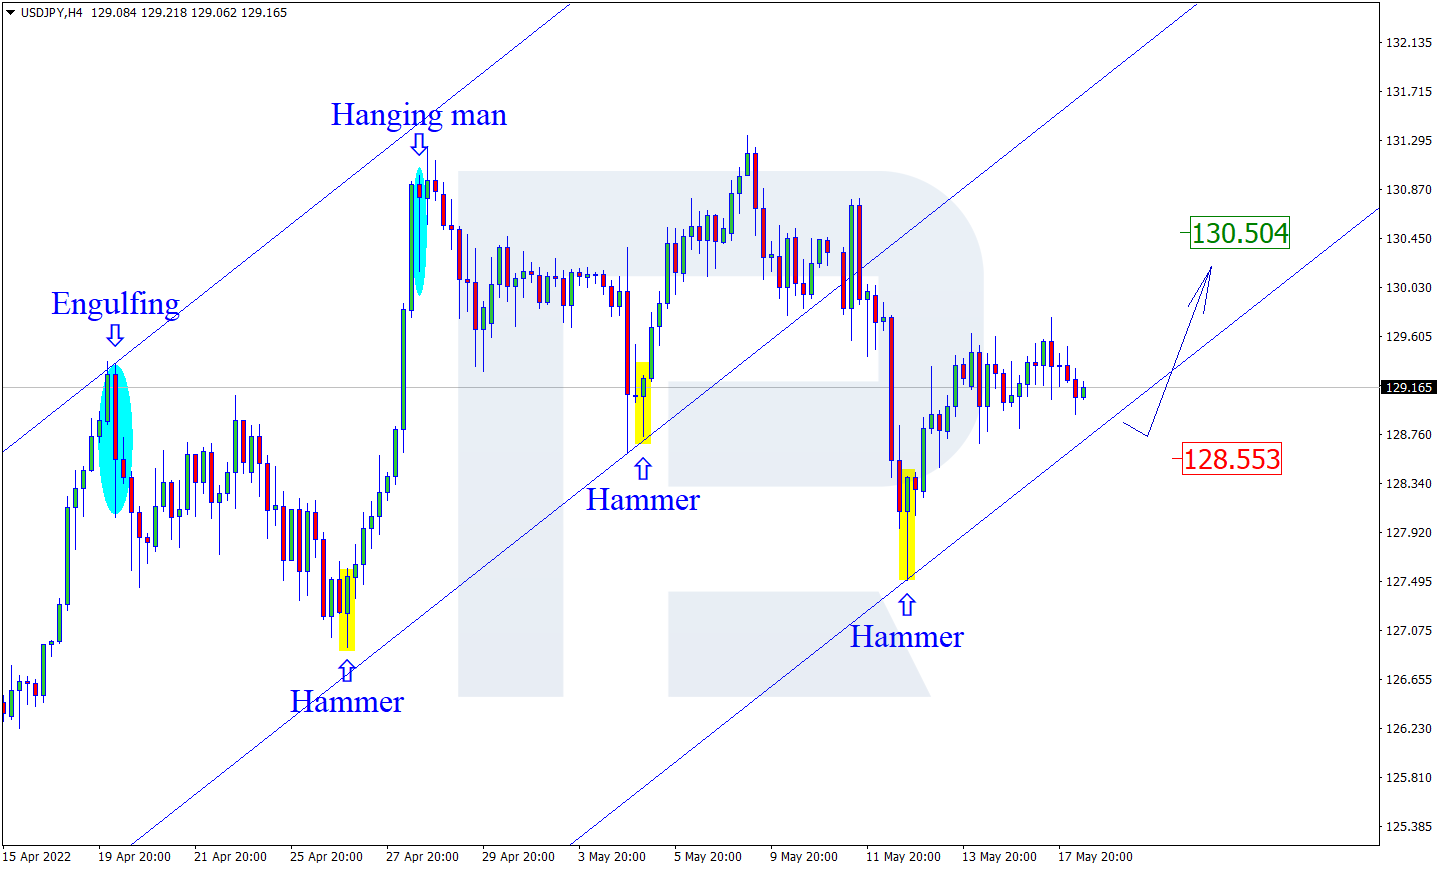
Core consumer inflation in Japan reached a central bank’s target of 2% (2.1% year on year) in April, reaching a seven-year high as rising energy and commodity prices led to wider price increases. Rising prices are exacerbating public concerns about the high cost of living. The Bank of Japan must now respond by pursuing a soft monetary policy to boost the inflation rate. The Japanese yen may be strengthening not only as a safe-haven currency but also because the Bank of Japan may soon abandon its loose monetary policy.

Trading recommendations
  • Support levels: 127.46, 126.91, 126.00, 125.57
  • Resistance levels: 127.94, 128.45, 128.73, 129.07, 130.12, 130.99

The medium-term trend on the USD/JPY currency has changed to bearish. The MACD indicator is in the negative zone, and sellers’ pressure prevails, but there are signs of divergence. Buy trades can be considered from the support level of 127.46, but with confirmation. Resistance level of 127.94 may be considered for sell deals, but only with additional confirmation.

Alternative scenario: If the price fixes above 129.07, the uptrend will likely resume.

USD/JPY
News feed for 2022.05.20:
  • – Japan National Core Consumer Price Index at 02:30 (GMT+3).

The USD/CAD currency pair

Technical indicators of the currency pair:
  • Prev Open: 1.2885
  • Prev Close: 1.2822
  • % chg. over the last day: -0.49%

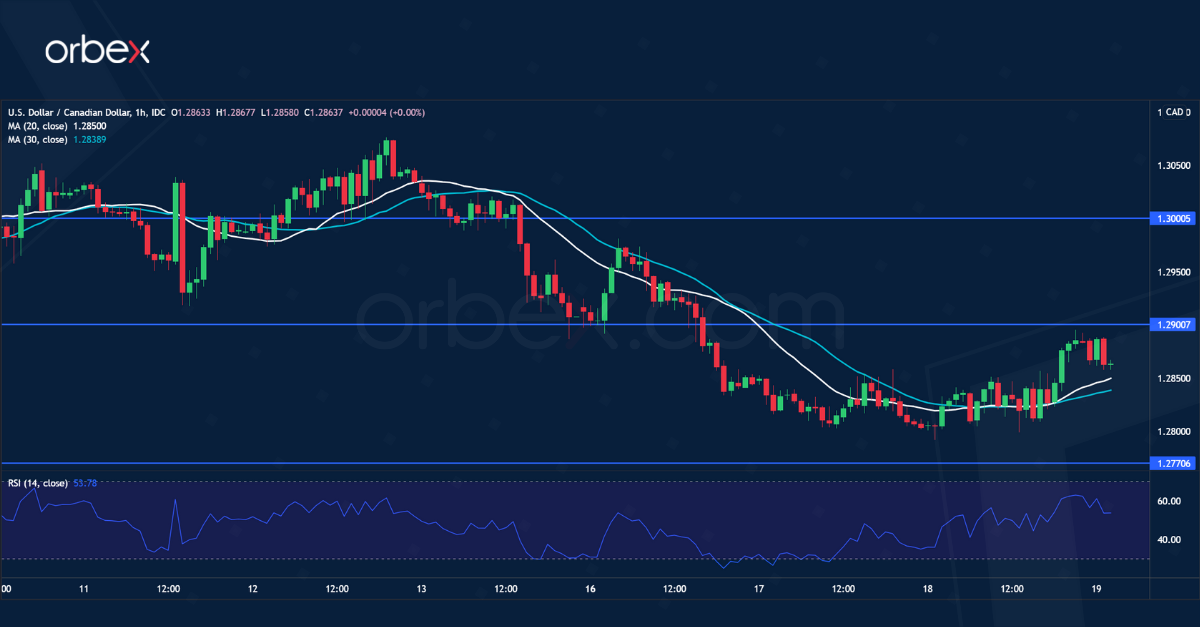
Given the rise in oil prices and the fact that the Bank of Canada will raise interest rates at its next meetings – all of these factors are positive for the Canadian dollar, which has been strengthening in recent days. Currently, the Bank of Canada and the US Federal Reserve hold key rates at 1%. This parity suggests that traders should not expect medium-term trends in the USD/CAD currency pair, as both currencies are inclined to rise now.

Trading recommendations
  • Support levels: 1.2789, 1.2774, 1.2692, 1.2644, 1.2607, 1.2521
  • Resistance levels: 1.2858, 1.2859, 1.2953, 1.3000, 1.3052

The USD/CAD currency pair is bearish in terms of technical analysis. The MACD indicator is in the negative zone, but it moves towards zero. At the same time, there is a divergence, which is a sign of sellers’ weakness. Under such market conditions, it is better to look for buy trades on the lower time frames from the support level of 1.2774, but only with additional confirmation. For sell deals, it is better to consider the resistance level of 1.2826, but also better with confirmation and short targets.

Alternative scenario: if the price breaks through and consolidates above 1.2953, the uptrend will likely resume.

USD/CAD
There is no news feed for today.

by JustForex


This article reflects a personal opinion and should not be interpreted as an investment advice, and/or offer, and/or a persistent request for carrying out financial transactions, and/or a guarantee, and/or a forecast of future events.

Week Ahead: Can NZDUSD sustain its rebound?

By ForexTime

G10 currencies enjoyed some reprieve against the US dollar this week, although stocks have endured another brutal selloff.

Markets are set to remain gripped by the effects of soaring inflation on companies’ bottom lines and on the performance of major economies.

More clues may come via the following economic data releases, events, and company earnings due in the week ahead:

Monday, May 23

  • EUR: Germany May IFO Business Climate
  • GBP: BOE Governor Andrew Bailey speech
  • USD: Fed speak – Atlanta Fed President Raphael Bostic, Kansas Fed President Esther George
  • Zoom Q1 earnings

Tuesday, May 24

  • EUR: Eurozone May PMIs
  • GBP: UK May PMIs
  • USD: US May PMIs

Wednesday, May 25

  • NZD: RBNZ rate decision
  • US crude: EIA weekly US crude inventories
  • USD: FOMC May meeting minutes
  • Nvidia Q1 earnings

Thursday, May 26

  • USD: US 1Q GDP (second estimate), weekly initial jobless claims
  • CAD: Canada March retail sales
  • Q1 earnings: Alibaba, Baidu, Dell, Macy’s

Friday, May 27

  • CNH: China April industrial profits
  • AUD: Australia April retail sales
  • USD: US April personal income and spending, PCE deflator, and May consumer sentiment (final print)


NZDUSD was able to clamber away from its two-year low close to 0.620, only to be resisted by its 21-day simple moving average as well as its downtrend line that began since April.

This currency pair was also due for a rebound, with its 14-day relative strength index resurfacing above the 30 threshold which signals oversold conditions.


NZDUSD’s performance in the coming week is set to be influenced by the RBNZ rate decision, as well as the latest FOMC minutes and Fed speeches.

Markets are expecting the RBNZ to hike by a further 50 basis points this month, adding to the 125 basis points in hikes already incurred since October, in a bid to get ahead of inflation that has risen to its highest in over 30 years.

A dovish surprise by way of a 25 basis point hike could see the kiwi falter back closer to the 0.62 mark against the US dollar.

Also, if the RBNZ signals that it cannot raise rates as much as previously expected, for fear of sending the economy into a recession, that could also prompt the kiwi to unwind recent gains. Already, New Zealand’s Treasury Department is forecasting meagre growth of just 0.1% for the second, third, and fourth quarters of 2023.

Policymakers and market participants are well aware that the slightest policy misstep could send NZ into a recession, and the NZD falling further as such prospects.


On the other side of this currency pair, the US dollar could be restored to recent heights if the incoming FOMC minutes and scheduled Fed speak continue to ramp up the hawkish rhetoric and help US yields restore their advantage over its G10 peers.

However, if growth concerns surrounding the US economy outweigh fears over the ultra-hawkish Fed, that could prompt investors to rush back to the safety of US Treasuries, pushing down its yields while prompting the greenback to unwind its recent gains and offer more relief for the rest of the FX universe.


Forex-Time-LogoArticle by ForexTime

ForexTime Ltd (FXTM) is an award winning international online forex broker regulated by CySEC 185/12 www.forextime.com

Ichimoku Cloud Analysis 19.05.2022 (NZDUSD, XAUUSD, EURGBP)

Article By RoboForex.com

NZDUSD, “New Zealand Dollar vs US Dollar”

NZDUSD is rebounding from the bearish channel’s upside border. The instrument is currently moving inside Ichimoku Cloud, thus indicating a sideways tendency. Early in May, there was a similar test of the cloud, which resulted in a further downtrend. The markets could indicate that the price may re-test Tenkan-Sen at 0.6330 and then resume moving downwards to reach 0.6075. Another signal in favour of a further downtrend will be a rebound from the descending channel’s upside border. However, the bearish scenario may no longer be valid if the price breaks the cloud’s upside border and fixes above 0.6405. In this case, the pair may continue growing towards 0.6505. To confirm further decline, the asset must break the rising channel’s downside border and fix below 0.6230; so far, bears haven’t been able to leave the correctional channel.

NZDUSD
Risk Warning: the result of previous trading operations do not guarantee the same results in the future

XAUUSD, “Gold vs US Dollar”

XAUUSD is testing Tenkan-Sen and Kijun-Sen. The instrument is currently moving below Ichimoku Cloud, thus indicating a descending tendency. The markets could indicate that the price may test the cloud’s downside border at 1825.00 and then resume moving downwards to reach 1725.00. Another signal in favour of a further downtrend will be a rebound from the descending channel’s upside border. However, the bearish scenario may no longer be valid if the price breaks the cloud’s upside border and fixes above 1865.00. In this case, the pair may continue growing towards 1895.00. To confirm further decline, the asset must break the rising channel’s downside border and fix below 1805.00.

XAUUSD
Risk Warning: the result of previous trading operations do not guarantee the same results in the future

EURGBP, “Euro vs Great Britain Pound”

EURGBP is correcting within a “5-0” pattern. The instrument is currently moving below Ichimoku Cloud, thus indicating a descending tendency. The markets could indicate that the price may test the cloud’s downside border at 0.8490 and then resume moving downwards to reach 0.8320. Another signal in favour of a further downtrend will be a rebound from the descending channel’s upside border. However, the bearish scenario may no longer be valid if the price breaks the cloud’s upside border and fixes above 0.8535. In this case, the pair may continue growing towards 0.8625.

EURGBP

Article By RoboForex.com

Attention!
Forecasts presented in this section only reflect the author’s private opinion and should not be considered as guidance for trading. RoboForex LP bears no responsibility for trading results based on trading recommendations described in these analytical reviews.

EURUSD remains nervous. Overview for 19.05.2022

Article By RoboForex.com

EURUSD remains volatile; the asset is very sensitive to any changes in the market sentiment.

The major currency pair fixed within a sideways range on Thursday. the current quote for the instrument is 1.0482.

The US economy is now getting real confirmation that an inflation boost might really damage its key elements and mechanisms. Quarterly reports from big-time retailers, such as Walmart and Target, showed that the consumer sector marginality was reducing. Earlier, this sector was considered a protective one, but this status is fading away now due to the inflation rally. It’s interesting that the latest retail sales report hasn’t shown it yet.

Market players will keep an eye on inflation until the Fed’s rate hike shows its effect.

The US Fed Chairman Jerome Powell said the same yesterday. However, there are reasons for raising the rate faster, 50-75 basis points at a time. This aspect puts pressure on capital markets and makes investors escape risks. In this light, EURUSD remains highly volatile.

Later today, market players should pay attention to the weekly Unemployment Claims report from the US, which is currently fluctuating between 200-210K. Any significant deviations from this range may signal changes in the labour market.

Moreover, the European Central Bank is planning to release its Monetary Policy Meeting Accounts. Investors will look through the document to find any hints at the regulator’s willingness to make its monetary policy more aggressive in response to the inflation rally. This might be positive for the Euro.

Article By RoboForex.com

Attention!
Forecasts presented in this section only reflect the author’s private opinion and should not be considered as guidance for trading. RoboForex LP bears no responsibility for trading results based on trading recommendations described in these analytical reviews.

The Analytical Overview of the Main Currency Pairs on 2022.05.19

by JustForex

The EUR/USD currency pair

Technical indicators of the currency pair:
  • Prev Open: 1.0545
  • Prev Close: 1.0460
  • % chg. over the last day: -0.81%

The annual inflation rate in the Eurozone decreased from 7.5% to 7.4%. These are signs that inflation is slowing down. But it is a negative sign for the European currency as the ECB does not need to conduct a more aggressive monetary policy and rush to end its stimulus program. Today the ECB will publish the April minutes of its monetary policy meeting.

Trading recommendations
  • Support levels: 1.0445, 1.0379, 1.0342
  • Resistance levels: 1.0515, 1.0545, 1.0587, 1.0646, 1.0723, 1.0766, 1.0799, 1.0869

From the technical point of view, the trend on the EUR/USD currency pair on the hour timeframe is still bearish. The price is balanced now, as it is trading between the moving averages. The MACD is negative again. Under such market conditions, it is possible to look for sell trades from the resistance level of 1.0545, but only after the additional confirmation. Buy trades can be considered on intraday timeframes from the support level of 1.0445, but only with short targets and confirmation.

Alternative scenario: if the price breaks out through the 1.0545 resistance level and fixes above, the uptrend will likely resume.

EUR/USD
News feed for 2022.05.19:
  • – Eurozone ECB Monetary Policy Meeting Accounts at 14:30 (GMT+3);
  • – US Initial Jobless Claims (w/w) at 15:30 (GMT+3);
  • – US Philadelphia Fed Manufacturing Index (m/m) at 15:30 (GMT+3);
  • – US Existing Home Sales (m/m) at 17:00 (GMT+3).

The GBP/USD currency pair

Technical indicators of the currency pair:
  • Prev Open: 1.2490
  • Prev Close: 1.2337
  • % chg. over the last day: -1.24%

The UK Finance Minister Sunak yesterday pointed out that unlimited fiscal stimulus risks exacerbating the inflation problem. In the UK there is an increasing conflict between the government and the Bank of England. The government is criticizing the policy for its inability to curb the rise in inflation rates. With a high probability, the Bank of England will begin to take more decisive action to save its face.

Trading recommendations
  • Support levels: 1.2443, 1.2283, 1.2199
  • Resistance levels: 1.2393, 1.2467, 1.2519, 1.2602, 1.2695, 1.2792, 1.2981

On the hourly time frame, the GBP/USD currency pair trend changed to bullish. The MACD indicator became negative, and the price pullbacks to the moving averages. Under such market conditions, buy deals may be considered from the support level of 1.2343 or 1.2283, but only with additional confirmation. Sell deals should be looked for from the resistance level of 1.2467, but with confirmation in the form of sellers’ initiative.

Alternative scenario: if the price breaks down through the 1.2200 support level and fixes below, the mid-term downtrend will likely be resumed.

GBP/USD
There is no news feed for today.

The USD/JPY currency pair

Technical indicators of the currency pair:
  • Prev Open: 129.40
  • Prev Close: 128.24
  • % chg. over the last day: -0.90%

More than 60% of Japanese companies want the central bank to end its policy of massive monetary easing this fiscal year because of yen weakness, with about a quarter urging it to take action now. A rapid slide in the yen to a two-decade low has jacked up prices of fuel and raw materials imports, lifting not only corporate costs but also hitting household spending. The Bank of Japan is not going to change its monetary policy yet, but it should be noted that Japan’s inflation rate is close to the 2% target. Now Kuroda wants to see inflation be sustainable.

Trading recommendations
  • Support levels: 128.29, 127.29, 126.91, 126.00, 125.57
  • Resistance levels: 128.93, 129.34, 130.12, 130.99

The medium-term trend on the USD/JPY currency has changed to bearish. The Japanese yen is being bought by investors as a safe-haven currency, so the yen is temporarily strengthening. But despite the change in the trend on the hour timeframe, it is better to look for buy deals with the expectation of an uptrend continuation since the Japanese Yen has no fundamental support. First of all, it is worth considering the support level of 128.29, but with confirmation. A resistance level of 129.34 may be considered for sell deals, but only with additional confirmation.

Alternative scenario: If the price fixes above 130.12, the uptrend will likely be resumed.

USD/JPY
There is no news feed for today.

The USD/CAD currency pair

Technical indicators of the currency pair:
  • Prev Open: 1.2809
  • Prev Close: 1.2892
  • % chg. over the last day: +0.64%

The growth of consumer prices in Canada showed 0.6% in April. On an annualized basis, the inflation rate reached 6.8%. Most of the price growth was driven by food and housing prices. Core inflation (excluding food and fuel prices) increased from 5.5% to 5.8%. This is the fastest rate of growth since 1999. Russia’s invasion of Ukraine continues to affect energy prices, commodity prices, and primarily food prices.

Trading recommendations
  • Support levels: 1.2826, 1.2774, 1.2692, 1.2644, 1.2607, 1.2521
  • Resistance levels: 1.2858, 1.2904, 1.2953, 1.3000, 1.3052

The USD/CAD currency pair trend is bearish in terms of technical analysis. But now the price is balanced, the MACD indicator has become inactive, and the price is trading between the moving averages. It is worth trading only with short targets because, fundamentally, both the dollar index and the Canadian dollar are inclined to grow. Under such market conditions, it is better to look for buy trades on the lower timeframes from the support level of 1.2826, but only with additional confirmation. For sell deals, it is better to consider the resistance level of 1.2858 or 1.2904, but also better with confirmation and short targets.

Alternative scenario: if the price breaks through and consolidates above 1.3000, the uptrend will likely be resumed.

USD/CAD
There is no news feed for today.

by JustForex


This article reflects a personal opinion and should not be interpreted as an investment advice, and/or offer, and/or a persistent request for carrying out financial transactions, and/or a guarantee, and/or a forecast of future events.

Intraday Market Analysis – WTI Hits Resistance

By Orbex

USDCAD attempts to rebound

The Canadian dollar softened after a slowdown in April’s CPI growth. The US dollar is seeking support after it broke above December’s high at 1.2960. The pair is testing the origin of the previous bullish breakout at 1.2770 which also lies on the 30-day moving average. An oversold RSI in this congestion area prompted sellers to take some chips off the table. A rally back above 1.2900 may ease the selling pressure. On the downside, 1.2710 is a key support on the daily chart and its breach could lead to a bearish reversal.

EURGBP bounces off support

The pound retreated after Britain’s CPI growth in April fell short of expectations. A bullish MA cross on the daily chart foreshadows a potential acceleration to the upside after the euro rallied above this year’s high at 0.8500. The latest retracement saw solid buying interest near the daily support (0.8400) along the 30-day moving average. 0.8530 is the closest resistance and its breach would raise offers to the recent high at 0.8620. Otherwise, a deeper correction would bring the single currency to 0.8310.

USOIL seeks support

WTI weakens as US refiners raise their capacity use. A close above the daily resistance at 111.00 is a sign that the rally may resume after the bears covered their bets. As the price action hit the ceiling at 116.60, the RSI’s repeatedly overbought condition triggered a pullback. The bulls may see it as an opportunity to accumulate. 106.50 is the first level where bids could be expected. 98.50 is the critical floor to keep the recent rally valid. A bullish breakout could trigger a runaway rally towards this year’s high at 129.00.

Test your strategy on how oil will fare with Orbex – Open your account now. 


Orbex-LogoArticle by Orbex

Orbex is a fully licensed broker that was established in 2011. Founded with a mission to serve its traders responsibly and provides traders with access to the world’s largest and most liquid financial markets. www.orbex.com

Mid-week Technical Outlook: Minors & Crosses In Focus

By ForexTime

It is shaping up to be another volatile week for financial markets thanks to key economic reports from major economies and numerous speeches by Federal Reserve officials.

Global equities were tugged and pulled by inflation fears, rate hike expectations, and ongoing geopolitical risks. In the currency space, king dollar loosened its grip on the FX space allowing G10 majors to bounce while lingering below its 200-day Simple Moving Average.

Over the past few weeks our attention has been on king dollar but this afternoon the spotlight shines on minor and cross currency pairs. The minors are normally referring to non-USD forex currency pairs while crosses are pairs that do not contain the dollar as either the base or quote currency.

Although minors and crosses are slightly less popular than the majors and often experience more wild swings due to less liquidity in the markets, they still present trading opportunities. So, if you have had enough of the dollar and would like something different, check out the setups below!

GBPJPY wobbles above 160.00

After rallying the previous session, the GBPJPY looks tired and may be running on empty fumes. Prices remain bearish on the daily timeframe with the candlesticks trading within a negative channel. A breakdown below 160.00 could result in a steeper decline towards 157.50 and lower. Should 160.00 prove to be reliable support, an incline back towards 162.00 could be on the cards.

EUR/JPY ready to resume selloff?

The technical bounce on the EURJPY could be over if prices fail to push above 137.00. Bears still remain in some control with prices respecting a bearish channel on the daily charts. A decline back under the 50-day Simple Moving Average could trigger a selloff towards 134.50 and 133.00, respectively. If prices are able to break above 137.00, then a move towards 138.00 could become reality.

EUR/GBP choppy as ever

There is a lot going on with the EURGBP as bulls and bears battle it out. Prices remain as choppy as ever but the trend could turn negative if prices close below 0.8420. Sustained weakness below this level could result in a further decline towards 0.8380.  If prices are able to bounce from 0.8420, the next key level of interest can be found at 0.8500.

EURAUD breakdown or bounce?

As the subtitle says, the EURAUD can either experience a technical bounce from 1.4900 or breakdown below this point to hit 1.4600. The trend looks bullish on the daily charts but prices are trading below the 100 and 200-day Simple Moving Average. Should 1.4900 prove to be reliable support, a move back towards 1.5300 could on the cards.

AUD/NZD higher highs and higher lows…

This currency pair remains firmly bullish on the daily timeframe. There have been consistently higher highs and higher lows while the MACD trades to the upside. A solid breakout and daily close above 1.1100 could encourage a move higher towards 1.1200. A daily close below 1.0750 could trigger a selloff towards 1.08200

polygon

Forex-Time-LogoArticle by ForexTime

ForexTime Ltd (FXTM) is an award winning international online forex broker regulated by CySEC 185/12 www.forextime.com

Japanese Candlesticks Analysis 18.05.2022 (EURUSD, USDJPY, EURGBP)

Article By RoboForex.com

EURUSD, “Euro vs US Dollar”

As we can see in the H4 chart, the asset has formed a Harami reversal pattern close to the support area. At the moment, EURUSD is reversing in the form of a new ascending impulse. In this case, the upside target may be at 1.0600. However, an alternative scenario implies that the price may continue falling to reach 1.0445 without any pullbacks towards the resistance level.

EURUSD
Risk Warning: the result of previous trading operations do not guarantee the same results in the future

USDJPY, “US Dollar vs Japanese Yen”

As we can see in the H4 chart, USDJPY has formed a Hammer pattern not far from the support area. At the moment, the asset is reversing in the form of a new ascending impulse. In this case, the upside target may be at 130.50. At the same time, an opposite scenario implies that the price may correct to rebound from 128.55 and then resume the uptrend.

USDJPY
Risk Warning: the result of previous trading operations do not guarantee the same results in the future

EURGBP, “Euro vs Great Britain Pound”

As we can see in the H4 chart, after forming a Harami pattern near the support area, EURGBP is reversing in the form of a new rising impulse. In this case, the upside target may be the resistance level at 0.8550. Later, the market may test this level, break it, and then continue the ascending tendency. Still, there might be an alternative scenario, according to which the asset may correct to reach 0.8410 first and then resume trading upwards.

EURGBP

Article By RoboForex.com

Attention!
Forecasts presented in this section only reflect the author’s private opinion and should not be considered as guidance for trading. RoboForex LP bears no responsibility for trading results based on trading recommendations described in these analytical reviews.

The Euro is looking for options. Overview for 18.05.2022

Article By RoboForex.com

EURUSD is taking a break after four days of recovering.

The major currency pair slowed down its recovery. The current quote for the instrument is 1.0508.

The statistics published by the US yesterday were quite confident. The Retail Sales added 0.9% m/m in April after gaining 1.4% m/m the month before and against the expected reading of 1.0% m/m. The Core Retail Sales showed 0.6% m/m, which is better than forecasted.

The Industrial Production gained 1.1% m/m last month, which is much better than the expected reading of 0.4% m/m, after expanding by 0.9% m/m in March. The Capacity Utilization Rate also improved, up to 79.0%.

However, the primary focus was on the speech to be delivered by the US Fed Chairman Jerome Powell. He said that the Fed was going to raise the rates until inflation started to fall. If it implies pushing the boundaries of the theoretical conception of neutrality, the Fed will do what is necessary without hesitation.

We remind you that the April CPI reading was 8.3%, while the target level is 2.0%. Earlier this month, the regulator raised the rate by 50 basis points, for the first time in 20 years. It was the second consecutive rate hike and the Fed is expected to raise the benchmark interest rate after every meeting until the end of 2022.

Article By RoboForex.com

Attention!
Forecasts presented in this section only reflect the author’s private opinion and should not be considered as guidance for trading. RoboForex LP bears no responsibility for trading results based on trading recommendations described in these analytical reviews.

The Analytical Overview of the Main Currency Pairs on 2022.05.18

by JustForex

The EUR/USD currency pair

Technical indicators of the currency pair:
  • Prev Open: 1.0434
  • Prev Close: 1.0542
  • % chg. over the last day: +1.03%

The Consumer Price Index data (inflation rate) will be released today in Europe. Analysts expect the inflation rate to remain unchanged, which will mean a slowdown in inflation in the region. If the data is worse than expected it will be a positive factor for the European currency strengthening on expectations of faster monetary policy tightening.

Trading recommendations
  • Support levels: 1.0491, 1.0445, 1.0379, 1.0342
  • Resistance levels: 1.0587, 1.0646, 1.0723, 1.0766, 1.0799, 1.0869, 1.0955

From the technical point of view, the trend on the EUR/USD currency pair on the hourly time frame is close to changing to bullish. The price has consolidated above the moving averages but has not broken through the priority change level. The MACD indicator has become positive, but buyer’s pressure remains high. Under such market conditions, it is possible to look for sell trades from the resistance level of 1.0587, but only after the additional confirmation. Buy trades can be considered on intraday timeframes from the support level of 1.0491 or 1.0445, but only with short targets and confirmation.

Alternative scenario: if the price breaks out through the 1.0588 resistance level and fixes above, the uptrend will likely resume.

EUR/USD
News feed for 2022.05.18:
  • – Eurozone Consumer Price Index (m/m) at 12:00 (GMT+3);
  • – Eurozone ECB Financial Stability Review at 12:00 (GMT+3);
  • – US Building Permits (m/m) at 15:30 (GMT+3).

The GBP/USD currency pair

Technical indicators of the currency pair:
  • Prev Open: 1.2313
  • Prev Close: 1.2492
  • % chg. over the last day: +1.45%

The UK inflation rate reached 9.0% on an annualised basis. This is the highest recorded 12-month value since 1997. Monthly inflation increased by 2%. The Producer Price Index, which measures the rate of inflation between factories and plants, rose from 11.9% to 14% y/y. UK consumer prices are approaching a projected peak of 10.25%. The Bank of England needs to take action to suppress inflation. Analysts forecast more aggressive interest rate hikes at the next meetings.

Trading recommendations
  • Support levels: 1.2399, 1.2343, 1.2283, 1.2199
  • Resistance levels: 1.2519, 1.2602, 1.2695, 1.2792, 1.2981

On the hourly time frame, the GBP/USD currency pair trend changed to bullish. The MACD indicator became positive, and the buyers’ pressure remains high. Under such market conditions buy deals may be considered from the support level of 1.2343 or 1.2283, but only with additional confirmation. Sell deals should be looked for from the resistance level of 1.2519, but with confirmation in the form of sellers’ initiative.

Alternative scenario: if the price breaks down through the 1.2200 support level and fixes below, the mid-term downtrend will likely be resumed.

GBP/USD
News feed for 2022.05.18:
  • – UK Consumer Price Index (m/m) at 09:00 (GMT+3);
  • – UK Producer Price Index (m/m) at 09:00 (GMT+3).

The USD/JPY currency pair

Technical indicators of the currency pair:
  • Prev Open: 129.14
  • Prev Close: 129.34
  • % chg. over the last day: +0.15%

Japan’s GDP fell by 0.2% for the quarter, but the data was better than analysts’ expectations of -1.0%. Japanese Economy Minister Yamagiwa believes the slowdown is due to rising commodity prices and supply-side constraints caused by the war in Ukraine and prolonged lockdowns in China. The industrial production rate showed a 0.3% increase last month. This is a significant decrease compared to the 2% growth a month earlier.

Trading recommendations
  • Support levels: 129.02, 127.29, 126.91, 126.00, 125.57
  • Resistance levels: 129.74, 130.12, 130.99

The medium-term trend on the USD/JPY currency has changed to bearish. The price has confidently broken through the priority change level and has consolidated below the moving averages. Despite the change in the trend on the hour timeframe, it is better to look for buy deals with the expectation of an uptrend continuation, since the Japanese Yen has no fundamental support. First of all, it is worth considering the support level of 129.02, but with confirmation. A resistance level of 130.12 may be considered for sell deals, but only with additional confirmation.

Alternative scenario: If the price fixes above 130.99, the uptrend will likely be resumed.

USD/JPY
News feed for 2022.05.18:
  • – Japan GDP (q/q) at 02:50 (GMT+3);
  • – Japan Industrial Production (m/m) at 07:30 (GMT+3).

The USD/CAD currency pair

Technical indicators of the currency pair:
  • Prev Open: 1.2841
  • Prev Close: 1.2809
  • % chg. over the last day: -0.25%

Canada’s inflation data will be updated today. Analysts are forecasting a monthly inflation increase of 0.5%. If the forecasts are true, Canada’s annualised inflation rate will reach 7.2%, which will be a new multi-year record. Growth in consumer prices is usually accompanied by a strengthening of the national currency in anticipation of more aggressive monetary policy tightening by the central bank.

Trading recommendations
  • Support levels: 1.2808, 1.2774, 1.2692, 1.2644, 1.2607, 1.2521
  • Resistance levels: 1.2875, 1.2904, 1.2953, 1.3000, 1.3052

The USD/CAD currency pair trend is bearish in terms of technical analysis. The MACD indicator is in the negative zone, but the bears’ pressure is decreasing, as there are signs of divergence. It is worth trading only with short targets because fundamentally both the dollar index and the Canadian dollar are inclined to grow. Under such market conditions it is better to look for buy trades on the lower timeframes from the support level of 1.2808 or 1.2774, but only with additional confirmation. For sell deals, it is better to consider the resistance level of 1.2875 or 1.2904, but also better with confirmation and short targets.

Alternative scenario: if the price breaks through and consolidates above 1.3000, the uptrend will likely be resumed.

USD/CAD
News feed for 2022.05.18:
  • – Canada Consumer Price Index (m/m) at 15:30 (GMT+3);
  • – US Crude Oil Reserves (w/w) at 17:30 (GMT+3).

by JustForex


This article reflects a personal opinion and should not be interpreted as an investment advice, and/or offer, and/or a persistent request for carrying out financial transactions, and/or a guarantee, and/or a forecast of future events.