By InvestMacro
Here are the latest charts and statistics for the Commitment of Traders (COT) data published by the Commodities Futures Trading Commission (CFTC).
The latest COT data is updated through Tuesday July 22nd and shows a quick view of how large traders (for-profit speculators and commercial entities) were positioned in the futures markets.
Weekly Speculator Changes led by Gold & Steel

The COT metals markets speculator bets were decisively higher this week as five out of the six metals markets we cover had higher positioning while the other one markets had lower speculator contracts.
Leading the gains for the metals was Gold (39,923 contracts) with Platinum (1,373 contracts), Palladium (1,281 contracts), Silver (1,172 contracts) and Steel (112 contracts) also seeing positive weeks.
The only market with a decline in speculator bets for the week was Copper with a dip by -902 contracts.
Gold Speculator Bets rise to highest since March
The gold speculator position rose this week for a fourth consecutive week and for the eighth time in the past ten weeks. This week’s boost by +39,923 contracts marked the highest one-week gain in over a year and brings the 10-week advance by speculator bets to over +91,000 contracts.
This boost in speculator bets for gold puts the current speculator net position, currently at +253,038 contracts, at the highest level in the past 18 weeks, dating back to March 18th.
Major metals prices this week were mixed
– Copper rose by over 3% for the week.
– Steel went higher by over 1.3%.
– Silver also saw just a small gain.
– Gold was down by -0.32%.
– Palladium and Platinum fell by almost -2% over the past week.
Metals Data:

Legend: Weekly Speculators Change | Speculators Current Net Position | Speculators Strength Score compared to last 3-Years (0-100 range)
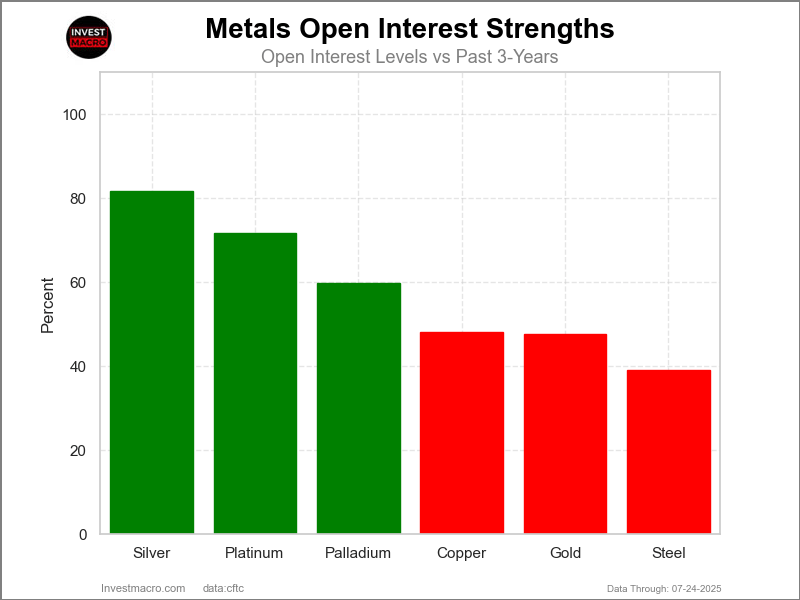
Strength Scores led by Silver & Palladium

COT Strength Scores (a normalized measure of Speculator positions over a 3-Year range, from 0 to 100 where above 80 is Extreme-Bullish and below 20 is Extreme-Bearish) showed that Silver (92 percent) and Palladium (87 percent) lead the metals markets this week. Gold (76 percent) comes in as the next highest in the weekly strength scores.
Strength Statistics:
Gold (76.3 percent) vs Gold previous week (61.2 percent)
Silver (91.8 percent) vs Silver previous week (90.3 percent)
Copper (70.3 percent) vs Copper previous week (71.2 percent)
Platinum (64.8 percent) vs Platinum previous week (61.6 percent)
Palladium (87.2 percent) vs Palladium previous week (77.6 percent)
Steel (68.4 percent) vs Palladium previous week (67.7 percent)
Palladium & Gold top the 6-Week Strength Trends

COT Strength Score Trends (or move index, calculates the 6-week changes in strength scores) showed that Palladium (26 percent) and Gold (25 percent) lead the past six weeks trends for metals. Copper (13 percent) is the next highest positive mover in the latest trends data.
Platinum (-15 percent) leads the downside trend scores currently with Silver (-8 percent) as the next market with lower trend scores.
Move Statistics:
Gold (24.9 percent) vs Gold previous week (9.6 percent)
Silver (-7.5 percent) vs Silver previous week (-1.7 percent)
Copper (12.5 percent) vs Copper previous week (15.5 percent)
Platinum (-14.9 percent) vs Platinum previous week (-1.8 percent)
Palladium (26.3 percent) vs Palladium previous week (27.9 percent)
Steel (9.9 percent) vs Steel previous week (13.8 percent)
Individual Markets:
Gold Comex Futures:
 The Gold Comex Futures large speculator standing this week totaled a net position of 253,038 contracts in the data reported through Tuesday. This was a weekly advance of 39,923 contracts from the previous week which had a total of 213,115 net contracts.
This week’s current strength score (the trader positioning range over the past three years, measured from 0 to 100) shows the speculators are currently Bullish with a score of 76.3 percent. The commercials are Bearish with a score of 20.7 percent and the small traders (not shown in chart) are Bullish with a score of 72.0 percent.
Price Trend-Following Model: Uptrend
Our weekly trend-following model classifies the current market price position as: Uptrend.
| Gold Futures Statistics | SPECULATORS | COMMERCIALS | SMALL TRADERS |
| – Percent of Open Interest Longs: | 63.7 | 15.7 | 11.0 |
| – Percent of Open Interest Shorts: | 12.0 | 73.4 | 5.1 |
| – Net Position: | 253,038 | -282,337 | 29,299 |
| – Gross Longs: | 311,949 | 76,726 | 54,052 |
| – Gross Shorts: | 58,911 | 359,063 | 24,753 |
| – Long to Short Ratio: | 5.3 to 1 | 0.2 to 1 | 2.2 to 1 |
| NET POSITION TREND: | |||
| – Strength Index Score (3 Year Range Pct): | 76.3 | 20.7 | 72.0 |
| – Strength Index Reading (3 Year Range): | Bullish | Bearish | Bullish |
| NET POSITION MOVEMENT INDEX: | |||
| – 6-Week Change in Strength Index: | 24.9 | -21.5 | -20.1 |
Silver Comex Futures:
 The Silver Comex Futures large speculator standing this week totaled a net position of 60,620 contracts in the data reported through Tuesday. This was a weekly rise of 1,172 contracts from the previous week which had a total of 59,448 net contracts.
This week’s current strength score (the trader positioning range over the past three years, measured from 0 to 100) shows the speculators are currently Bullish-Extreme with a score of 91.8 percent. The commercials are Bearish-Extreme with a score of 7.4 percent and the small traders (not shown in chart) are Bullish with a score of 60.7 percent.
Price Trend-Following Model: Strong Uptrend
Our weekly trend-following model classifies the current market price position as: Strong Uptrend.
| Silver Futures Statistics | SPECULATORS | COMMERCIALS | SMALL TRADERS |
| – Percent of Open Interest Longs: | 49.3 | 21.2 | 18.4 |
| – Percent of Open Interest Shorts: | 14.4 | 66.8 | 7.7 |
| – Net Position: | 60,620 | -79,227 | 18,607 |
| – Gross Longs: | 85,678 | 36,803 | 31,942 |
| – Gross Shorts: | 25,058 | 116,030 | 13,335 |
| – Long to Short Ratio: | 3.4 to 1 | 0.3 to 1 | 2.4 to 1 |
| NET POSITION TREND: | |||
| – Strength Index Score (3 Year Range Pct): | 91.8 | 7.4 | 60.7 |
| – Strength Index Reading (3 Year Range): | Bullish-Extreme | Bearish-Extreme | Bullish |
| NET POSITION MOVEMENT INDEX: | |||
| – 6-Week Change in Strength Index: | -7.5 | 7.1 | -2.0 |
Copper Grade #1 Futures:
 The Copper Grade #1 Futures large speculator standing this week totaled a net position of 39,822 contracts in the data reported through Tuesday. This was a weekly decline of -902 contracts from the previous week which had a total of 40,724 net contracts.
This week’s current strength score (the trader positioning range over the past three years, measured from 0 to 100) shows the speculators are currently Bullish with a score of 70.3 percent. The commercials are Bearish with a score of 35.4 percent and the small traders (not shown in chart) are Bearish with a score of 22.5 percent.
Price Trend-Following Model: Strong Uptrend
Our weekly trend-following model classifies the current market price position as: Strong Uptrend.
| Copper Futures Statistics | SPECULATORS | COMMERCIALS | SMALL TRADERS |
| – Percent of Open Interest Longs: | 34.0 | 29.0 | 6.9 |
| – Percent of Open Interest Shorts: | 16.6 | 46.8 | 6.6 |
| – Net Position: | 39,822 | -40,614 | 792 |
| – Gross Longs: | 77,637 | 66,215 | 15,779 |
| – Gross Shorts: | 37,815 | 106,829 | 14,987 |
| – Long to Short Ratio: | 2.1 to 1 | 0.6 to 1 | 1.1 to 1 |
| NET POSITION TREND: | |||
| – Strength Index Score (3 Year Range Pct): | 70.3 | 35.4 | 22.5 |
| – Strength Index Reading (3 Year Range): | Bullish | Bearish | Bearish |
| NET POSITION MOVEMENT INDEX: | |||
| – 6-Week Change in Strength Index: | 12.5 | -8.9 | -19.0 |
Platinum Futures:
 The Platinum Futures large speculator standing this week totaled a net position of 20,675 contracts in the data reported through Tuesday. This was a weekly rise of 1,373 contracts from the previous week which had a total of 19,302 net contracts.
This week’s current strength score (the trader positioning range over the past three years, measured from 0 to 100) shows the speculators are currently Bullish with a score of 64.8 percent. The commercials are Bearish with a score of 39.1 percent and the small traders (not shown in chart) are Bearish with a score of 37.2 percent.
Price Trend-Following Model: Strong Uptrend
Our weekly trend-following model classifies the current market price position as: Strong Uptrend.
| Platinum Futures Statistics | SPECULATORS | COMMERCIALS | SMALL TRADERS |
| – Percent of Open Interest Longs: | 60.8 | 19.6 | 11.1 |
| – Percent of Open Interest Shorts: | 38.0 | 46.1 | 7.4 |
| – Net Position: | 20,675 | -24,025 | 3,350 |
| – Gross Longs: | 55,180 | 17,773 | 10,028 |
| – Gross Shorts: | 34,505 | 41,798 | 6,678 |
| – Long to Short Ratio: | 1.6 to 1 | 0.4 to 1 | 1.5 to 1 |
| NET POSITION TREND: | |||
| – Strength Index Score (3 Year Range Pct): | 64.8 | 39.1 | 37.2 |
| – Strength Index Reading (3 Year Range): | Bullish | Bearish | Bearish |
| NET POSITION MOVEMENT INDEX: | |||
| – 6-Week Change in Strength Index: | -14.9 | 17.6 | -17.9 |
Palladium Futures:
 The Palladium Futures large speculator standing this week totaled a net position of -2,300 contracts in the data reported through Tuesday. This was a weekly boost of 1,281 contracts from the previous week which had a total of -3,581 net contracts.
This week’s current strength score (the trader positioning range over the past three years, measured from 0 to 100) shows the speculators are currently Bullish-Extreme with a score of 87.2 percent. The commercials are Bearish-Extreme with a score of 4.5 percent and the small traders (not shown in chart) are Bullish-Extreme with a score of 89.1 percent.
Price Trend-Following Model: Strong Uptrend
Our weekly trend-following model classifies the current market price position as: Strong Uptrend.
| Palladium Futures Statistics | SPECULATORS | COMMERCIALS | SMALL TRADERS |
| – Percent of Open Interest Longs: | 43.2 | 35.3 | 15.2 |
| – Percent of Open Interest Shorts: | 54.2 | 30.7 | 8.7 |
| – Net Position: | -2,300 | 952 | 1,348 |
| – Gross Longs: | 8,991 | 7,341 | 3,155 |
| – Gross Shorts: | 11,291 | 6,389 | 1,807 |
| – Long to Short Ratio: | 0.8 to 1 | 1.1 to 1 | 1.7 to 1 |
| NET POSITION TREND: | |||
| – Strength Index Score (3 Year Range Pct): | 87.2 | 4.5 | 89.1 |
| – Strength Index Reading (3 Year Range): | Bullish-Extreme | Bearish-Extreme | Bullish-Extreme |
| NET POSITION MOVEMENT INDEX: | |||
| – 6-Week Change in Strength Index: | 26.3 | -27.6 | 5.1 |
Steel Futures Futures:
 The Steel Futures large speculator standing this week totaled a net position of 550 contracts in the data reported through Tuesday. This was a weekly lift of 112 contracts from the previous week which had a total of 438 net contracts.
This week’s current strength score (the trader positioning range over the past three years, measured from 0 to 100) shows the speculators are currently Bullish with a score of 68.4 percent. The commercials are Bearish with a score of 31.4 percent and the small traders (not shown in chart) are Bullish with a score of 66.3 percent.
Price Trend-Following Model: Downtrend
Our weekly trend-following model classifies the current market price position as: Downtrend.
| Steel Futures Statistics | SPECULATORS | COMMERCIALS | SMALL TRADERS |
| – Percent of Open Interest Longs: | 24.7 | 69.1 | 1.7 |
| – Percent of Open Interest Shorts: | 22.7 | 72.1 | 0.8 |
| – Net Position: | 550 | -788 | 238 |
| – Gross Longs: | 6,614 | 18,476 | 459 |
| – Gross Shorts: | 6,064 | 19,264 | 221 |
| – Long to Short Ratio: | 1.1 to 1 | 1.0 to 1 | 2.1 to 1 |
| NET POSITION TREND: | |||
| – Strength Index Score (3 Year Range Pct): | 68.4 | 31.4 | 66.3 |
| – Strength Index Reading (3 Year Range): | Bullish | Bearish | Bullish |
| NET POSITION MOVEMENT INDEX: | |||
| – 6-Week Change in Strength Index: | 9.9 | -10.3 | 8.3 |
Article By InvestMacro – Receive our weekly COT Newsletter
*COT Report: The COT data, released weekly to the public each Friday, is updated through the most recent Tuesday (data is 3 days old) and shows a quick view of how large speculators or non-commercials (for-profit traders) were positioned in the futures markets.
The CFTC categorizes trader positions according to commercial hedgers (traders who use futures contracts for hedging as part of the business), non-commercials (large traders who speculate to realize trading profits) and nonreportable traders (usually small traders/speculators) as well as their open interest (contracts open in the market at time of reporting). See CFTC criteria here.