
By RoboForex Analytical Department
The price of gold fell on Monday to $3,346 per troy ounce, pausing its recent upward trend as investors assessed the implications of a phone call between the US and the EU.
Key factors driving gold’s movement
Demand for safe-haven assets weakened after US President Donald Trump announced plans to delay proposed 50% tariffs on European goods. While he had initially intended to impose the levies from 1 June, he set a new deadline of 9 July to allow time for negotiations with the European Union.
However, trade risks persist and remain a focal point for markets. Last Friday, Trump warned Apple Inc. that its products could face 25% tariffs if iPhones are manufactured outside the US.
Gold had surged nearly 5% last week amid escalating trade uncertainty and growing concerns over the US economic and fiscal outlook.
Free Reports:
 Get our Weekly Commitment of Traders Reports - See where the biggest traders (Hedge Funds and Commercial Hedgers) are positioned in the futures markets on a weekly basis.
 Sign Up for Our Stock Market Newsletter – Get updated on News, Charts & Rankings of Public Companies when you join our Stocks Newsletter
Adding to market apprehension, Trump’s new tax bill – already passed by the House of Representatives and now awaiting a Senate vote – could expand the US budget deficit by nearly $3 trillion over the next decade. A final vote is expected by August.
Technical analysis: XAU/USD
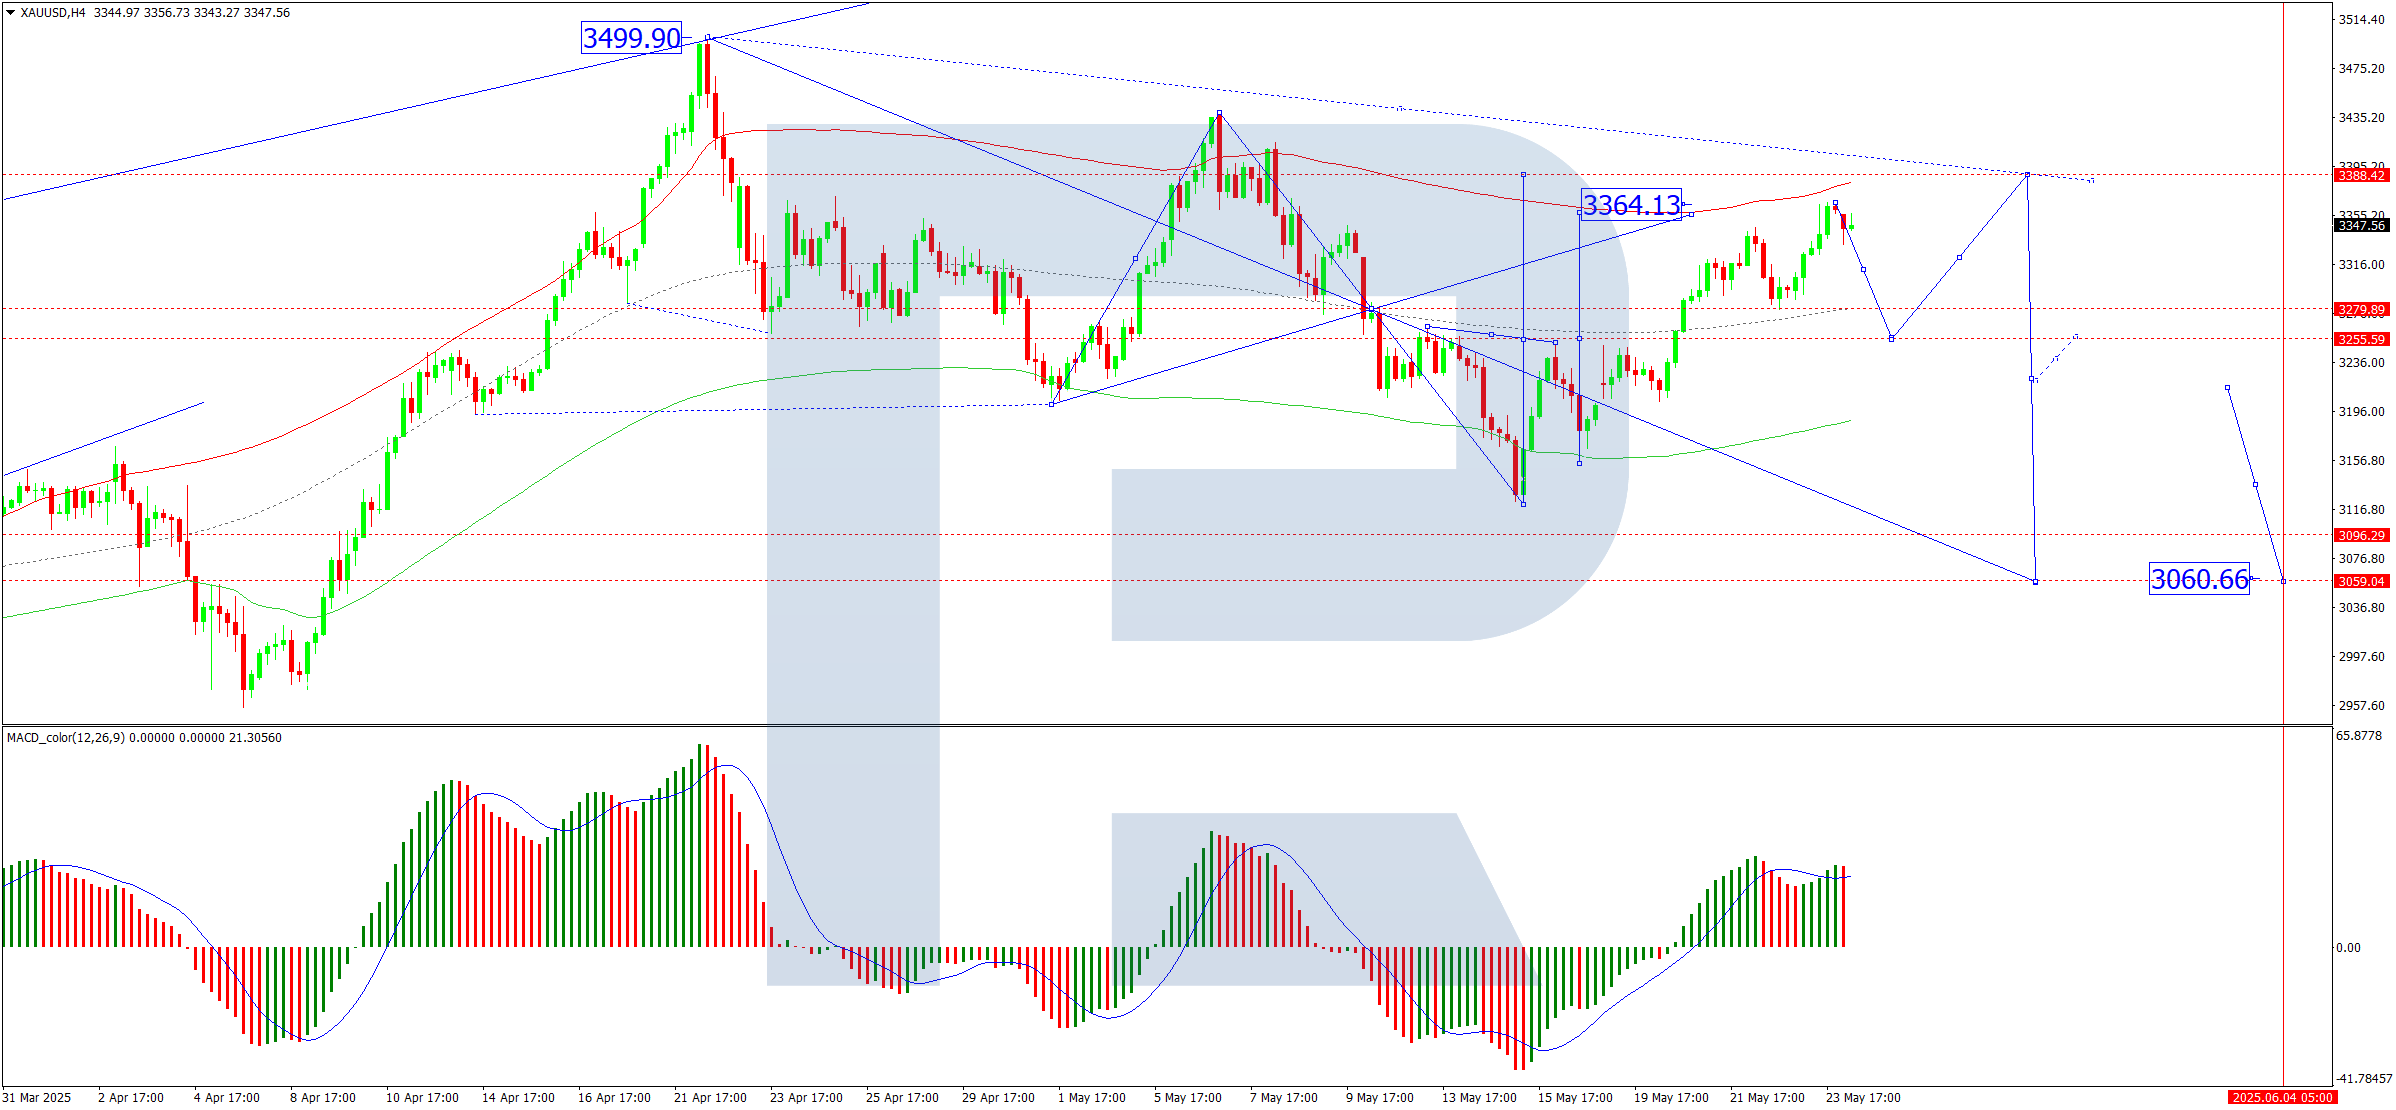
On the H4 chart, XAU/USD found support at 3,280 before rallying to 3,364. A corrective pullback towards 3,255 is possible today, followed by a potential upward move to 3,388. This scenario is supported by the MACD indicator, whose signal line has exited the histogram zone and is now pointing decisively downward.
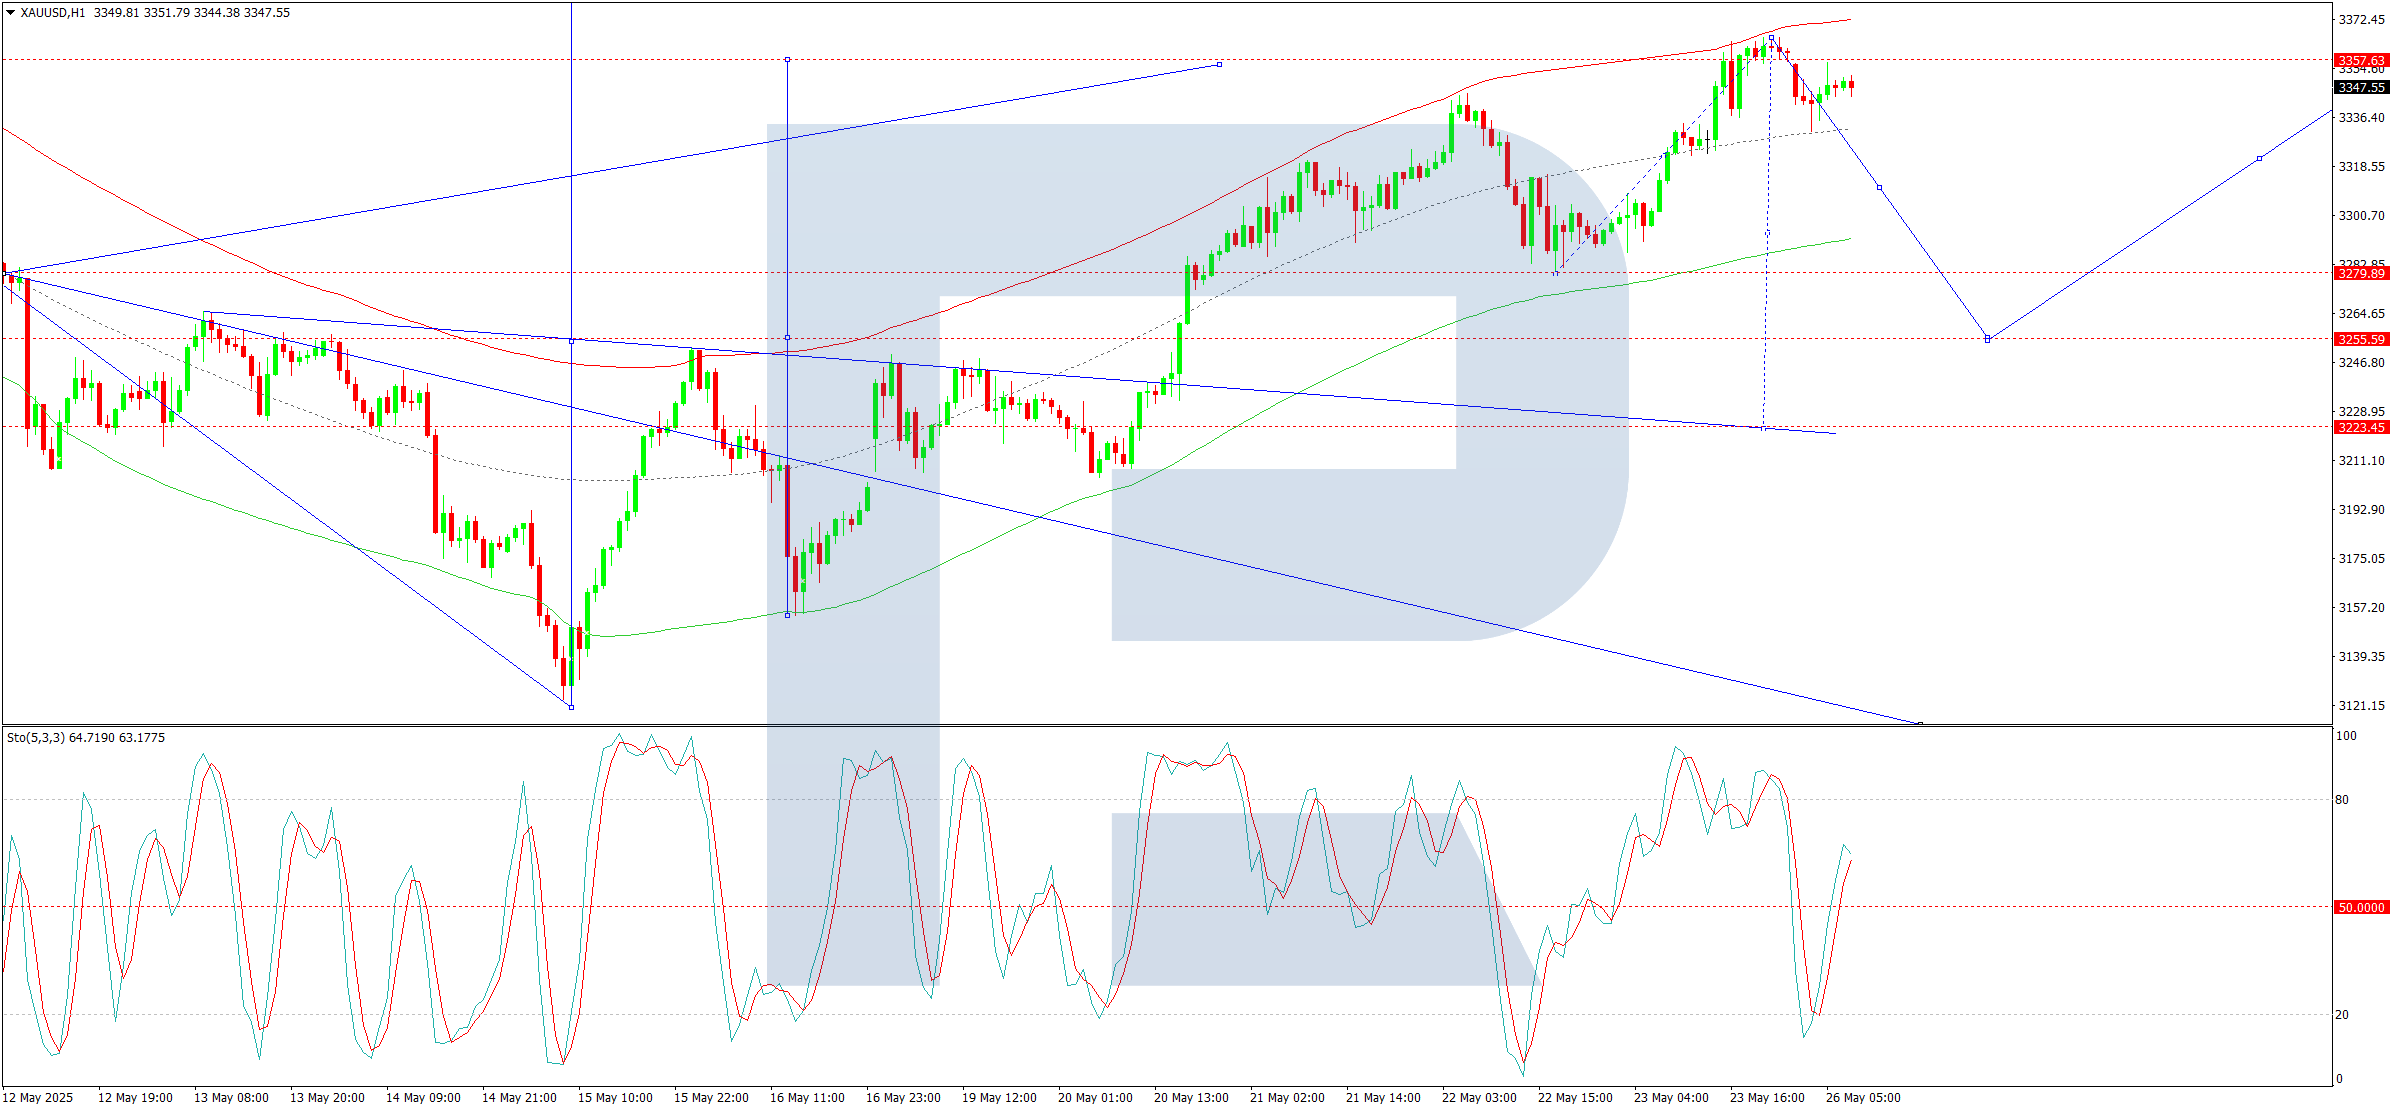
On the H1 chart, the market has completed its local corrective target. A further decline to at least 3,255 is anticipated today, after which another upward wave may develop towards 3,388. Bullish momentum would likely be exhausted at that point, with the entire rally regarded as a correction within the broader downtrend. Once this correction concludes, a resumption of the downtrend may follow, with a potential decline to 3,222 and an eventual extension towards 3,060. This bearish outlook is corroborated by the Stochastic oscillator, whose signal line has dipped below 80 and is trending sharply downward towards 20.
Conclusion
Gold’s rally has stalled as markets digest shifting US-EU trade dynamics, though lingering risks and technical indicators suggest further volatility ahead.
Disclaimer
Any forecasts contained herein are based on the author’s particular opinion. This analysis may not be treated as trading advice. RoboForex bears no responsibility for trading results based on trading recommendations and reviews contained herein.

- This week will be one of the most crowded for central‑bank meetings Jul 27, 2026
- EUR/USD Ahead of a Key Week: Holding Near Lows Jul 27, 2026
- COT Metals Charts: Weekly Speculator Changes led by Copper Jul 26, 2026
- COT Bonds Charts: Speculator Bets led by SOFR 3-Months & 5-Year Bonds Jul 26, 2026
- COT Energy Charts: Weekly Speculator Bets led by WTI Crude & Natural Gas Jul 26, 2026
- COT Soft Commodities Charts: Weekly Speculator Bets led by Corn & Soybeans Jul 26, 2026
- The US introduces new import tariffs for 60 countries. Brent crude surpasses $100 per barrel Jul 24, 2026
- USD/JPY Breaks Records: Nothing Slows the Yen’s Decline Jul 24, 2026
- Oil prices reached a 6‑week high. The AUD strengthened on the back of a strong labor‑market report Jul 23, 2026
- EUR/USD Recovers as Dollar Weakens Jul 23, 2026