By ForexTime
(Note: This report was published before the US NFP report on Friday afternoon.)
- GBPUSD ↓ 3.8% in July – worst month in 2025
- BoE expected to cut rates by 25bp on Thursday
- BoE meeting forecast to move GBPUSD ↑ 0.5% & ↓ 0.4%
- US economic data could trigger additional volatility
- Bloomberg FX model: GBPUSD has 74% of trading within 1.2990 – 1.3308 over 1-week period
Even as the clock ticks down to the key US jobs report this afternoon (Friday 1st August), investors are bracing for more action in the week ahead.
Trump has injected a fresh dose of uncertainty into markets after signing an executive order reimposing reciprocal tariffs of 10% to 41% on dozens of countries.
Considering how these come into effect from August 7th, this could mean more volatility for a week already packed with key data and corporate earnings:
Sunday, 3rd August
- OIL: OPEC+ meeting on production levels
Monday, 4th August
- US500: US factory orders, durable goods
Tuesday, 5th August
- CN50: China S&P Global services PMI
- EU50: Eurozone PPI, HCOB services PMI
- JP225: Japan BOJ meeting minutes
- US500: US trade, ISM services, S&P Global services PMI
- UK00: BP earnings
Wednesday, 6th August
- EUR: Eurozone retail sales
- GER40: Germany factory orders
- TWN: Taiwan CPI
- US30: Disney earnings
Thursday, 7th August
- AUD: Australia trade
- CN50: China trade, foreign reserves
- GER40: Germany industrial production
- GBP: BoE rate decision
- USDInd: US initial jobless claims, Atlanta Fed President Raphael Bostic speech
- Trump’s updated tariffs come into effect
Friday, 8th August
- CAD: Canada unemployment
- JP225: Japan household spending, trade, current account
- TWN: Taiwan trade
Our focus lands on the GBPUSD which ended July almost 4% lower – its worst trading month in 2025.
A strengthening dollar has hammered the major currency pair, with prices approaching levels not seen since mid-May.
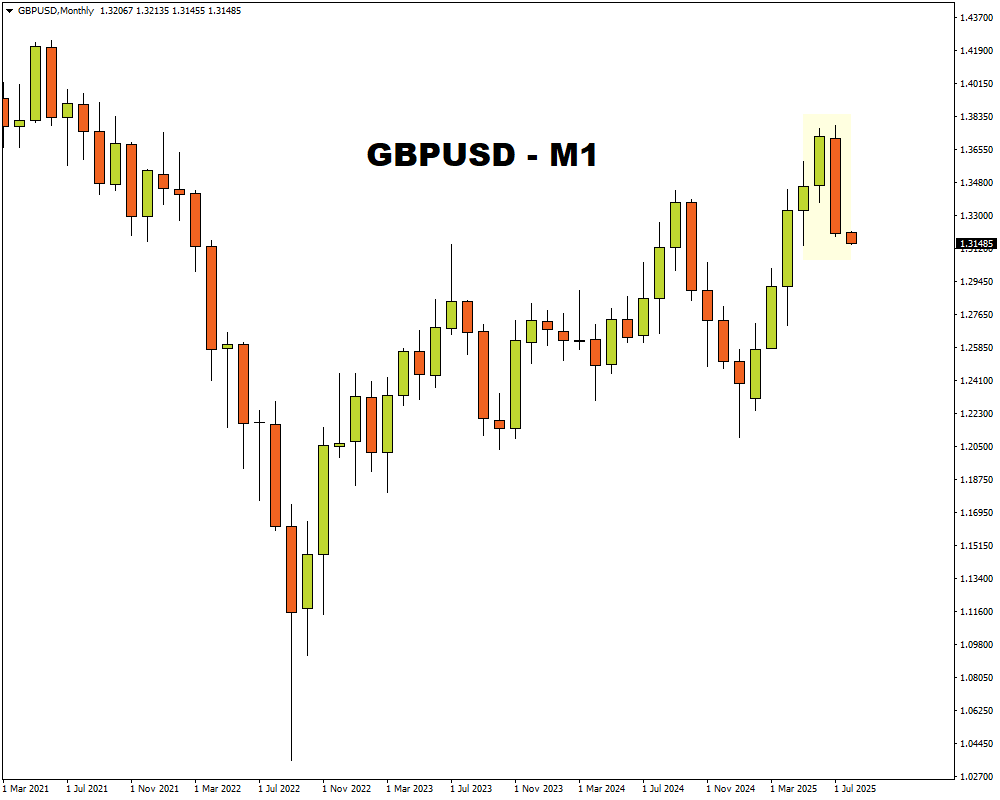
(Note: This chart was published before the US NFP report on Friday afternoon.)
With bears in a position of power, further downside could be expected with the right fundamental catalyst.
Here are 3 factors to watch out for:
1) BoE rate decision
The Bank of England (BoE) is expected to cut interest rates again at its August meeting to 4% from 4.25%.
However, the central bank may adopt a cautious stance on future rate cuts given how inflation surprised to the upside in June. Still, concerns over the labour market may encourage policymakers to lower rates deeper into the year.
Note: The latest UK CPI report increased to 3.6% in June, up from 3.4% in May.
Traders are currently pricing in a 95% probability that the BoE cuts rates in August with the odds of another rate cut by November at 63%.
- The GBPUSD may extend losses if the BoE cuts interest rates and signals lower rates in the second half of 2025.
- Should BoE governor Bailey express caution over future cuts, this may support the GBPUSD.
GBPUSD is forecasted to move 0.5% up or down 0.4% in a 6-hour window after the BoE rate decision.
2) US data
More economic data from the world’s largest economy may impact bets on a Fed cut and the US dollar. Recently, confidence toward the US economy was boosted by the stronger-than-expected Q2 GDP figures. More encouraging data could lift sentiment, cool Fed cut bets, and support the USD.
On Tuesday, the latest US ISM services and PMI’s will be published, followed by the initial jobless claims on Thursday.
- A strong set of figures may boost the dollar, dragging the GBPUSD lower as a result.
- Weaker-than-expected data may hit the dollar, pushing the GBPUSD higher as a result.
3) Technical forces
GBPUSD is under intense pressure on the daily charts with prices trading below the 50 and 100-day SMA’s. However, the Relative Strength Index (RSI) shows that prices are heavily oversold.
- A solid weekly close under 1.3200 may encourage a decline toward 1.3070 and the 200-day SMA at 1.2990, which is also the lower bound of the Bloomberg FX model.
- Should prices push back above 1.3200, this could trigger a move toward 1.3285 and 1.3308 – the upper bound of the Bloomberg FX model.
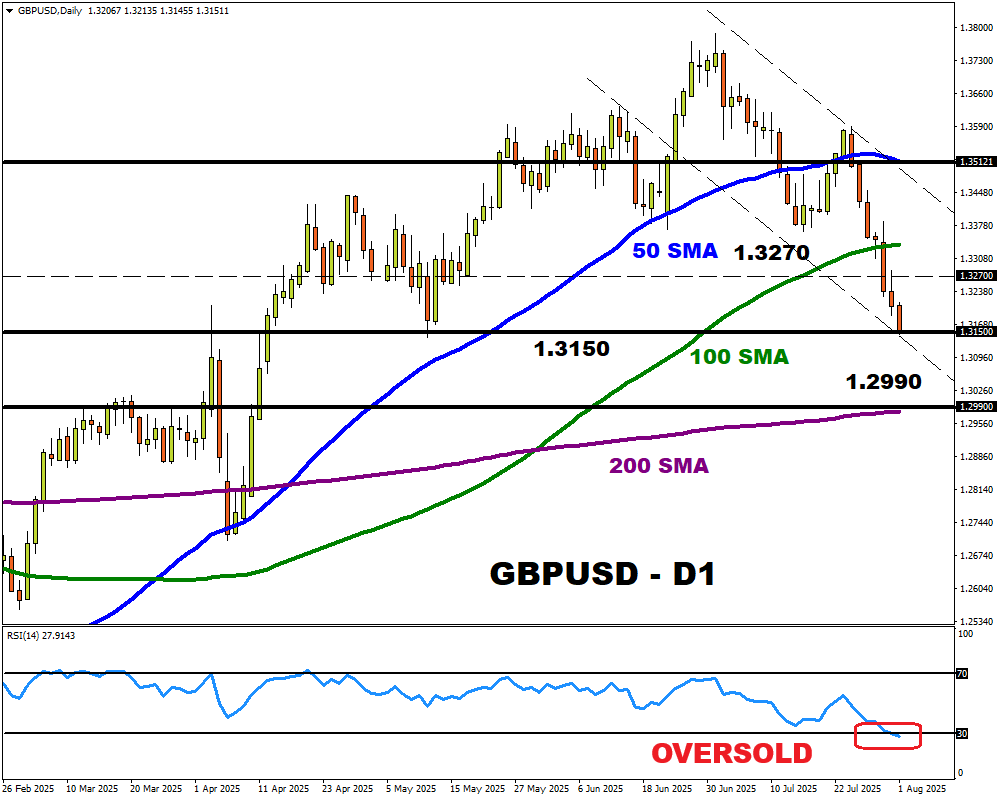
Bloomberg’s FX model forecasts a 74% chance that GBPUSD will trade within the 1.2990 – 1.3308 range, using current levels as a base, over the next one-week period.
![]() Article by ForexTime
Article by ForexTime
ForexTime Ltd (FXTM) is an award winning international online forex broker regulated by CySEC 185/12 www.forextime.com