Archive for Financial News – Page 314

COT Week 30 Charts: Stock Market Speculator bets lower as S&P500 positions drop

By InvestMacro | COT | Data Tables | COT Leaders | Downloads | COT Newsletter
Here are the latest charts and statistics for the Commitment of Traders (COT) data published by the Commodities Futures Trading Commission (CFTC).

The latest COT data is updated through Tuesday July 26th and shows a quick view of how large traders (for-profit speculators and commercial entities) were positioned in the futures markets.

Weekly Speculator Changes

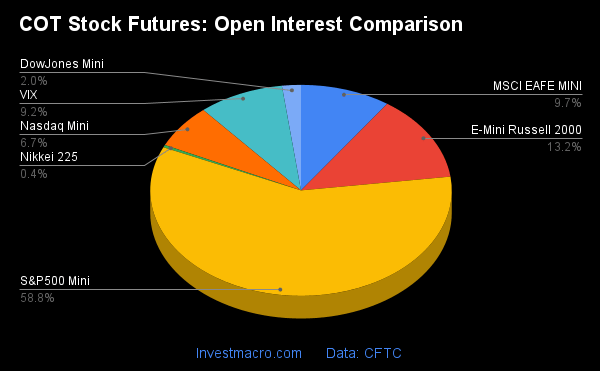
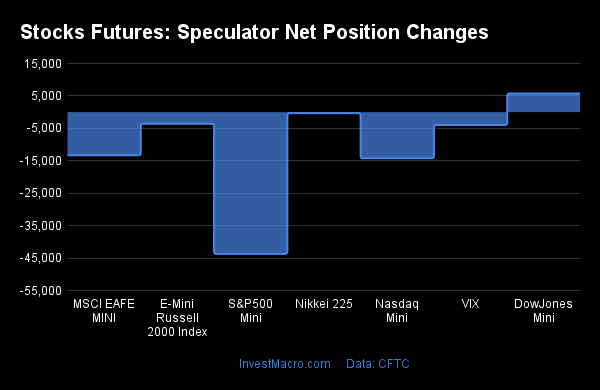
COT stock market speculator bets were mostly lower this week as just two out of the seven stock markets we cover had higher positioning this week while the other five markets had lower contracts.

Leading the gains for the stock markets was the MSCI EAFE Mini (8,866 contracts) with the Nasdaq Mini (3,692 contracts) also showing a positive week.

The stock markets leading the declines in speculator bets this week were the S&P500 Mini (-29,487 contracts) and the VIX (-22,665 contracts) with the Dow Jones Mini (-5,348 contracts), Russell 2000 Mini (-4,522 contracts) and Nikkei 225 USD (-1,263 contracts) also registering lower bets on the week.
Highlighting the stock markets COT data this week was the continued drop in speculator bets for the S&P500 mini contracts. The SP500 mini spec positions declined for the fifth time in the past six weeks and have now seen a total of -271,913 contracts fall off the net position since June 14th (when the net position was at a total of +34,278 contracts). The current standing for speculators this week is a total of -237,635 contracts. This marks the lowest level since June 16th of 2020 which was shortly after global markets were rocked by the onset of the Covid-19 pandemic.


Data Snapshot of Stock Market Traders | Columns Legend
Jul-26-2022OIOI-IndexSpec-NetSpec-IndexCom-NetCOM-IndexSmalls-NetSmalls-Index
S&P500-Mini2,322,8249-237,63512290,090100-52,45515
Nikkei 22513,5458-4,390573,6844870637
Nasdaq-Mini267,1585231,80993-25,47311-6,33635
DowJones-Mini73,28832-21,185927,10696-5,9217
VIX300,87027-92,5656399,52438-6,95958
Nikkei 225 Yen58,458416,1895322,27883-28,46716


Strength Scores

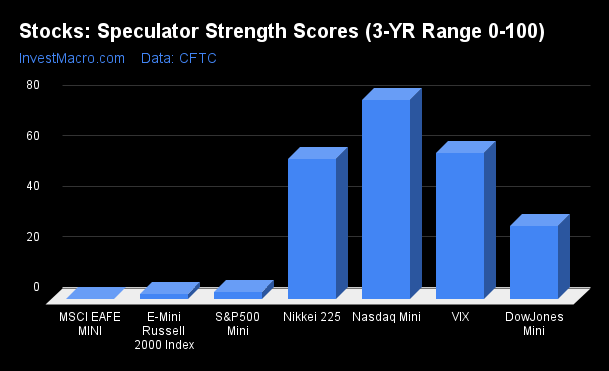
Strength Scores (a normalized measure of Speculator positions over a 3-Year range, from 0 to 100 where above 80 is extreme bullish and below 20 is extreme bearish) show that the Nasdaq-Mini (92.8 percent) continues to lead the stock markets and is in a bullish extreme position (above 80 percent). The VIX (62.9 percent) and the Nikkei USD (56.6 percent) come in as the next highest stocks markets in strength scores. On the downside, the Russell2000-Mini (7.6 percent) comes in at the lowest strength level currently and is followed by the DowJones-Mini (9.4 percent), the S&P500-Mini (12.2 percent) and the EAFE-Mini (18.6 percent). These four markets are all in extreme bearish readings.


Strength Statistics:
VIX (62.9 percent) vs VIX previous week (74.2 percent)
S&P500-Mini (12.2 percent) vs S&P500-Mini previous week (17.6 percent)
DowJones-Mini (9.4 percent) vs DowJones-Mini previous week (16.1 percent)
Nasdaq-Mini (92.8 percent) vs Nasdaq-Mini previous week (90.7 percent)
Russell2000-Mini (7.6 percent) vs Russell2000-Mini previous week (10.1 percent)
Nikkei USD (56.6 percent) vs Nikkei USD previous week (62.6 percent)
EAFE-Mini (18.6 percent) vs EAFE-Mini previous week (8.5 percent)

Strength Trends

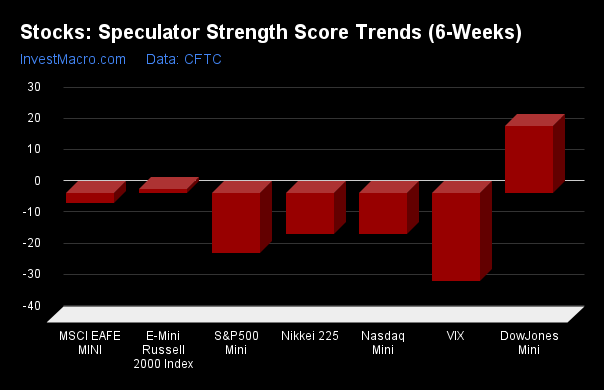
Strength Score Trends (or move index, calculates the 6-week changes in strength scores) show that the Nasdaq-Mini (1.9 percent) and the DowJones-Mini (1.4 percent) leads the past six weeks trends for stocks this week. These two markets are the only markets currently with positive six-week scores. The S&P500-Mini (-50.4 percent) leads the downside trend scores currently while the next market with lower trend scores was the EAFE-Mini (-24.8 percent).


Strength Trend Statistics:
VIX (-9.2 percent) vs VIX previous week (-6.3 percent)
S&P500-Mini (-50.4 percent) vs S&P500-Mini previous week (-35.4 percent)
DowJones-Mini (1.4 percent) vs DowJones-Mini previous week (5.7 percent)
Nasdaq-Mini (1.9 percent) vs Nasdaq-Mini previous week (6.2 percent)
Russell2000-Mini (-5.6 percent) vs Russell2000-Mini previous week (-15.3 percent)
Nikkei USD (-9.4 percent) vs Nikkei USD previous week (-21.8 percent)
EAFE-Mini (-24.8 percent) vs EAFE-Mini previous week (-30.9 percent)


Individual Markets:

VIX Volatility Futures:

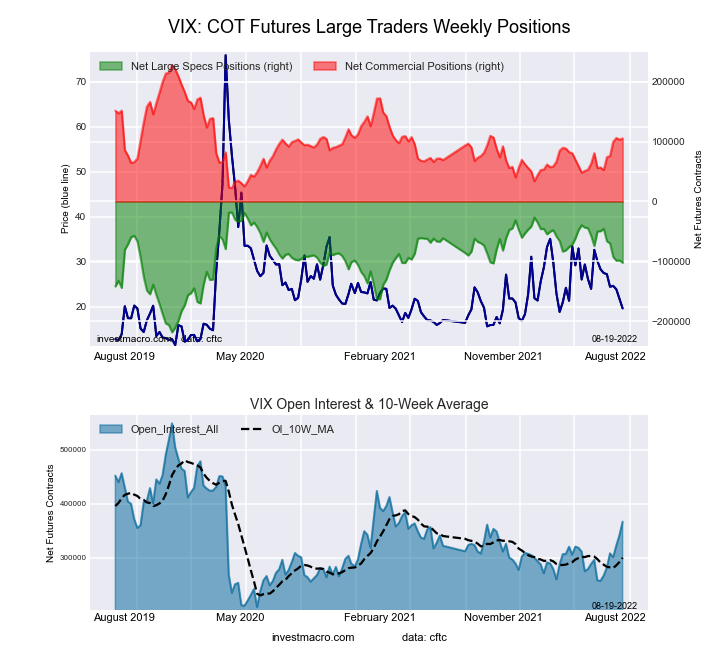
VIX Volatility Futures COT ChartThe VIX Volatility large speculator standing this week recorded a net position of -92,565 contracts in the data reported through Tuesday. This was a weekly reduction of -22,665 contracts from the previous week which had a total of -69,900 net contracts.

This week’s current strength score (the trader positioning range over the past three years, measured from 0 to 100) shows the speculators are currently Bullish with a score of 62.9 percent. The commercials are Bearish with a score of 37.6 percent and the small traders (not shown in chart) are Bullish with a score of 57.6 percent.

VIX Volatility Futures StatisticsSPECULATORSCOMMERCIALSSMALL TRADERS
– Percent of Open Interest Longs:11.862.38.0
– Percent of Open Interest Shorts:42.629.210.3
– Net Position:-92,56599,524-6,959
– Gross Longs:35,596187,50823,954
– Gross Shorts:128,16187,98430,913
– Long to Short Ratio:0.3 to 12.1 to 10.8 to 1
NET POSITION TREND:
– Strength Index Score (3 Year Range Pct):62.937.657.6
– Strength Index Reading (3 Year Range):BullishBearishBullish
NET POSITION MOVEMENT INDEX:
– 6-Week Change in Strength Index:-9.29.2-2.6


S&P500 Mini Futures:

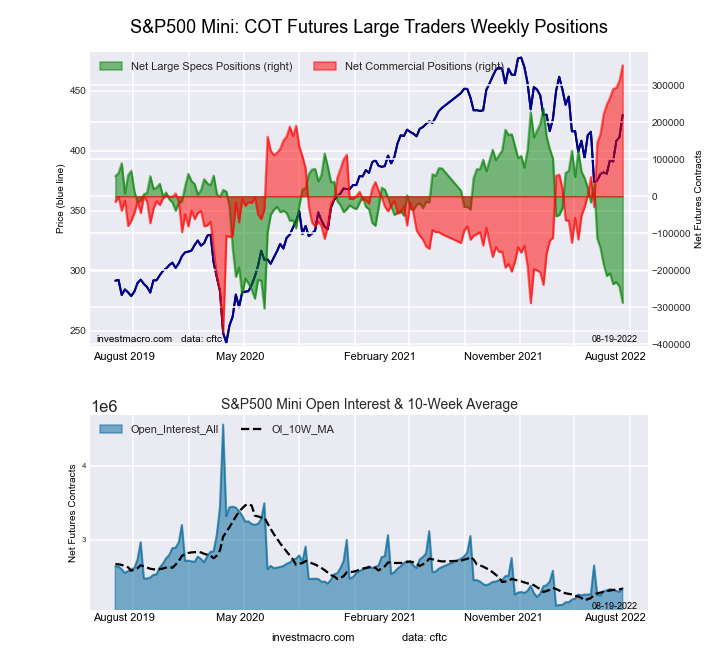
SP500 Mini Futures COT ChartThe S&P500 Mini large speculator standing this week recorded a net position of -237,635 contracts in the data reported through Tuesday. This was a weekly decline of -29,487 contracts from the previous week which had a total of -208,148 net contracts.

This week’s current strength score (the trader positioning range over the past three years, measured from 0 to 100) shows the speculators are currently Bearish-Extreme with a score of 12.2 percent. The commercials are Bullish-Extreme with a score of 100.0 percent and the small traders (not shown in chart) are Bearish-Extreme with a score of 15.4 percent.

S&P500 Mini Futures StatisticsSPECULATORSCOMMERCIALSSMALL TRADERS
– Percent of Open Interest Longs:10.477.39.5
– Percent of Open Interest Shorts:20.664.811.8
– Net Position:-237,635290,090-52,455
– Gross Longs:240,6421,795,164221,627
– Gross Shorts:478,2771,505,074274,082
– Long to Short Ratio:0.5 to 11.2 to 10.8 to 1
NET POSITION TREND:
– Strength Index Score (3 Year Range Pct):12.2100.015.4
– Strength Index Reading (3 Year Range):Bearish-ExtremeBullish-ExtremeBearish-Extreme
NET POSITION MOVEMENT INDEX:
– 6-Week Change in Strength Index:-50.448.5-9.9


Dow Jones Mini Futures:

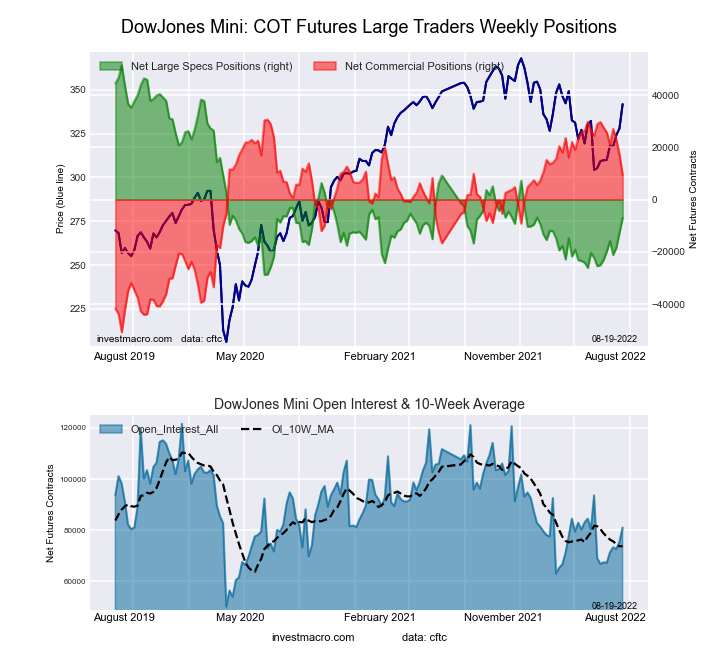
Dow Jones Mini Futures COT ChartThe Dow Jones Mini large speculator standing this week recorded a net position of -21,185 contracts in the data reported through Tuesday. This was a weekly reduction of -5,348 contracts from the previous week which had a total of -15,837 net contracts.

This week’s current strength score (the trader positioning range over the past three years, measured from 0 to 100) shows the speculators are currently Bearish-Extreme with a score of 9.4 percent. The commercials are Bullish-Extreme with a score of 95.7 percent and the small traders (not shown in chart) are Bearish-Extreme with a score of 6.8 percent.

Dow Jones Mini Futures StatisticsSPECULATORSCOMMERCIALSSMALL TRADERS
– Percent of Open Interest Longs:21.864.013.7
– Percent of Open Interest Shorts:50.727.021.8
– Net Position:-21,18527,106-5,921
– Gross Longs:15,95546,90310,025
– Gross Shorts:37,14019,79715,946
– Long to Short Ratio:0.4 to 12.4 to 10.6 to 1
NET POSITION TREND:
– Strength Index Score (3 Year Range Pct):9.495.76.8
– Strength Index Reading (3 Year Range):Bearish-ExtremeBullish-ExtremeBearish-Extreme
NET POSITION MOVEMENT INDEX:
– 6-Week Change in Strength Index:1.43.3-20.2


Nasdaq Mini Futures:

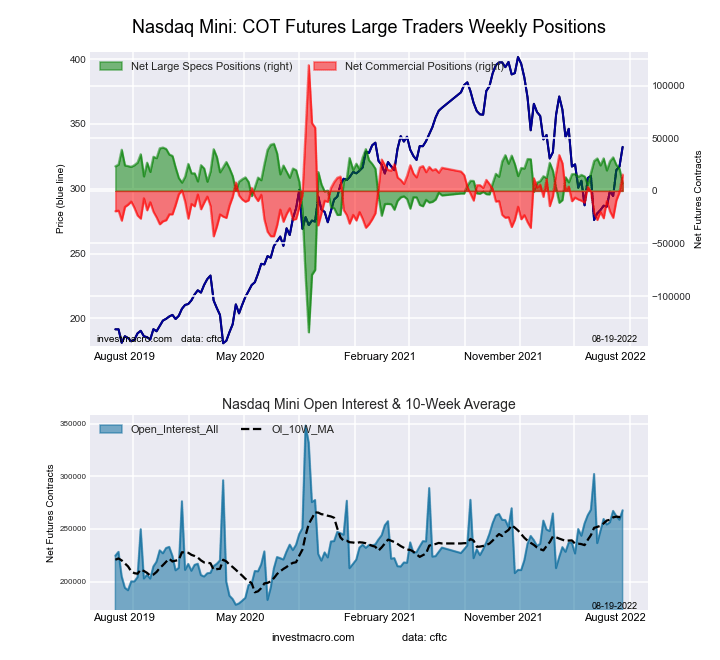
Nasdaq Mini Futures COT ChartThe Nasdaq Mini large speculator standing this week recorded a net position of 31,809 contracts in the data reported through Tuesday. This was a weekly boost of 3,692 contracts from the previous week which had a total of 28,117 net contracts.

This week’s current strength score (the trader positioning range over the past three years, measured from 0 to 100) shows the speculators are currently Bullish-Extreme with a score of 92.8 percent. The commercials are Bearish-Extreme with a score of 10.8 percent and the small traders (not shown in chart) are Bearish with a score of 35.5 percent.

Nasdaq Mini Futures StatisticsSPECULATORSCOMMERCIALSSMALL TRADERS
– Percent of Open Interest Longs:31.353.312.7
– Percent of Open Interest Shorts:19.362.915.1
– Net Position:31,809-25,473-6,336
– Gross Longs:83,491142,52033,962
– Gross Shorts:51,682167,99340,298
– Long to Short Ratio:1.6 to 10.8 to 10.8 to 1
NET POSITION TREND:
– Strength Index Score (3 Year Range Pct):92.810.835.5
– Strength Index Reading (3 Year Range):Bullish-ExtremeBearish-ExtremeBearish
NET POSITION MOVEMENT INDEX:
– 6-Week Change in Strength Index:1.9-2.82.3


Russell 2000 Mini Futures:

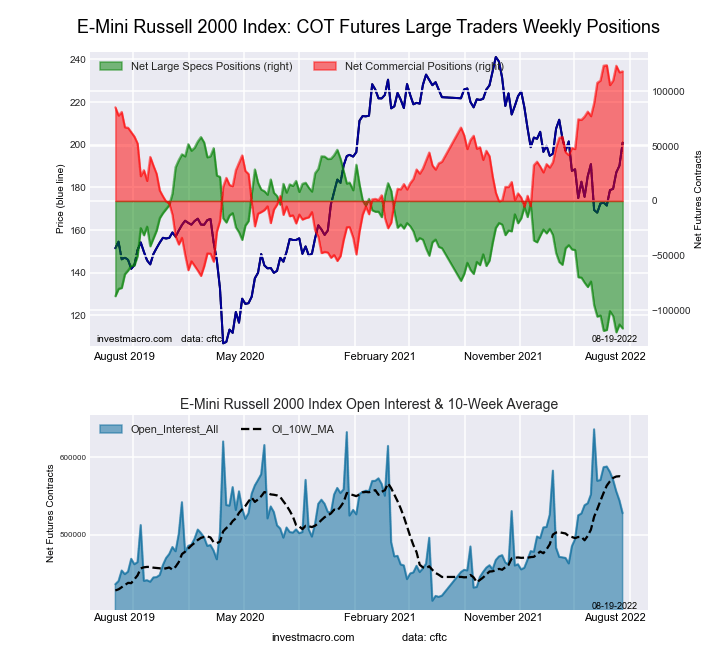
Russell 2000 Mini Futures COT ChartThe Russell 2000 Mini large speculator standing this week recorded a net position of -105,211 contracts in the data reported through Tuesday. This was a weekly fall of -4,522 contracts from the previous week which had a total of -100,689 net contracts.

This week’s current strength score (the trader positioning range over the past three years, measured from 0 to 100) shows the speculators are currently Bearish-Extreme with a score of 7.6 percent. The commercials are Bullish-Extreme with a score of 92.7 percent and the small traders (not shown in chart) are Bearish-Extreme with a score of 12.7 percent.

Russell 2000 Mini Futures StatisticsSPECULATORSCOMMERCIALSSMALL TRADERS
– Percent of Open Interest Longs:7.488.03.5
– Percent of Open Interest Shorts:25.868.84.3
– Net Position:-105,211110,009-4,798
– Gross Longs:42,107502,43419,764
– Gross Shorts:147,318392,42524,562
– Long to Short Ratio:0.3 to 11.3 to 10.8 to 1
NET POSITION TREND:
– Strength Index Score (3 Year Range Pct):7.692.712.7
– Strength Index Reading (3 Year Range):Bearish-ExtremeBullish-ExtremeBearish-Extreme
NET POSITION MOVEMENT INDEX:
– 6-Week Change in Strength Index:-5.610.7-32.8


Nikkei Stock Average (USD) Futures:

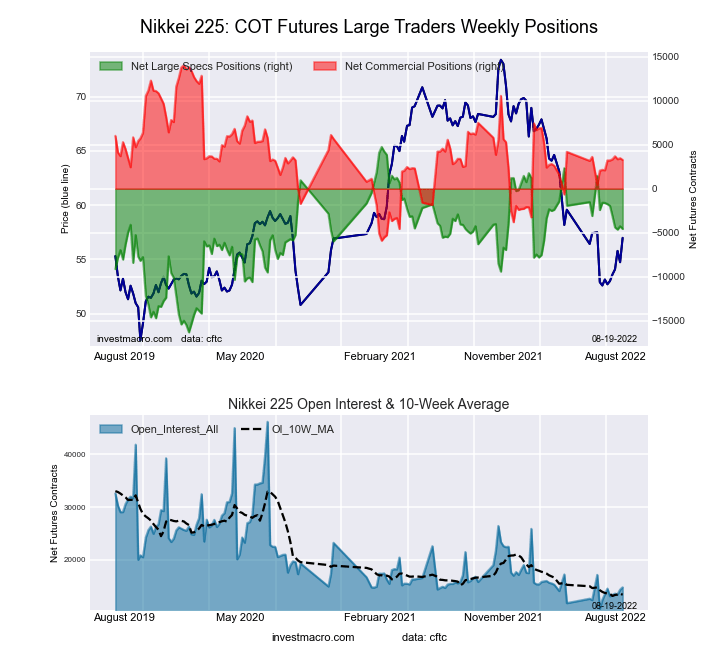
Nikkei Stock Average (USD) Futures COT ChartThe Nikkei Stock Average (USD) large speculator standing this week recorded a net position of -4,390 contracts in the data reported through Tuesday. This was a weekly fall of -1,263 contracts from the previous week which had a total of -3,127 net contracts.

This week’s current strength score (the trader positioning range over the past three years, measured from 0 to 100) shows the speculators are currently Bullish with a score of 56.6 percent. The commercials are Bearish with a score of 48.1 percent and the small traders (not shown in chart) are Bearish with a score of 37.2 percent.

Nikkei Stock Average Futures StatisticsSPECULATORSCOMMERCIALSSMALL TRADERS
– Percent of Open Interest Longs:10.960.628.3
– Percent of Open Interest Shorts:43.333.423.1
– Net Position:-4,3903,684706
– Gross Longs:1,4788,2043,832
– Gross Shorts:5,8684,5203,126
– Long to Short Ratio:0.3 to 11.8 to 11.2 to 1
NET POSITION TREND:
– Strength Index Score (3 Year Range Pct):56.648.137.2
– Strength Index Reading (3 Year Range):BullishBearishBearish
NET POSITION MOVEMENT INDEX:
– 6-Week Change in Strength Index:-9.48.24.3


MSCI EAFE Mini Futures:

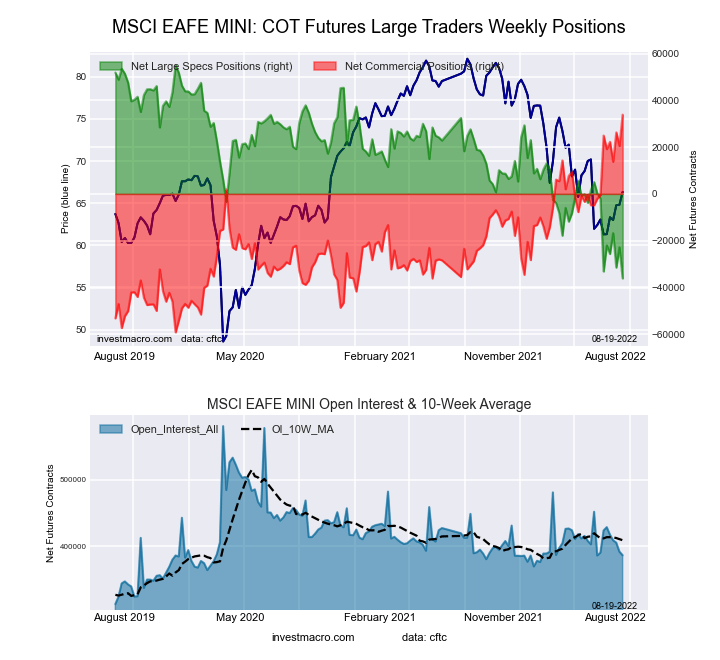
MSCI EAFE Mini Futures COT ChartThe MSCI EAFE Mini large speculator standing this week recorded a net position of -16,807 contracts in the data reported through Tuesday. This was a weekly increase of 8,866 contracts from the previous week which had a total of -25,673 net contracts.

This week’s current strength score (the trader positioning range over the past three years, measured from 0 to 100) shows the speculators are currently Bearish-Extreme with a score of 18.6 percent. The commercials are Bullish-Extreme with a score of 86.7 percent and the small traders (not shown in chart) are Bearish with a score of 45.6 percent.

MSCI EAFE Mini Futures StatisticsSPECULATORSCOMMERCIALSSMALL TRADERS
– Percent of Open Interest Longs:5.191.92.1
– Percent of Open Interest Shorts:9.288.51.4
– Net Position:-16,80713,7553,052
– Gross Longs:20,928376,0158,694
– Gross Shorts:37,735362,2605,642
– Long to Short Ratio:0.6 to 11.0 to 11.5 to 1
NET POSITION TREND:
– Strength Index Score (3 Year Range Pct):18.686.745.6
– Strength Index Reading (3 Year Range):Bearish-ExtremeBullish-ExtremeBearish
NET POSITION MOVEMENT INDEX:
– 6-Week Change in Strength Index:-24.822.128.3


Article By InvestMacroReceive our weekly COT Reports by Email

*COT Report: The COT data, released weekly to the public each Friday, is updated through the most recent Tuesday (data is 3 days old) and shows a quick view of how large speculators or non-commercials (for-profit traders) were positioned in the futures markets.

The CFTC categorizes trader positions according to commercial hedgers (traders who use futures contracts for hedging as part of the business), non-commercials (large traders who speculate to realize trading profits) and nonreportable traders (usually small traders/speculators) as well as their open interest (contracts open in the market at time of reporting).See CFTC criteria here.

Aluminum, Copper, Zinc: The 3 Horsemen of the Upcoming “Econocalypse”

This suggests “a burgeoning slowdown in economic activity”

By Elliott Wave International

It may seem strange to bring up deflation when surveys show that inflation is the public’s number one worry.

But who would have thought that inflation would become a big issue, say, just two years ago?

Right — a relatively small percentage of people. The point is: Things can unexpectedly change — fast.

Consider the price of commodities: The Goldman Sachs Spot Commodity Index hit a high on March 8, and so did the Bloomberg Commodity Index. Crude oil futures made an intraday high on March 7 and a closing high on March 8. Platinum reached a closing high on March 7.

The July Global Market Perspective, a monthly Elliott Wave International publication which covers 50-plus worldwide financial markets, mentioned other commodities which also made highs during the same time as it showed this chart and said:

Aluminum, copper and zinc topped [on March 7], as did nickel and lead. The significant price declines since March 7-8 suggest a burgeoning slowdown in world economic activity and may mark a tipping point from inflationary pressures to deflationary ones.

So, you see why deflation is not such a far-fetched notion after all.

Indeed, at least a couple of other factors point to “a burgeoning slowdown in world economic activity.”

The first is widespread layoffs. Just a few months ago, technology companies were on a major hiring spree, which is in stark contrast from what’s going on now (Marketwatch, June 21):

From Great Resignation to Forced Resignation: Tech companies are shifting to layoffs after a huge ramp up in hiring

Layoffs have also been notable in cryptocurrency and real estate companies.

Another indication of a global economic slowdown can be summed up in this headline from FreightWaves, a supply chain industry information company (June 7):

US Import Demand is Dropping Off a Cliff

U.S. containerized imports from all countries declined 36% year-over-year.

Getting back to commodities, the Elliott wave model can help you determine “what’s next” with a high degree of confidence.

While no analytical method can see into the future, Elliott waves do reflect the repetitive patterns of investor psychology. Here’s what Frost & Prechter said in their Wall Street classic, Elliott Wave Principle: Key to Market Behavior:

The Wave Principle is governed by man’s social nature, and since he has such a nature, its expression generates forms. As the forms are repetitive, they have predictive value.

You can access the entire online version of the book for free once you become a member of Club EWI — the world’s largest Elliott wave educational community (about 500,000 worldwide members and growing).

A Club EWI membership is also free and opens the door to complimentary access to a wealth of Elliott wave resources on financial markets, investing and trading.

Click the link to get started right away: Elliott Wave Principle: Key to Market Behaviorget instant and free access.

This article was syndicated by Elliott Wave International and was originally published under the headline Aluminum, Copper, Zinc: The 3 Horsemen of the Upcoming “Econocalypse”. EWI is the world’s largest market forecasting firm. Its staff of full-time analysts led by Chartered Market Technician Robert Prechter provides 24-hour-a-day market analysis to institutional and private investors around the world.

Forex Technical Analysis & Forecast 29.07.2022

Article By RoboForex.com

EURUSD, “Euro vs US Dollar”

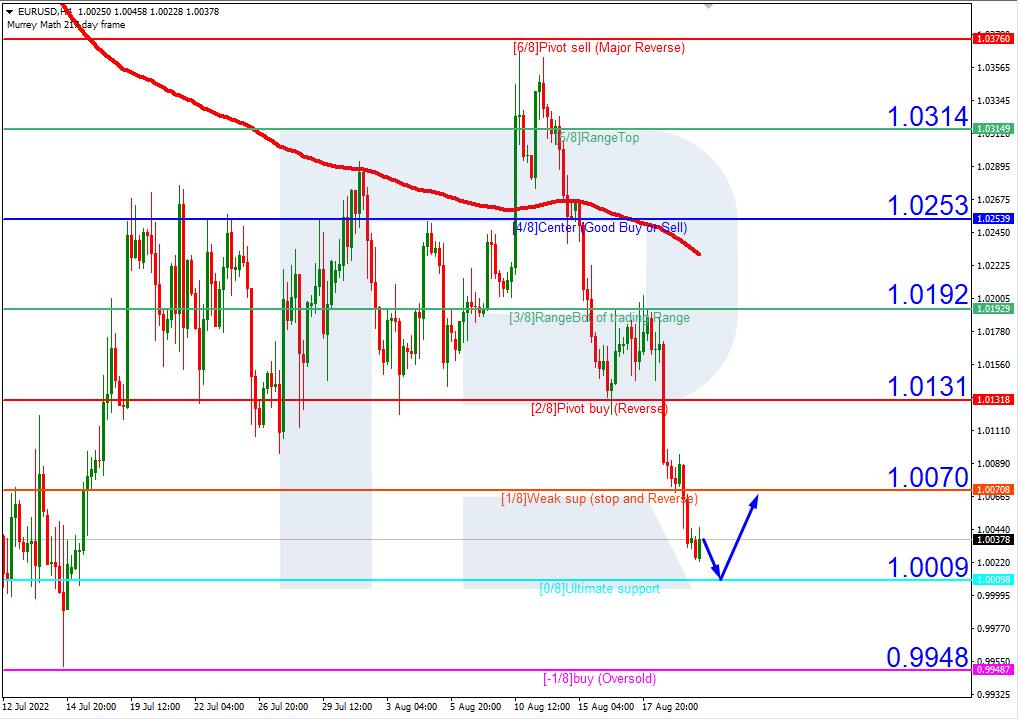
Having completed the ascending wave at 1.0222, EURUSD is trading close to the bearish channel’s upside border. Possibly, today the pair may fall towards 1.0077 and then form a new consolidation range around 1.0177.

EURUSD
Risk Warning: the result of previous trading operations do not guarantee the same results in the future

GBPUSD, “Great Britain Pound vs US Dollar”

GBPUSD continue growing towards 1.2227 and may later fall to break 1.2100 and then continue trading downwards with the target at 1.1963.

GBPUSD
Risk Warning: the result of previous trading operations do not guarantee the same results in the future

USDJPY, “US Dollar vs Japanese Yen”

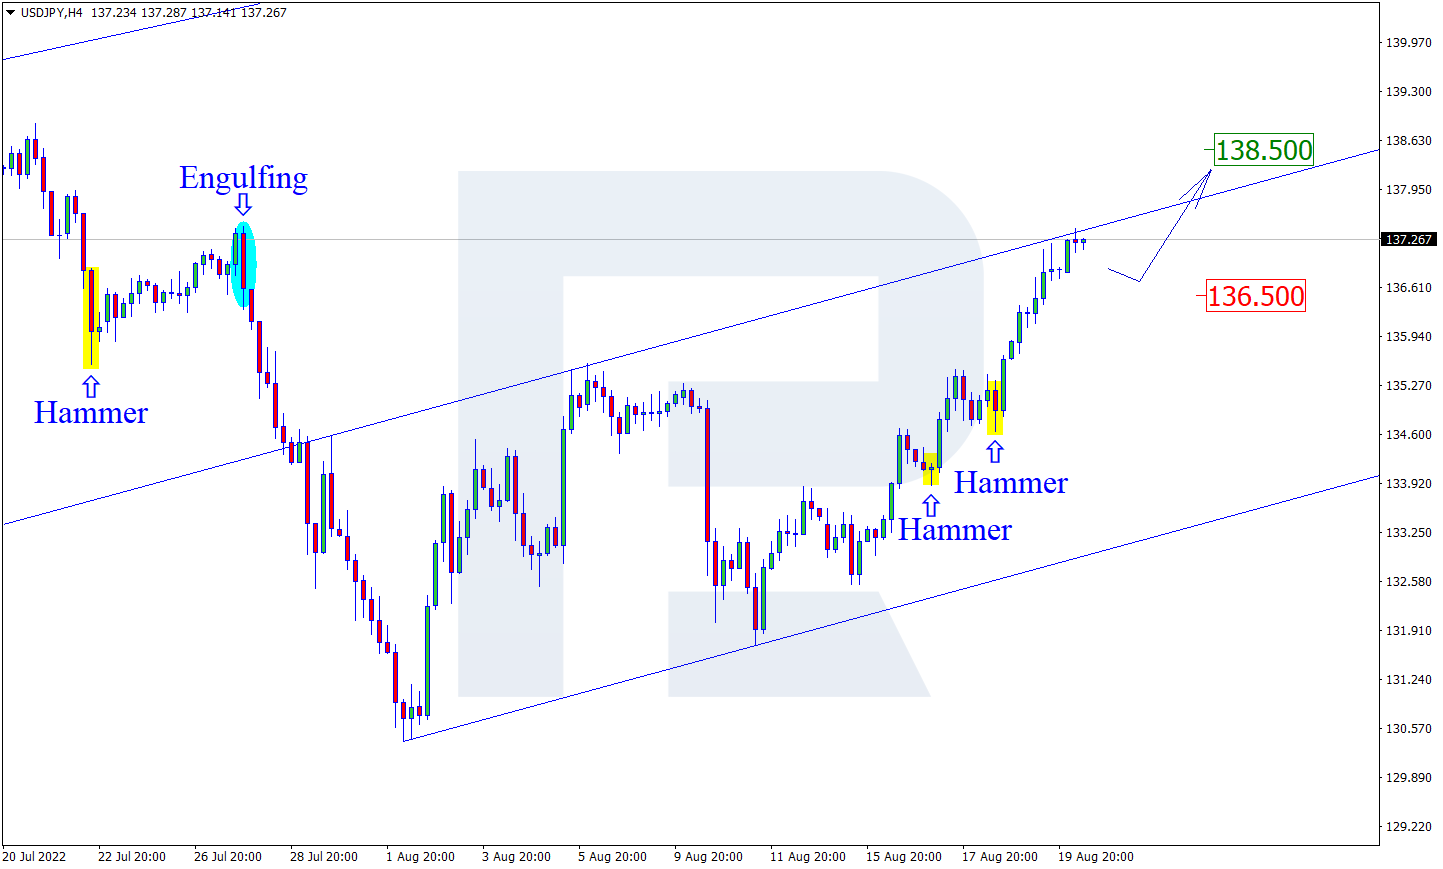
USDJPY continues falling with the short-term target at 132.55. After that, the instrument may correct up to 135.00 and then form a new descending structure to reach 131.11.

USDJPY
Risk Warning: the result of previous trading operations do not guarantee the same results in the future

USDCHF, “US Dollar vs Swiss Franc”

Having finished the descending wave at 0.9511, USDCHF is expected to start another growth to break 0.9572. Later, the market may continue trading upwards with the target at 0.9738.

USDCHF
Risk Warning: the result of previous trading operations do not guarantee the same results in the future

AUDUSD, “Australian Dollar vs US Dollar”

AUDUSD is still consolidating around 0.7000. Possibly, today the pair may resume trading downwards with the target at 0.6930.

AUDUSD
Risk Warning: the result of previous trading operations do not guarantee the same results in the future

BRENT

Brent continues consolidating around 105.55. Today, the asset may form one more ascending wave with the short-term target at 108.88. After that, the instrument may correct to test 105.55 from above and then start another growth to reach 111.00.

BRENT
Risk Warning: the result of previous trading operations do not guarantee the same results in the future

XAUUSD, “Gold vs US Dollar”

Gold has reached the short-term upside target at 1762.40. Today, the metal may start another correction to test 1739.40 from above and then resume trading upwards with the target at 1792.92.

GOLD
Risk Warning: the result of previous trading operations do not guarantee the same results in the future

S&P 500

The S&P index has reached the short-term upside target at 4100.0. Possibly, today the asset may consolidate around this level. If later the price breaks the range to the downside, the market may start a new correction towards 3921.2; if to the upside – form one more ascending structure with the target at 4211.0.

S&P 500

Article By RoboForex.com

Attention!
Forecasts presented in this section only reflect the author’s private opinion and should not be considered as guidance for trading. RoboForex LP bears no responsibility for trading results based on trading recommendations described in these analytical reviews.

Ichimoku Cloud Analysis 29.07.2022 (GBPUSD, USDCHF, NZDUSD)

Article By RoboForex.com

GBPUSD, “Great Britain Pound vs US Dollar”

GBPUSD is growing within the bullish channel. The instrument is currently moving above Ichimoku Cloud, thus indicating an ascending tendency. The markets could indicate that the price may test Tenkan-Sen at 1.2140 and then resume moving upwards to reach 1.2410. Another signal in favour of a further uptrend will be a rebound from the rising channel’s downside border. However, the bullish scenario may no longer be valid if the price breaks the cloud’s downside border and fixes below 1.1875. In this case, the pair may continue falling towards 1.1665.

GBPUSD
Risk Warning: the result of previous trading operations do not guarantee the same results in the future

USDCHF, “US Dollar vs Swiss Franc”

USDCHF has fixed above the support area. The instrument is currently moving below Ichimoku Cloud, thus indicating a descending tendency. The markets could indicate that the price may test Tenkan-Sen at 0.9585 and then resume moving downwards to reach 0.9355. Another signal in favour of a further downtrend will be a rebound from the descending channel’s upside border. However, the bearish scenario may no longer be valid if the price breaks the cloud’s upside border and fixes above 0.9775. In this case, the pair may continue growing towards 0.9865.

USDCHF
Risk Warning: the result of previous trading operations do not guarantee the same results in the future

NZDUSD, “New Zealand Dollar vs US Dollar”

NZDUSD is no longer moving inside the bullish channel. The instrument is currently moving above Ichimoku Cloud, thus indicating an ascending tendency. The markets could indicate that the price may test Tenkan-Sen at 0.6295 and then resume moving upwards to reach 0.6405. Another signal in favour of a further uptrend will be a rebound from the rising channel’s upside border. However, the bullish scenario may no longer be valid if the price breaks the cloud’s downside border and fixes below 0.6150. In this case, the pair may continue falling towards 0.6055.

NZDUSD

Article By RoboForex.com

Attention!
Forecasts presented in this section only reflect the author’s private opinion and should not be considered as guidance for trading. RoboForex LP bears no responsibility for trading results based on trading recommendations described in these analytical reviews.

The Analytical Overview of the Main Currency Pairs on 2022.07.29

By JustForex

The EUR/USD currency pair

Technical indicators of the currency pair:
  • Prev Open: 1.0200
  • Prev Close: 1.0196
  • % chg. over the last day: -0.04%

US gross domestic product (GDP) fell by 0.9% y/y in the second quarter. Consumer spending grew at the slowest pace in two years, and business spending declined, raising the risk that the economy is on the brink of a recession. Economists polled by Reuters had forecast GDP growth of 0.5%. Today in Europe, there will be many vital macroeconomic statistics, and volatility will be higher.

Trading recommendations
  • Support levels: 1.0170, 1.0142, 1.0112, 1.0035, 1.0000
  • Resistance levels: 1.0284, 1.0365, 1.0415, 1.050

From the technical point of view, the trend on the EUR/USD currency pair on the hourly time frame is bullish. The price is still forming a wide volatile balance, and buyer pressure prevails now. The MACD indicator is in the positive zone. Under such market conditions, buy trades are best sought on intraday time frames from the support level of 1.0170 or 1.0142. Sell trades can be considered from the resistance level of 1.0284, but only after additional confirmation and with short targets.

Alternative scenario: if the price breaks down through the 1.0112 support level and fixes below, the downtrend will likely resume.

EUR/USD
News feed for 2022.07.29:
  • – Eurozone French GDP (q/q) at 08:30 (GMT+3);
  • – Eurozone French Consumer Price Index (m/m) at 09:45 (GMT+3);
  • – Eurozone Spanish GDP (q/q) at 10:00 (GMT+3);
  • – Eurozone Spanish Consumer Price Index (m/m) at 10:00 (GMT+3);
  • – Eurozone German Unemployment Rate (m/m) at 10:55 (GMT+3);
  • – Eurozone German GDP (q/q) at 11:00 (GMT+3);
  • – Eurozone Italian Consumer Price Index (m/m) at 12:00 (GMT+3);
  • – Eurozone GDP (q/q) at 12:00 (GMT+3);
  • – Eurozone Consumer Price Index (m/m) at 12:00 (GMT+3);
  • – US PCE Price Index (m/m) at 15:30 (GMT+3);
  • – US Chicago PMI (m/m) at 16:45 (GMT+3);
  • – US Michigan Consumer Sentiment (m/m) at 17:00 (GMT+3).

The GBP/USD currency pair

Technical indicators of the currency pair:
  • Prev Open: 1.2149
  • Prev Close: 1.2177
  • % chg. over the last day: +0.23%

Brexit is only one of the major problems facing the next British prime minister. Other problems include high inflation, the cost of living crisis, gov sector wages, and the healthcare crisis. Add to that the interest rate differential between the Bank of England and the US Federal Reserve, and you get a rough picture of how much stronger the US dollar is now than the British currency. However, the British pound has been strengthening for the last two weeks as the US Dollar Index has declined amid a decrease in hawkish sentiment by the US Fed.

Trading recommendations
  • Support levels: 1.2143, 1.2089, 1.2063, 1.1907, 1.1803
  • Resistance levels: 1.2238, 1.2294

From the technical point of view, the trend on the GBP/USD currency pair on the hourly time frame is bullish. Buyer pressure remains. The MACD indicator is in the positive zone but shows signs of divergence already in several time frames. Under such market conditions, it is better to look for buy trades on the intraday time frames from the support level 1.2143 or 1.2089, but only with confirmation. Sell trades can be considered from the resistance level of 1.2238, but only after additional confirmation and with short targets.

Alternative scenario: if the price breaks down through the 1.2006 support level and fixes below, the downtrend will likely resume.

GBP/USD
There is no news feed for today.

The USD/JPY currency pair

Technical indicators of the currency pair:
  • Prev Open: 136.48
  • Prev Close: 134.22
  • % chg. over the last day: -1.68%

Tokyo’s core Consumer Price Index rose from 2.1% to 2.3% annually. The unemployment rate remained at 2.6%. Retail sales increased by 1.5% in June, while the industrial production index added 8.9% in the last month against an expected 7.5% decline. The Japanese Yen has strengthened today in the background of such production growth.

Trading recommendations
  • Support levels: 131.67, 130.99
  • Resistance levels: 134.72, 135.10, 136.03, 137.11

From the technical point of view, the medium-term trend on the USD/JPY currency pair is bearish. Over the last three trading sessions, the Japanese yen has been getting stronger. The MACD indicator has become negative, and the sellers’ pressure is still there, but there are signs of divergence. Under such market conditions, buy trades can be sought from the support level of 131.67, but with additional confirmation. Resistance levels of 134.72 or 135.10 may be considered for sell deals, but only with additional confirmation and short targets.

Alternative scenario: If the price fixes above 137.11, the uptrend will likely resume.

USD/JPY
News feed for 2022.07.29:
  • – Japan Tokyo Core CPI (m/m) at 02:30 (GMT+3);
  • – Japan Industrial Production (m/m) at 02:30 (GMT+3);
  • – Japan Unemployment Rate (m/m) at 02:30 (GMT+3);
  • – Japan Retail Sales (m/m) at 02:50 (GMT+3).

The USD/CAD currency pair

Technical indicators of the currency pair:
  • Prev Open: 1.2819
  • Prev Close: 1.2805
  • % chg. over the last day: -0.11%

The situation on the USD/CAD currency pair remains the same. When the US Dollar Index is falling and oil prices are rising, it is a green light for the Canadian currency, because the Canadian is a commodity currency and is directly dependent on these indicators. The interest rates of the central banks of the USA and Canada are at the same level now, so the price will keep a certain balance without any significant trends.

Trading recommendations
  • Support levels: 1.2781
  • Resistance levels: 1.2880, 1.2923, 1.3006, 1.3085, 1.3154

In terms of technical analysis, the USD/CAD currency pair trend is bearish. Currently, the price is forming a wide balance and trading on the lower border of the descending channel. The MACD indicator is in the negative zone, but there is a divergence, which indicates that it is harder for the price to move lower. Under such market conditions, it is better to consider sell deals from the resistance level of 1.2880, but with confirmation. Buy trades should be considered on the lower time frames from the support level of 1.2781 or the channel’s lower border, but only with confirmation and short targets.

Alternative scenario: if the price breaks out and consolidates above the 1.3006 resistance level, the uptrend will likely resume.

USD/CAD
News feed for 2022.07.29:
  • – Canada GDP (m/m) at 15:30 (GMT+3).

By JustForex


This article reflects a personal opinion and should not be interpreted as an investment advice, and/or offer, and/or a persistent request for carrying out financial transactions, and/or a guarantee, and/or a forecast of future events.

US GDP falls, but markets see it as positive

By JustForex

On Thursday, the S&P 500 rose after an unexpected slowdown in the US economy, sparking optimism that the Federal Reserve will be forced to revise the pace of rate hikes downward. As the stock market closed yesterday, the Dow Jones Index (US30) increased by 1.03%, and the S&P 500 (US500) added 1.21%. Technology Index NASDAQ (US100) gained 1.08% yesterday.

According to the US Commerce Department, the economy decreased by 0.9% in the second quarter (with an estimate of +0.5%). It is the second quarter of contraction, pushing the economy into a technical recession. Analysts at Morgan Stanley note that the Fed will have to cut the pace of rate hikes to 50 bps in September, but the risks of a rate hike remain as inflation is not slowing. Other economic data showed that initial jobless claims fell by 5,000 to 256,000 for the week.

Amazon (AMZN) stock jumped more than 10% in extended trading Thursday after the report was released. The tech giant missed earnings expectations, but revenue for the quarter was up 7% from a year ago. On Thursday, shares of Intel (INTC) fell more than 8% after the report was released. Experts saw a deterioration in their Q3 outlook. Shares of Roku (ROKU) fell by 26% due to a weak report and a poor Q3 outlook. Shares of Apple (AAPL) added 3% after Q2 earnings beat estimates.

Exxon Mobil (XOM), Procter&Gamble (PG), Chevron (CVX), AbbVie (ABBV), AstraZeneca ADR (AZN), Colgate-Palmolive (CL), and others report today.

Yesterday, equity markets in Europe were mostly up. German DAX (DE30) gained 0.88%, French CAC 40 (FR 40) jumped by 1.30%, Spanish IBEX 35 (ES35) fell by 0.49%, British FTSE 100 (UK100) closed on the plus side 0.04%.

Europe’s largest oil companies Shell and Total Energies extended their share buybacks. It happened after second-quarter earnings surpassed the previous quarter’s already recorded high on the back of a surge in oil, gas, and petroleum product prices.

Preliminary data on inflation in Germany showed a 0.9% increase in consumer prices over the past month. Thus, annual inflation in Germany is estimated at 7.6%. The main reason for the price increase is the jump in energy prices after Russia invades Ukraine.

Oil is stable as the market weighs limited supply amid fears of a recession. Investors’ attention has now shifted to the next OPEC meeting next week.

Gold and silver prices have risen over the past few days amid a decline in the US Dollar Index and US government bond yields. But it should be noted that the decline of the dollar is temporary. The US Federal Reserve needs to reduce the pace of interest rate hikes to prevent sending the US economy into recession. But the rate hikes and the Fed’s balance sheet cuts continue, which is negative for the precious metals.

Asian stocks were mostly up yesterday. Japan’s Nikkei 225 (JP225) gained 0.36%, Hong Kong’s Hang Seng (HK50) decreased 0.23% and Australia’s S&P/ASX 200 (AU200) was up 0.97% on the day.

The latest economic data showed that Japan’s core Tokyo Consumer Price Index rose from 2.1% to 2.3% annually. The unemployment rate remained at 2.6%. Retail sales for June increased by 1.5%, while the Industrial Production Index added 8.9% last month, while a 7.5% decline was expected.

China will step up efforts to stabilize foreign trade in the second half of the year, the Commerce Ministry said on Friday.

S&P 500 (F) (US500) 4,072.39 +48.78 (+1.21%)

Dow Jones (US30) 32,529.63 +332.04 (+1.03%)

DAX (DE40) 13,282.11 +115.73 (+0.88%)

FTSE 100 (UK100) 7,345.25 −2.98 (−0.041%)

USD Index 106.25 −0.20 (−0.19%)

Important events for today:
  • – Japan Tokyo Core CPI (m/m) at 02:30 (GMT+3);
  • – Japan Industrial Production (m/m) at 02:30 (GMT+3);
  • – Japan Unemployment Rate (m/m) at 02:30 (GMT+3);
  • – Japan Retail Sales (m/m) at 02:50 (GMT+3);
  • – Eurozone French GDP (q/q) at 08:30 (GMT+3);
  • – Switzerland Retail Sales (m/m) at 09:30 (GMT+3);
  • – Eurozone French Consumer Price Index (m/m) at 09:45 (GMT+3);
  • – Eurozone Spanish GDP (q/q) at 10:00 (GMT+3);
  • – Eurozone Spanish Consumer Price Index (m/m) at 10:00 (GMT+3);
  • – Eurozone German Unemployment Rate (m/m) at 10:55 (GMT+3);
  • – Eurozone German GDP (q/q) at 11:00 (GMT+3);
  • – Eurozone Italian Consumer Price Index (m/m) at 12:00 (GMT+3);
  • – Eurozone GDP (q/q) at 12:00 (GMT+3);
  • – Eurozone Consumer Price Index (m/m) at 12:00 (GMT+3);
  • – Canada GDP (m/m) at 15:30 (GMT+3);
  • – US PCE Price index (m/m) at 15:30 (GMT+3);
  • – US Chicago PMI (m/m) at 16:45 (GMT+3);
  • – US Michigan Consumer Sentiment (m/m) at 17:00 (GMT+3).

By JustForex


This article reflects a personal opinion and should not be interpreted as an investment advice, and/or offer, and/or a persistent request for carrying out financial transactions, and/or a guarantee, and/or a forecast of future events.

Week Ahead: BOE to sustain GBPUSD above 50-day SMA?

By ForexTime

The first week of August is set to feature a host of key events that could shake up markets, including the latest US jobs report, fresh Wall Street earnings, and perhaps even a new OPEC+ deal.

Still, the central bank watch remains front and center as the Reserve Bank of Australia and Bank of England could hike their respective rates by another 50 basis points each in the coming week.


Here are the key releases and events that we’re keeping an eye on for the week ahead:

Monday, August 1

  • AUD: Australia July inflation
  • CNH: China July Caixin manufacturing PMI
  • EUR: Eurozone June unemployment rate
  • USD: US July ISM manufacturing data

Tuesday, August 2

  • AUD: Reserve Bank of Australia rate decision
  • USD: Speeches by Chicago Fed President Charles Evans, St. Louis Fed President James Bullard
  • Starbucks 2Q earnings
  • BP 2Q earnings

Wednesday, August 3

  • NZD: New Zealand 2Q unemployment
  • AUD: Australia Q2 retail sales
  • CNH: China July Caixin services PMI
  • EUR: Eurozone June retail sales, PPI; Germany June external trade
  • USD: US June factory orders, July ISM services index
  • Brent: OPEC+ meeting
  • US crude: EIA weekly oil inventory report

Thursday, August 4

  • AUD: Australia June external trade
  • EUR: ECB publishes Economic Bulletin; Germany June factory orders
  • GBP: Bank of England rate decision
  • USD: US weekly jobless claims; Cleveland Fed President Loretta Mester speech
  • Alibaba 2Q earnings

Friday, August 5

  • AUD: RBA releases Monetary Policy statement, including updated economic forecasts
  • GBP: BOE Chief Economist Huw Pill speech
  • EUR: Germany June industrial production
  • CAD: Canada July unemployment
  • USD: US July nonfarm payrolls


GBPUSD traders will be firmly focused on whether the Bank of England’s policy decision could help keep “cable” above its 50-day simple moving average (SMA), provided this pair can first see a meaningful breach of this immediate resistance level.

At the time of writing, markets are forecasting just a 53% chance of a 50bps hike by the BOE at its August policy meeting; those odds are a far cry from the 84.5% back at the start of July.

A 50bps hike by the BOE could help lift Sterling, provided policymakers can not only prove doubters wrong and trigger its largest hike in 27 years, but also point to more larger-than-usual hikes in the pipeline.

After all, with the UK consumer price index (CPI) already registering at 9.4% in June – its highest CPI print since February 1982 – that’s reason enough for the central bank to “act forcefully”. UK inflation is also forecasted to go on to post double-digit figures in Q4.


Yet, markets have enough reasons to doubt that the UK’s central bank can indeed follow through with this “forceful” stance.

UK retail sales have been contracting while consumer confidence is at its lowest in about five decades. Workers across various industries have been on strike as wages struggle to keep up with soaring inflation. Since May, the BOE already issued a grim outlook for the UK economy, forecasting a recession for 2023.

Sterling’s upside is being capped by the markets’ pessimism about the UK economy’s ability to withstand interest rates moving much higher.

Such doubts suggest that GBPUSD may do no better than the mid-June cycle high around 1.24 over the near-term, provided the US dollar remains soft in the interim.

If markets instead seize on BOE hesitance to send UK rates higher at this August policy meeting, then the 1.20 psychologically-important level could beckon once more for GBPUSD.


Forex-Time-LogoArticle by ForexTime

ForexTime Ltd (FXTM) is an award winning international online forex broker regulated by CySEC 185/12 www.forextime.com

Chart Spotlight: Marathon Digital Holdings (MARA)

By Ino.com

Cryptocurrencies are showing big signs of life again.

Look at Bitcoin, for example. After crashing to a low of $19,097, BTC is now back up to $22,960. Not only is that great news for cryptocurrencies, it’s a strong catalyst for mining stocks, like Marathon Digital Holdings (NASDAQ: MARA).

After all, miners rise and fall with the price of Bitcoin.

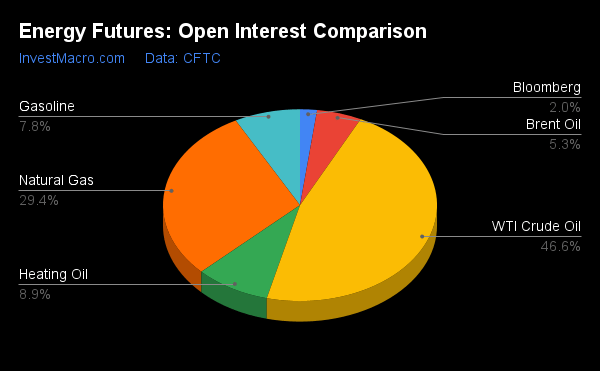
Technically, MARA just broke above double top resistance dating back to late May 2022. Now, from a current price of $11.48, we could see a potential bearish gap refill around $16 a share. If Bitcoin can continue to recover, MARA could even retest $30 at some point.
Granted, there are some red flags…

Not only is MARA at its upper Bollinger Band, it’s also over-extended on Williams’ %R, Fast Stochastics, and on Relative Strength. So, there is some concern. However, if Bitcoin can continue to push higher, MARA is sure to follow.

MARA Chart with Trade Triangles

Source: MarketClub
 

Helping, BTIG analyst Mark Palmer believes Bitcoin could quadruple from current prices to $95,000 by 2023, as noted by U Today.

Changpeng Zhao, the CEO of Binance believes Bitcoin could rally to $70,000 in “a few months or years,” he said, as quoted by The Guardian.

Even the CEO of MicroStrategy, Michael Saylor has been buying weakness in Bitcoin, too.

Fundamentally, there’s a lot to like about MARA, as well.

In the second quarter of 2022, the company produced 707 self-mined Bitcoin, an 8% increase year over year from 654 bitcoin mined in Q2 2021. Year-to-date Marathon Digital produced 1,966 Bitcoin, a 132% increase year over year. In addition, the total number of miners installed and awaiting energization at Texas facilities increased to 29,640 miners.

Marathon Digital also just secured a five-year deal with Applied Blockchain, which builds and operates data centers throughout America.

With that, Marathon “secured approximately 254 megawatts of new hosting arrangements for its Bitcoin mining operations, with an option to increase to 324 megawatts, from a variety of hosting providers. Marathon believes it has now secured ample hosting arrangements to support the Company’s previously stated goal of approximately 23.3 exahashes per second of computing power for Bitcoin mining,” as noted in a company press release.
That’s big news for MARA, and signals that the company will survive the rout.
From a current price of $11.48, I’d like to see the Marathon Digital Holdings stock test $16 a share, near-term. Longer-term, I’d like to see it test $30 again.

Ian Cooper
INO.com Contributor

Disclosure: This contributor did not hold a position in any investment mentioned above at the time this blog post was published. This article is the opinion of the contributor themselves. The above is a matter of opinion provided for general information purposes only and is not intended as investment advice. This contributor is not receiving compensation (other than from INO.com) for their opinion.

By Ino.com – See our Trader Blog, INO TV Free & Market Analysis Alerts

Source: Chart Spotlight: Marathon Digital Holdings (MARA)

What a Major Indicator of “Housing Busts” is Showing Now

“It was the first such decline since November 2015”

By Elliott Wave International

The housing market tends to go the way of the stock market, and nearly everyone knows that the stock market has been sliding.

There’s another housing market indicator that the July Global Market Perspective, a monthly Elliott Wave International publication which covers 50-plus financial markets, mentioned:

[Home] sales declines invariably lead the way into housing busts. This one … should arrive faster and more forcefully than the experts expect.

Homes sales have already begun to decline:

  • U.S. existing home sales fall for third straight month; house prices at record high (Reuters, May 19)
  • Sales of existing homes fell in May, and more declines are expected (CNBC, June 21)

Sales of luxury homes in some areas have dropped significantly. As examples, in Nassau County, NY, Oakland, CA, Dallas, TX, Austin, TX and West Palm Beach, FL, annual drops in the rate of upper-end home sales for the three months ended April 30 stretched from 32.8% to 45.3%.

As June numbers roll in, more signs of a real estate slowdown are evident. For instance, the number of active U.S. home listings jumped 18.7% in June from a year earlier, the largest annual increase since the data started in 2017.

The housing bubble is by no means confined to the U.S. Bloomberg reports that New Zealand, Australia and Canada look even more “frothy” than the U.S.

And, then there’s China. Here’s a chart and commentary from the June Global Market Perspective:

Month-to-month prices of China’s new-home sales turned negative in September, and they’ve continued to fall since. The year-over-year average of new home prices also fell in April. It was the first such decline since November 2015.

In Elliott Wave International’s view, housing markets around the globe are on shaky ground and those who bought at the peak of this latest housing boom better be prepared.

It was mentioned at the top of this article that housing markets within a nation tend to trend with that nation’s stock market.

Elliott wave analysis can help you get a perspective on stock markets anywhere in the world.

If you’re unfamiliar with the Elliott wave model, you are encouraged to read Frost & Prechter’s Wall Street classic, Elliott Wave Principle: Key to Market Behavior.

Here’s a quote from that book:

In the 1930s, Ralph Nelson Elliott discovered that stock market prices trend and reverse in recognizable patterns. The patterns he discerned are repetitive in form but not necessarily in time or amplitude. Elliott isolated five such patterns, or “waves,” that recur in market price data. He named, defined and illustrated these patterns and their variations. He then described how they link together to form larger versions of themselves, how they in turn link to form the same patterns of the next larger size, and so on, producing a structured progression. He called this phenomenon The Wave Principle.

If you’d like to read the entire book, do know that you can access the online version for free once you join Club EWI, the world’s largest Elliott wave educational community.

Club EWI is free to join, and members enjoy complimentary access to videos and other resources on how the Wave Principle can help them navigate financial markets.

Just follow this link to get started: Elliott Wave Principle: Key to Market Behavior — get instant and free access now.

This article was syndicated by Elliott Wave International and was originally published under the headline What a Major Indicator of “Housing Busts” is Showing Now. EWI is the world’s largest market forecasting firm. Its staff of full-time analysts led by Chartered Market Technician Robert Prechter provides 24-hour-a-day market analysis to institutional and private investors around the world.

Japanese Candlesticks Analysis 28.07.2022 (USDCAD, AUDUSD, USDCHF)

Article By RoboForex.com

USDCAD, “US Dollar vs Canadian Dollar”

As we can see in the H4 chart, after forming several reversal patterns close to the support level, such as Doji and Hammer, USDCAD may reverse in the form of another ascending impulse. In this case, the upside target may be the resistance area at 1.2920. Later, the market may break this level and continue growing. However, an alternative scenario implies that the asset may correct to reach 1.2740 and continue the uptrend only after the pullback.

USDCAD
Risk Warning: the result of previous trading operations do not guarantee the same results in the future

AUDUSD, “Australian Dollar vs US Dollar”

As we can see in the H4 chart, AUDUSD has formed a Harami reversal pattern near the resistance area. At the moment, the asset is reversing in the form a new descending impulse. In this case, the downside target may be the support level at 0.6950. After testing the level, the price may rebound from it and resume the ascending tendency. At the same time, the opposite scenario implies that the price may grow to reach 0.7065 and continue the uptrend without any pullbacks.

AUDUSD
Risk Warning: the result of previous trading operations do not guarantee the same results in the future

USDCHF, “US Dollar vs Swiss Franc”

As we can see in the H4 chart, after testing the support area, the pair has formed a Hammer reversal pattern. At the moment, USDCHF may reverse in the form of a new rising impulse. In this case, the upside target may be at 0.9695. After testing the resistance level, the price may break it and continue trading upwards. Still, there might be an alternative scenario, in which the asset may correct to reach 0.9550 and continue the ascending tendency only after correcting down to the support area.

USDCHF

Article By RoboForex.com

Attention!
Forecasts presented in this section only reflect the author’s private opinion and should not be considered as guidance for trading. RoboForex LP bears no responsibility for trading results based on trading recommendations described in these analytical reviews.