Archive for Financial News – Page 315

Murrey Math Lines 28.07.2022 (USDCHF, GOLD)

Article By RoboForex.com

USDCHF, “US Dollar vs Swiss Franc”

In the H4 chart, USDCHF is trading below the 200-day Moving Average to indicate a possible descending tendency. In this case, the pair is expected to test 2/8, break it, and then continue falling towards the support at 1/8. However, this scenario may be cancelled if the price breaks the resistance at 3/8 to the upside. After that, the instrument may move upwards to reach 4/8.

USDCHFH4
Risk Warning: the result of previous trading operations do not guarantee the same results in the future

As we can see in the M15 chart, the pair has broken the downside line of the VoltyChannel indicator and, as a result, may continue its decline.

USDCHF_M15
Risk Warning: the result of previous trading operations do not guarantee the same results in the future

XAUUSD, “Gold vs US Dollar”

In the H4 chart, XAUUSD is also trading below the 200-day Moving Average, thus indicating a descending tendency. In this case, the price is expected to test 4/8, rebound from it, and then resume moving downwards to reach the support at 3/8. However, this scenario may no longer be valid if the price breaks the resistance at 4/8 to the upside. After that, the instrument may reverse and resume growing to return to 5/8.

XAUUSD_H4
Risk Warning: the result of previous trading operations do not guarantee the same results in the future

As we can see in the M15 chart, the downside line of the VoltyChannel indicator is pretty far away from the price, that’s why the pair may resume trading downwards only after rebounding from 4/8 in the H4 chart.

XAUUSD_M15

Article By RoboForex.com

Attention!
Forecasts presented in this section only reflect the author’s private opinion and should not be considered as guidance for trading. RoboForex LP bears no responsibility for trading results based on trading recommendations described in these analytical reviews.

A hawkish Fed signals further rate hikes and sees a slowing economy – but not recession

By Arabinda Basistha, West Virginia University 

The U.S. Federal Reserve hiked its benchmark interest rate by a further three-quarters of a percentage point on July 27, 2022.

The jump was expected by most economists, although some had thought the central bank would go further in its attempts to put the brakes on soaring inflation and impose a full point increase.

The Conversation asked Arabinda Basistha, an economist at West Virginia University, to cast an eye over the Fed’s announcement and provide three key takeaways about what it tells us about the economy and future monetary policy.

1. More hawkish on monetary policy

On the surface, the headline decision to raise the interest rate by three-quarters of a percentage point is very much in line with what was expected. But a careful reading of the accompanying statement by the rate-setting Federal Open Market Committee (FOMC) reveals a slightly more hawkish Fed – one that’s more willing to act more aggressively in attempting to calm inflation – than in the last such meeting in June, when it likewise raised rates by three-quarters of a percentage point.

On that occasion, the vote was not unanimous – Kansas City Fed President Esther George opted to go for a half-point raise but was outvoted by colleagues who wanted the more aggressive 0.75% hike in a bid to bring down inflation.

But this time the vote was unanimously in favor of the three-quarter point rise, an indication that the Fed thinks it needs to act more decisively in the face of stubborn cost of living increases.

A notable change in the FOMC statement was the removal of any reference to supply chain disruptions due to COVID-19 in China. That line was in June’s statement, so its absence this time may indicate an easing of the supply chain issues that have contributed to inflation hitting a 40-year high.

That aside, Fed Chairman Jerome Powell stuck a downbeat note on inflation in the U.S., acknowledging in a news conference accompanying the announcement that June’s Consumer Price Index hitting 9.1% was “worse than expected.”

2. Expect a further rate hike in September

There is now a clear indication that that the FOMC will impose another rate hike when it meets in September. Powell noted in the news conference that another 0.75 percentage point rise in September “could be appropriate.”

At the same time, he acknowledged that with the latest increase, the Fed’s rate was pretty much in line with what economists call the “neutral” rate of interest – that is, a rate which neither stimulates the economy nor slows it down. The “neutral rate” is assumed to be around 2.5%; the latest FOMC hike puts the Feds’ policy rate up to a range of 2.25% to 2.5%.

So if there were to be another fairly sharp rise in the benchmark interest rate in September, it would push the Fed rate above the neutral rate – a move that would restrict economic growth. Again, this is an indication that the Fed is striking a more hawkish tone on monetary policy.

Powell did mention that a more moderate rate rise in September is possible, but that will likely depend on there being clear data showing price stabilization and an overall softening of the labor market. The job market has been strong for a while, with healthy monthly gains. The Fed will be looking for a decrease in the current high number of job vacancies, along with lower wage inflation, to signal a softening labor market before it can ease back on aggressive rate hikes.

3. Economic output is slowing, but no recession (yet)

In the statement accompanying the FOMC rate decision, the Fed noted that recent data showed “spending and production have softened.” Powell expanded on that a little, noting that business fixed investment – that is, how much companies spend on things like machines or factories – had gone down.

This acknowledgment that expenditure is softening wasn’t in June’s statement and is a clear sign that Fed officials believe the economy is slowing down, something Powell acknowledged. Yet at the same time, the Fed chair said the strength of the labor market indicated robust overall demand.

As such, it would seem Powell does not see the U.S. heading into recession, but rather, there will be some slowing down of the economy throughout the second half of this year.The Conversation

About the Author:

Arabinda Basistha, Associate Professor of Economics, West Virginia University

This article is republished from The Conversation under a Creative Commons license. Read the original article.


The Analytical Overview of the Main Currency Pairs on 2022.07.28

By JustForex

The EUR/USD currency pair

Technical indicators of the currency pair:
  • Prev Open: 1.0114
  • Prev Close: 1.0198
  • % chg. over the last day: +0.83%

The US central bank raised rates by three-quarters of a percentage point for the second session in a row to rein in record inflation but noted that while the labor market remains strong, other economic indicators have deteriorated. According to the Fed gov, there are no signs of a recession at this time. At the press conference, Fed Chairman Jerome Powell supported the idea that the central bank will hold another rate hike in September, although he said that a slower pace of increases might be needed. According to the CME FedWatch Tool, expectations for a 50 basis point hike at the September Fed meeting rose to 60.9%, up from 50.7% the day before.

Trading recommendations
  • Support levels: 1.0170, 1.0142, 1.0035, 1.0000
  • Resistance levels: 1.0202, 1.0250, 1.0284, 1.0365, 1.0415, 1.050

From the technical point of view, the trend on the EUR/USD currency pair on the hourly time frame is bullish. The price is still forming a wide volatile balance, and buyer pressure prevails now. The MACD indicator has become positive. Under such market conditions, buy trades are best sought on intraday time frames from the support level of 1.0170 or 1.0142. Sell trades can be considered from the resistance level of 1.0202, only after additional confirmation and with short targets.

Alternative scenario: if the price breaks down through the 1.0035 support level and fixes below, the downtrend will likely resume.

EUR/USD
News feed for 2022.07.28:
  • – US GDP (q/q) at 15:30 (GMT+3);
  • – US Treasury Sec Yellen Speaks at 15:30 (GMT+3);
  • – US Initial Jobless Claims (w/w) at 15:30 (GMT+3).

The GBP/USD currency pair

Technical indicators of the currency pair:
  • Prev Open: 1.2016
  • Prev Close: 1.2155
  • % chg. over the last day: +1.16%

The British pound rose sharply yesterday as the dollar fell after the FOMC meeting. But traders should remember that the interest rate of the central bank of England is now at 1.25%, while the US Federal Reserve’s interest rate is 2.5%, which is twice as much. Such differences can’t pass in vain for the British currency, so analysts expect a decline in GBP/USD quotes in the coming weeks.

Trading recommendations
  • Support levels: 1.2089, 1.2063, 1.1907, 1.1803
  • Resistance levels: 1.2238, 1.2294

From the technical point of view, the trend on the GBP/USD currency pair on the hourly time frame is bullish. Buyer pressure remains. The MACD indicator is in the positive zone but shows signs of divergence already in several time frames. Under such market conditions, it is better to look for buy trades on the intraday time frames from the support level 1.2089 or 1.2063, but only with confirmation. Sell trades can be considered from the resistance level of 1.2238, but only after additional confirmation and with short targets.

Alternative scenario: if the price breaks down through the 1.1907 support level and fixes below, the downtrend will likely resume.

GBP/USD
There is no news feed for today.

The USD/JPY currency pair

Technical indicators of the currency pair:
  • Prev Open: 136.89
  • Prev Close: 136.60
  • % chg. over the last day: -0.22%

Despite the decline in the US Dollar Index yesterday, analysts are still confident in a further rise in USD/JPY quotes as the US and Japanese central banks are moving in different directions. The US Fed is planning another rate hike in September, while the Japanese bank does not intend to tighten its policy until the end of the year.

Trading recommendations
  • Support levels: 134.64, 134.11
  • Resistance levels: 135.88, 136.62, 137.11, 138.25

From the technical point of view, the medium-term trend on the USD/JPY currency pair is bearish. But it should be noted that the fall in the USD/JPY quotes is not accompanied by any fundamental factors, so traders should be careful. The MACD indicator has become negative, and the sellers’ pressure is still there, but there are signs of divergence. Under such market conditions, buy trades can be sought intraday from the lower boundary of the descending channel or the support level of 134.64, but with additional confirmation. Resistance levels of 135.88 or 136.62 may be considered for sell deals, but only with additional confirmation and short targets.

Alternative scenario: If the price fixes above 138.25, the uptrend will likely resume.

USD/JPY
There is no news feed for today.

The USD/CAD currency pair

Technical indicators of the currency pair:
  • Prev Open: 1.2886
  • Prev Close: 1.2822
  • % chg. over the last day: -0.50%

When the US Dollar Index is falling, and oil prices are rising, it is a green light for the Canadian currency because the Canadian is a commodity currency and is directly dependent on these indicators. Now the interest rates of the central banks of the USA and Canada are at the same level, so the price will keep a certain balance without significant trends.

Trading recommendations
  • Support levels: 1.2781
  • Resistance levels: 1.2880, 1.2923, 1.3006, 1.3085, 1.3154

In terms of technical analysis, the trend on the USD/CAD currency pair is bearish. Currently, the price is forming a wide balance and trading on the lower border of the descending channel. The MACD indicator is negative again, but there is a divergence, which indicates that it is harder for the price to move lower. Under such market conditions, it is better to consider sell deals from the resistance level of 1.2880, but with confirmation. Buy trades should be considered on the lower time frames from the support level of 1.2781 or the lower border of the channel, but only with confirmation and short targets.

Alternative scenario: if the price breaks out and consolidates above the 1.3006 resistance level, the uptrend will likely resume.

USD/CAD
There is no news feed for today.

By JustForex


This article reflects a personal opinion and should not be interpreted as an investment advice, and/or offer, and/or a persistent request for carrying out financial transactions, and/or a guarantee, and/or a forecast of future events.

The US Federal Reserve hinted at a slowdown in the pace of rate hikes. The situation in the gas market is escalating

By JustForex

The US Federal Reserve yesterday raised interest rates by 75 basis points and confirmed that further increases would be appropriate to contain high inflation, which is putting pressure on global economic activity. The Fed said that some parts of the economy, such as spending and production, have weakened. However, there has been significant job growth in recent months, and the unemployment rate remains low. At a press conference following the monetary policy announcement, Fed Chairman Jerome Powell supported the idea that the central bank would hold another rate hike in September. However, he said that a slower pace of increases might be needed to give the Fed time to evaluate the implications. It is positive for the market, as the peak of the Fed’s hawkish mood has passed. As the stock market closed yesterday, the Dow Jones Index (US30) increased by 1.37%, and the S&P 500 Index (US500) added 2.62%. Technology Index NASDAQ (US100) jumped by 4.06% yesterday.

Experts believe the Fed’s policy measures to rein in inflation seem to be having the desired effect as recent data and quarterly reports from consumer demand-sensitive sectors, including retail, have revealed fears of slowing economic growth. But many fear that in its fight against inflation, the Fed could slow the economy too much, avoid a so-called “soft landing,” and tilt the economy into recession.

Microsoft shares increased by 6.7% after forecasting double revenue growth. Alphabet shares jumped by 7.7% on the report. The company reported better-than-expected sales of Google Ads Search, easing fears of a slowing advertising market. Companies reporting today include Apple (AAPL), Amazon.com (AMZN), Mastercard (MA), Pfizer (PFE), Merck&Co (MRK), Shell ADR (SHEL), Intel (INTC), Baidu (BIDU) and others.

Most Gulf central banks raised their key interest rates by three-quarters of a percentage point Wednesday, following the US Federal Reserve, as their currencies are pegged to the dollar. The Central Bank of Kuwait, the only one of the six Gulf Cooperation Council (GCC) countries that peg its currency to a basket, not just the dollar, raised its key discount rate by 25 basis points to 2.5%.

Equity markets in Europe closed yesterday in green territory. German DAX (DE30) gained 0.53% on Wednesday, French CAC 40 (FR 40) jumped by 0.75%, Spanish IBEX 35 (ES35) added 0.68%, British FTSE 100 (UK100) closed in plus 0.57%.

Rising inflation and concerns over low natural gas supply combined with the risk of recession caused consumer sentiment in the euro area to plummet to record lows. The main reasons for the sharp deterioration in confidence are primarily related to the Russian invasion of Ukraine. Firstly, because of fears of low natural gas supply. Secondly, fears of recession, as the war has triggered inflation, especially in energy and commodities. In addition, investors are concerned about the political uncertainty in Italy and the struggle for the position of Prime Minister in the UK.

Oil rose more than $2 on Wednesday as a report of lower US inventories, and reduced Russian gas supplies to Europe offset fears of lower demand and a US interest rate hike. US crude reserves were down by 4.5 million barrels last week as exports rose to a record high due to a significant discount in US crude against the international benchmark Brent, the Energy Information Administration said.

The gas market also remains tight. Just days after Europeans breathed a sigh of relief when Russia’s Gazprom announced it would resume supplies through its Nord Stream 1 pipeline, it announced Monday that flows would be cut again. The announcement, in which Gazprom said it would repair a turbine along the pipeline, was met with disbelief and condemnation in Europe. The move will reduce gas flows to Germany by up to 20% of its capacity. Germany, the region’s largest economy and a traditional growth driver, has particular cause for concern. Germany is heavily dependent on Russian gas and is sliding into recession. Since Russia is under a slew of international sanctions in response to its war with Ukraine, gas is one of the weapons Russia uses against Europe. As a result, natural gas prices continue to rise significantly. Analysts predict a harsh winter for Europe if the situation does not change.

On Thursday, Asian stocks showed cautious gains as investors sensed a possible slowdown in the pace of rate hikes in the United States. Japan’s Nikkei 225 (JP225) gained 0.22%, Hong Kong’s Hang Seng (HK50) decreased by 1.13%, while Australia’s S&P/ASX 200 (AU200) was up 0.23% on the day.

S&P 500 (F) (US500) 4,023.61 +102.56 (+2.62%)

Dow Jones (US30) 32,197.59 +436.05 (+1.37%)

DAX (DE40) 13,166.38 +69.45 (+0.53%)

FTSE 100 (UK100) 7,348.23 +41.95 (+0.57%)

USD Index 107.22 +0.73 (+0.69%)

Important events for today:
  • – Australia Retail Sales (m/m) at 04:30 (GMT+3);
  • – US GDP (q/q) at 15:30 (GMT+3);
  • – US Treasury Sec Yellen Speaks at 15:30 (GMT+3);
  • – US Initial Jobless Claims (w/w) at 15:30 (GMT+3);
  • – US Natural Gas Storage (w/w) at 17:30 (GMT+3).

By JustForex


This article reflects a personal opinion and should not be interpreted as an investment advice, and/or offer, and/or a persistent request for carrying out financial transactions, and/or a guarantee, and/or a forecast of future events.

Murrey Math Lines 27.07.2022 (USDJPY, USDCAD)

Article By RoboForex.com

USDJPY, “US Dollar vs. Japanese Yen”

On the H4 chart, after breaking 8/8, USDJPY is no longer trading within the “overbought” area. In this case, the price is expected to test the resistance at 8/8, rebound from it, and resume falling and reach 6/8. However, this scenario may no longer be valid if the price breaks the resistance at 8/8 to the upside. After that, the instrument may reverse and grow towards +1/8.

USDJPYH4
Risk Warning: the result of previous trading operations do not guarantee the same results in the future

As we can see in the M15 chart, the downside line of the VoltyChannel indicator is pretty far away from the price, that’s why the pair may resume trading downwards only after rebounding from 8/8 in the H4 chart.

USDJPY_M15
Risk Warning: the result of previous trading operations do not guarantee the same results in the future

USDCAD, “US Dollar vs Canadian Dollar”

As we can see in the H4 chart, after breaking the 200-day Moving Average, USDCAD is also trading below it, thus indicating a possible descending tendency. In this case, the price is expected to test 1/8, break it, and then continue falling towards the support at 0/8. On the other hand, this scenario may no longer be valid if the pair breaks the resistance at 2/8 to the upside. After that, the instrument may reverse and grow to reach 3/8.

USDCAD_H4
Risk Warning: the result of previous trading operations do not guarantee the same results in the future

In the M15 chart, the pair may break the downside line of the VoltyChannel indicator and, as a result, continue trading downwards.

USDCAD_M15

Article By RoboForex.com

Attention!
Forecasts presented in this section only reflect the author’s private opinion and should not be considered as guidance for trading. RoboForex LP bears no responsibility for trading results based on trading recommendations described in these analytical reviews.

Forex Technical Analysis & Forecast 27.07.2022

Article By RoboForex.com

EURUSD, “Euro vs US Dollar”

Having completed the descending wave at 1.0133, EURUSD is forming a new consolidation range around this level. If later the price breaks the range to the upside, the market may correct up to 1.0200; if to the downside – start a new decline with the short-term target at 1.0033.

EURUSD
Risk Warning: the result of previous trading operations do not guarantee the same results in the future

GBPUSD, “Great Britain Pound vs US Dollar”

After finishing the descending impulse at 1.1965, GBPUSD is correcting up to 1.2061. Later, the market may fall to break 1.1955 and then continue trading downwards with the short-term target at 1.1850.

GBPUSD
Risk Warning: the result of previous trading operations do not guarantee the same results in the future

USDJPY, “US Dollar vs Japanese Yen”

Having completed the correctional wave at 137.12, USDJPY is expected to form a new descending structure to break 134.66 and then continue falling with the target at 133.86.

USDJPY
Risk Warning: the result of previous trading operations do not guarantee the same results in the future

USDCHF, “US Dollar vs Swiss Franc”

USDCHF is still consolidating below 0.9660. Today, the pair may expand the range down to 0.9586 and then resume trading upwards with the target at 0.9738.

USDCHF
Risk Warning: the result of previous trading operations do not guarantee the same results in the future

AUDUSD, “Australian Dollar vs US Dollar”

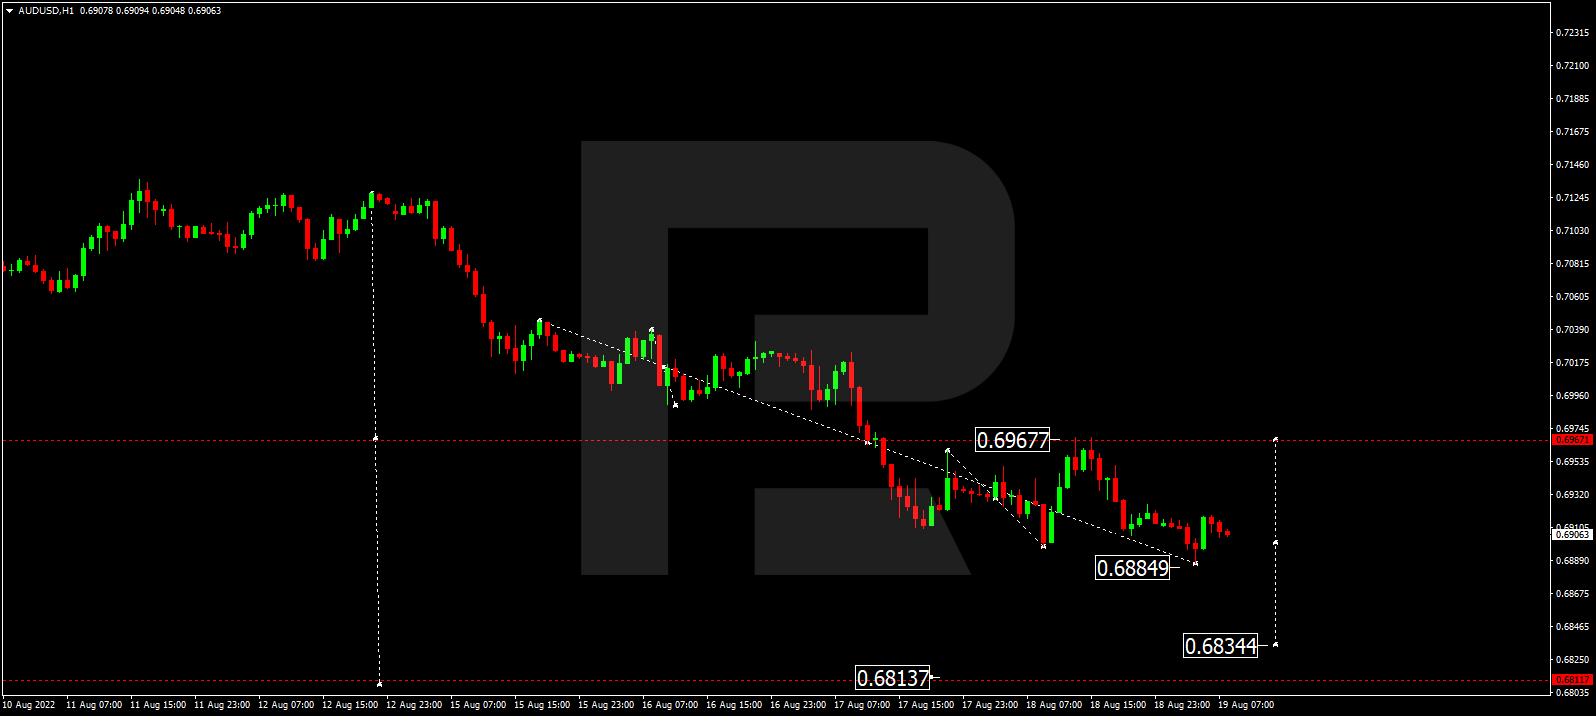
AUDUSD continues falling to break 0.6909. After that, the instrument may continue trading downwards with the short-term target at 0.6858.

AUDUSD
Risk Warning: the result of previous trading operations do not guarantee the same results in the future

BRENT

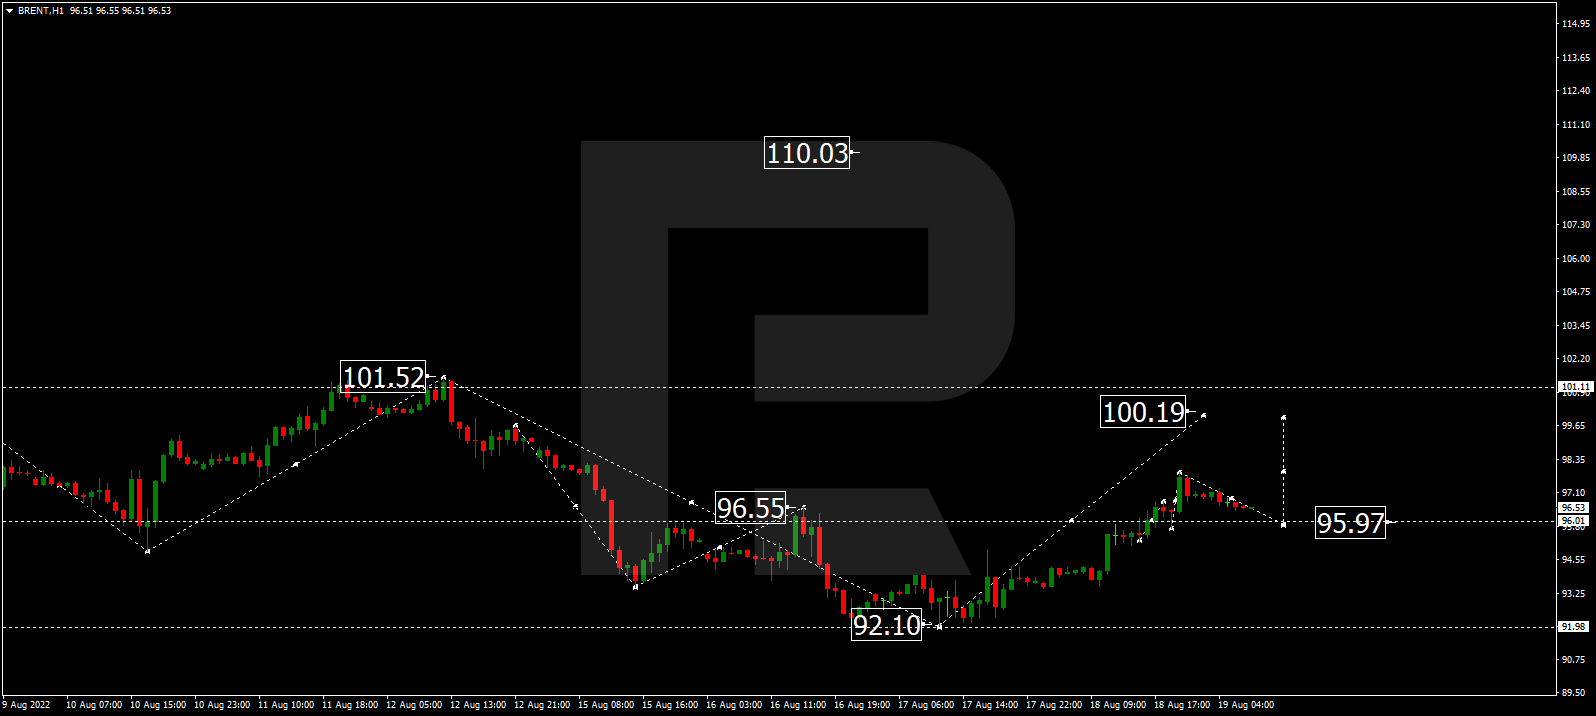
Having finished the correction at 103.15, Brent is expected to consolidate there. If later the price breaks the range to the upside, the market may form one more ascending wave towards 106.45, or even extend this structure to teach the short-term target at 108.85.

BRENT
Risk Warning: the result of previous trading operations do not guarantee the same results in the future

XAUUSD, “Gold vs US Dollar”

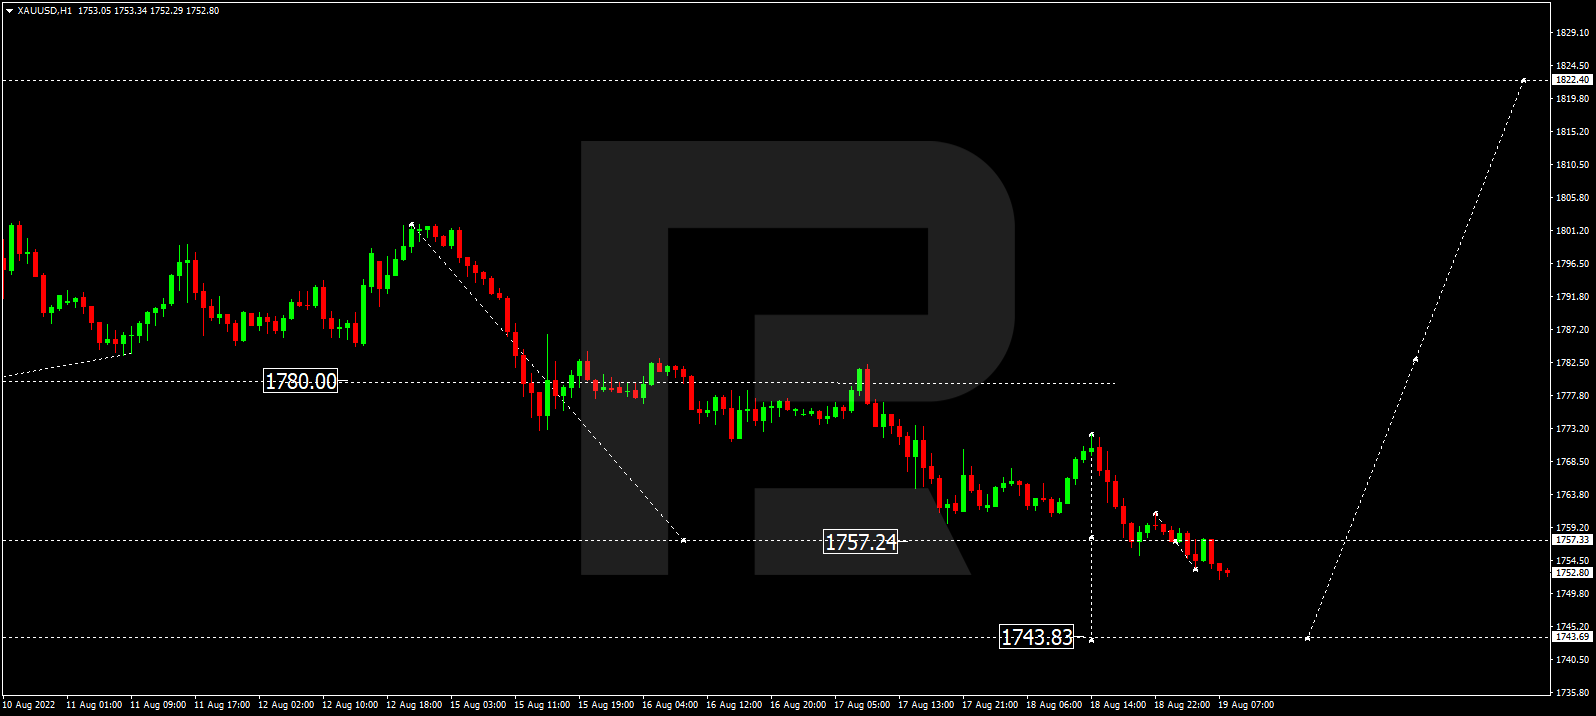
Gold is still correcting down to 1711.44 and may later start another growth to break 1728.85. After that, the instrument may continue trading upwards with the target at 1749.15.

GOLD
Risk Warning: the result of previous trading operations do not guarantee the same results in the future

S&P 500

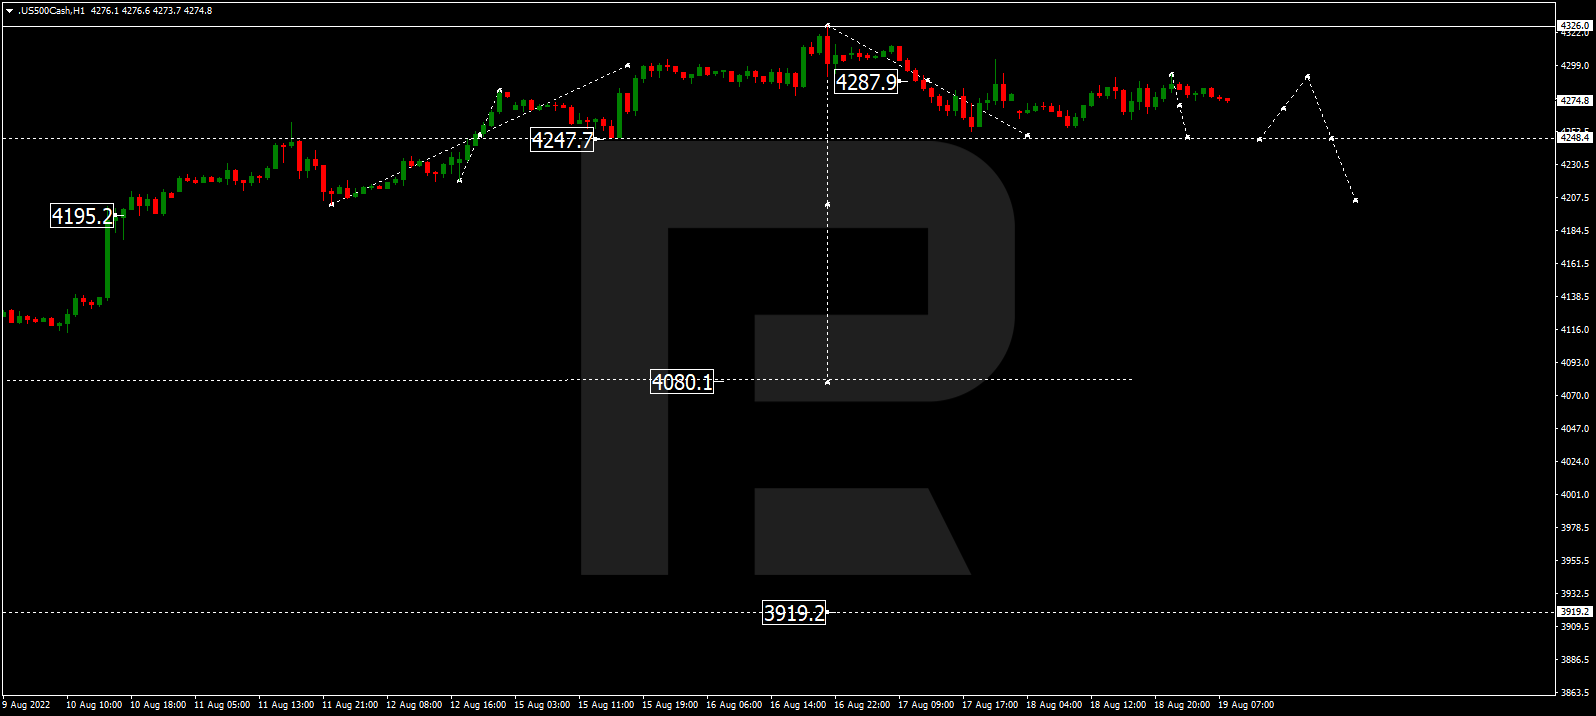
The S&P index is still consolidating above 3919.0. Possibly, the asset may break the range to the upside and reach 4100.0. Later, the market may start a new decline towards 4010.0 and then form one more ascending structure with the target at 4233.0.

S&P 500

Article By RoboForex.com

Attention!
Forecasts presented in this section only reflect the author’s private opinion and should not be considered as guidance for trading. RoboForex LP bears no responsibility for trading results based on trading recommendations described in these analytical reviews.

The Analytical Overview of the Main Currency Pairs on 2022.07.27

By JustForex

The EUR/USD currency pair

Technical indicators of the currency pair:
  • Prev Open: 1.0215
  • Prev Close: 1.0117
  • % chg. over the last day: -0.96%

TOn Tuesday, the dollar rose against a basket of major currencies ahead of an important US Federal Reserve meeting. At the same time, concerns about the possibility of another reduction in Russian gas supplies put pressure on the euro. Hedge fund EDL Capital is betting that the euro will fall to 80 cents to the dollar as rampant inflation fuels volatility in politics and bond markets, which could test the region’s unity. The EDL founder points out that risks related to Russian gas supplies will lead to record inflation in Europe, causing aggressive rate hikes during the recession and forcing Germany to potentially forego the cost of maintaining Eurozone unity.

Trading recommendations
  • Support levels: 1.0120, 1.0035, 1.0000
  • Resistance levels: 1.0171, 1.0202, 1.0250, 1.0284, 1.0365, 1.0415, 1.050

From the technical point of view, the trend on the EUR/USD currency pair on the hourly time frame is bullish. The price is forming a wide balance, but there is seller pressure. The MACD indicator has become negative. Under such market conditions, it is best to look for buy trades on intraday time frames from the support level of 1.0120, but only with confirmation. Sell trades can be considered from the resistance level of 1.0171 or 1.0202, but only after additional confirmation and only with short targets.

Alternative scenario: if the price breaks down through the 1.0035 support level and fixes below, the downtrend will likely resume.

EUR/USD
News feed for 2022.07.27:
  • – US Core Durable Goods Orders (m/m) at 15:30 (GMT+3);
  • – US Pending Home Sales (m/m) at 17:00 (GMT+3);
  • – US Crude Oil Reserves (w/w) at 17:30 (GMT+3);
  • – US FOMC Statement at 21:00 (GMT+3);
  • – US Fed Interest Rate Decision at 21:00 (GMT+3);
  • – US FOMC Press Conference at 21:30 (GMT+3).

The GBP/USD currency pair

Technical indicators of the currency pair:
  • Prev Open: 1.2035
  • Prev Close: 1.2025
  • % chg. over the last day: -0.08%

On Tuesday, the pound sterling hit a two-week high as analysts assessed the prospect of a 50 basis point rate hike by the Bank of England amid a deteriorating economic outlook. But there is also the other side. The worsening economic outlook will pressure the Bank of England to take a less hawkish stance. A Reuters poll of economists indicates that the Bank of England will stick to a gradual 0.25% hike. Currently, the interest rate differential between the US Fed and the Bank of England is in favor of lower GBP/USD quotes.

Trading recommendations
  • Support levels: 1.2027, 1.1907, 1.1803
  • Resistance levels: 1.2056, 1.2085, 1.2137

From the technical point of view, the trend on the GBP/USD currency pair on the hourly time frame is bullish. Buyers’ pressure remains, but there was a false break out of yesterday’s highs. The MACD indicator shows signs of divergence. Under such market conditions, buy trades are best to look at intraday time frames from the support level of 1.2027, but only with confirmation. Sell trades can be considered from the resistance level of 1.2056, but only after additional confirmation and with short targets.

Alternative scenario: if the price breaks down through the 1.1907 support level and fixes below, the downtrend will likely resume.

GBP/USD
News feed for 2022.07.27:
  • – US FOMC Statement at 21:00 (GMT+3);
  • – US Fed Interest Rate Decision at 21:00 (GMT+3);
  • – US FOMC Press Conference at 21:30 (GMT+3).

The USD/JPY currency pair

Technical indicators of the currency pair:
  • Prev Open: 136.65
  • Prev Close: 136.92
  • % chg. over the last day: +0.20%

The US Federal Reserve will raise rates by 0.75-1% today, further widening the gap between the US and Japanese central banks. For the Japanese yen, fundamentally, there is no reason to strengthen right now, as the Bank of Japan is still sticking to its soft monetary policy and is not going to take a hawkish stance anytime soon.

Trading recommendations
  • Support levels: 136.70, 135.99, 135.40, 134.64, 134.11
  • Resistance levels: 137.26, 137.81, 138.25, 138.56, 140.29

From the technical point of view, the medium-term trend on the USD/JPY currency pair is bearish. Any fundamental factors do not accompany the fall in the USD/JPY quotes, so traders should be careful. The price is now trading between the moving averages. The MACD indicator has become positive. Under such market conditions, buy trades can be searched for intraday from the support level of 136.70, but with additional confirmation. For sell deals, traders can consider the resistance level of 137.26 or 137.81, but only with additional confirmation and short targets.

Alternative scenario: If the price fixes above 138.25, the uptrend will likely resume.

USD/JPY
News feed for 2022.07.27:
  • – US FOMC Statement at 21:00 (GMT+3);
  • – US Fed Interest Rate Decision at 21:00 (GMT+3);
  • – US FOMC Press Conference at 21:30 (GMT+3).

The USD/CAD currency pair

Technical indicators of the currency pair:
  • Prev Open: 1.2845
  • Prev Close: 1.2883
  • % chg. over the last day: +0.29%

The Canadian dollar is a commodity currency highly dependent on the US Dollar Index and oil prices. The US Dollar Index got stronger yesterday in anticipation of the Fed meeting on the interest rate, and oil, on the contrary, went down as the United States is selling more reserves amid the worsening of the economic statistics. As a result, the USD/CAD quotes increased. It should be noted that after the US Fed rate hike of 0.75%, the central banks of the US and Canada will have rates at the same level. Therefore, traders should expect a wide sideways movement on this currency pair without any single dynamics in the coming weeks.

Trading recommendations
  • Support levels: 1.2840, 1.2781
  • Resistance levels: 1.2912, 1.3006, 1.3085, 1.3154

In terms of technical analysis, the trend on the USD/CAD currency pair is bearish. At the moment, the price is forming a wide balance and is trading at the levels of the moving lines. The MACD indicator has become inactive again. Under such market conditions, it is best to consider sell deals from the resistance level of 1.2912, but with confirmation. Buy trades should be considered on the lower time frames from the support level 1.2840, but only with confirmation and short targets.

Alternative scenario: if the price breaks out and consolidates above the 1.3006 resistance level, the uptrend will likely be resume.

USD/CAD
News feed for 2022.07.27:
  • – US Crude Oil Reserves (w/w) at 17:30 (GMT+3);
  • – US FOMC Statement at 21:00 (GMT+3);
  • – US Fed Interest Rate Decision at 21:00 (GMT+3);
  • – US FOMC Press Conference at 21:30 (GMT+3).

By JustForex


This article reflects a personal opinion and should not be interpreted as an investment advice, and/or offer, and/or a persistent request for carrying out financial transactions, and/or a guarantee, and/or a forecast of future events.
US economic indicators worsen, but reporting season keeps indices from falling

By JustForex

US consumer confidence fell in July for the third month in a row, indicating a slowdown in growth early in the third quarter. The index was negative, with values worse than economists’ estimates. New home sales in the US fell just over 8% in June from a month earlier and were down double digits from a year earlier, suggesting a weakening housing market due to the rise in mortgages. As the stock market closed yesterday, the Dow Jones Index (US30) decreased by 0.71%, and the S&P 500 Index (US500) lost 1.15%. The NASDAQ Technology Index (US100) gained 0.59% yesterday.

The Fed is having its monetary policy meeting today, where the US central bank will once again raise interest rates. The market has a 77.5% chance of a 75bp hike and a 22.5% chance of a 100bp increase. The Fed is not likely to go against the market, so there is a 0.75% chance of a rate hike. But it is also necessary to be prepared for surprises. The main focus of the market will also be concentrated on the speech of the head of the Fed – Jerome Powell. Mr. Powell will talk about the Fed plans for the future, which will be the basis for the key assets pricing.

Such companies as Meta Platforms (META), T-Mobile US (TMUS), Qualcomm (QCOM), Bristol-Myers Squibb (BMY), Boeing (BA), ADP (ADP), Airbus Group NV (EADSY), Ford Motor (F), Shopify Inc (SHOP) and others will report today. Deutsche Bank analysts said weak Q2 company reports are already “priced in,” so there is a high probability that the market will rise on the publication facts. Optimistic reports from Alphabet (GOOGL) and Microsoft (MSFT) eased investor fears about the bleak economic outlook. More than three-quarters of the firms that have reported earnings so far have either beaten expectations or met them, providing some hope for investors.

Equity markets in Europe were mainly down yesterday. Germany’s DAX (DE30) decreased by 0.86% on Tuesday, France’s CAC 40 (FR 40) lost 0.42%, Spain’s IBEX 35 (ES35) fell by 0.20%, and the British FTSE 100 (UK100) closed at its opening price.

On Monday, Russian energy giant Gazprom, citing instructions from the industry regulator, said that gas flows to Germany through the Nord Stream 1 pipeline will be reduced to 33 million cubic meters per day starting Wednesday, or half of the current flow which was already only 40%. The EDL founder points out that risks associated with Russian gas supplies will lead to record inflation in Europe, causing rates to rise aggressively during the recession.

Oil is getting cheaper as the US sells more reserves amid worsening economic statistics. The White House said it had released about 125 million barrels to make up for a global oil supply shortfall and a spike in fuel prices, which intensified after Russia invaded Ukraine in February.

Asian markets traded flat yesterday. Japan’s Nikkei 225 (JP225) fell by 0.16%, Hong Kong’s Hang Seng (HK50) added 1.67%, and Australia’s S&P/ASX 200 (AU200) was up 0.26% on the day. Global Central Bank rate hikes, the war in Ukraine, and sluggish prospects for the Chinese economy are all putting pressure on investor sentiment in the region.

Australia’s Consumer Price Index increased to 6.1% in annual terms. Inflation rose by 1.8% in the last quarter but was below economists’ forecasts. The rise in inflation is mainly due to higher housing costs and automobile fuel prices. Average annual trimmed inflation, which excludes significant price rises and falls, increased by 4.9%, the highest since 2003. New home prices recorded their largest increase since 1999. The price increases continue to be driven by high construction rates combined with persistent shortages of materials and labor. Fuel prices rose for the eighth consecutive quarter.

US President Joe Biden is scheduled to speak with Chinese President Xi Jinping this Thursday about tensions over Taiwan.

S&P 500 (F) (US500) 3,921.05 −45.79 (−1.15%)

Dow Jones (US30) 31,761.54 −228.50 (−0.71%)

DAX (DE40) 13,096.93 −113.39 (−0.86%)

FTSE 100 (UK100) 7,306.28 −0.020 (−0.003%)

USD Index 107.22 +0.73 (+0.69%)

Important events for today:
  • – Australia Consumer Price Index (m/m) at 04:30 (GMT+3);
  • – US Core Durable Goods Orders (m/m) at 15:30 (GMT+3);
  • – US Pending Home Sales (m/m) at 17:00 (GMT+3);
  • – US Crude Oil Reserves (w/w) at 17:30 (GMT+3);
  • – US FOMC Statement at 21:00 (GMT+3);
  • – US Fed Interest Rate Decision at 21:00 (GMT+3);
  • – US FOMC Press Conference at 21:30 (GMT+3).

By JustForex


This article reflects a personal opinion and should not be interpreted as an investment advice, and/or offer, and/or a persistent request for carrying out financial transactions, and/or a guarantee, and/or a forecast of future events.
Tech firms face more regulation after moves to stop ‘killer’ acquisitions – but innovation could also be under threat

By Renaud Foucart, Lancaster University 

One way to eliminate the competition in business is simply to buy them out and shut them down. And that means less choice for consumers and sometimes the loss of innovative and, in the case of the pharmaceutical industry, even life-saving products. But such so-called killer acquisitions are likely to face greater scrutiny in the US and EU following a recent expansion of competition regulators’ powers.

A July 2022 decision by the European Court of Justice has expanded the European Commission’s ability to investigate a wider range of mergers and acquisitions (M&A). And last year, the US Federal Trade Commission (FTC) also changed its criteria for scrutinising certain deal types.

Historically, these regulators have only been empowered to examine business deals of a certain size, mostly between potential direct competitors. These recent rulings will empower them to examine almost any purchase.

When applying these new powers to fast-moving industries such as pharma or technology, however, regulators must navigate a world of costly and risky investments in research and development. It’s very difficult for regulators to spot a killer acquisition before it happens, and many M&A deals can actually benefit consumers. So calling it wrong could actually stifle innovation and stop new products from reaching the market.

US and EU regulators share the same fear: if dominant players are allowed to buy up start-ups, this could impact innovation and market concentration, depriving consumers of the benefit of new products and technology. In its announcement about its new approach, the FTC said “several decades” of consolidation across the economy has corresponded with a “lessening of competition reflected in growing mark-ups and shrinking wages”.

There is research to support this view. Similarly, EU regulators want to be able to investigate – and potentially prevent – any acquisitions they believe may hurt consumers.

Killer acquisitions

When competition regulators try to ensure that established firms buying small innovative players don’t hinder or even destroy innovation, killer acquisitions are one of their top concerns. As documented in an influential economic paper on the pharmaceutical industry, the goal of the dominant firm in such a deal is to destroy a potential competitor to its own business, even if it means patients never benefit from better treatments.

The recent changes to US and EU M&A scrutiny powers were triggered by a 2020 announcement by US biotech firm Illumina about its plans to acquire Grail, a developer of early-detection cancer tests. At the time, this sounded like the kind of acquisition that would not suffer much scrutiny by antitrust authorities.

Grail’s product is not yet operational and acquiring it does not affect the dominant market position of Illumina. The deal did not even breach the EU merger regulation threshold of €5 billion (£4.3 billion) combined worldwide turnover for the companies involved.

Almost immediately, however, regulators in the US and the EU challenged the merger. Both announced plans to scrutinise its potential impact on competition and innovation in the market for genome-based diagnosis.

In this kind of situation, regulators are often concerned about market concentration. If another start-up comes up with better diagnostic tests, for example, a dominant player like Illumina might make its life difficult in order to protect its recent acquisition.

But killer acquisitions are the most extreme case of this kind of acquisition deal. Research shows that only about 6% of pharma acquisitions involve a large company buying a smaller one with a promising new drug simply to discontinue the innovative project.

In digital markets, dominant firms are also often suspected of pursuing a similar strategy. Last year, the UK regulator ordered Facebook to sell Giphy, a database of GIF-like animations it had acquired in 2020 for US$315 million (£262 million), for fear that it was a killer acquisition aimed at destroying a potential rival in the advertising market. When Meta started its appeal of this decision in April 2022, Giphy had yet to sell a single ad in the UK.

Similar to the pharma sector, however, few tech deals seem to correspond to the specific definition of a killer acquisition. And, in fact, dominant firms buying innovative start-ups before they generate any profit is a common business model in the digital economy.

In 2013, Waze was a potential disruptor to Google Maps as the dominant firm in the market for free online maps. But when Google acquired it for US$1.1 billion, it did not close Waze, as you would expect with a killer acquisition.

Instead, it added some of Waze’s innovative features into Google Maps and kept the former as a niche product. This allowed Google to stay dominant and to boost its profits from user data.

In this case, consumers benefited from a better Google Maps product, but Waze now has less incentive to innovate because it is not competing anymore. The FTC did not oppose the acquisition in 2013 but is now reportedly considering looking at it again.

Regulators’ big gamble

If regulators routinely block such acquisitions, start-ups will need to operate differently. Rather than relying on an acquisition by a dominant player to inject capital into the company, they will have to find other ways to earn money – possibly by charging consumers directly.

WhatsApp and Instagram, for example, had almost no revenue when Facebook bought them for US$19 billion and US$1 billion respectively. But they benefited from being acquired by a larger platform. Neither were killer acquisitions, but both increased market concentration.

By opening acquisitions of small and innovative firms to more scrutiny, regulators are taking a massive bet. To block an acquisition, they must demonstrate that it actually hurts innovation, often in very technical fields.

While researchers have been able to identify killer acquisitions after the fact, convincing a judge at the time of the purchase that a deal is bad for consumers is much more difficult. As such, the stakes are high for regulators: a wrong decision could affect the future of medicine and the future of our digital lives.The Conversation

About the Author:

Renaud Foucart, Senior Lecturer in Economics, Lancaster University Management School, Lancaster University

This article is republished from The Conversation under a Creative Commons license. Read the original article.


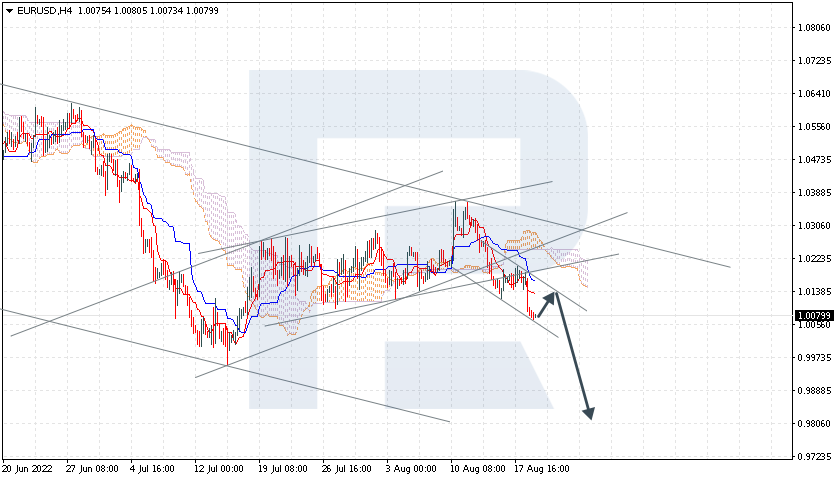
Ichimoku Cloud Analysis 26.07.2022 (EURUSD, XAUUSD, NZDUSD)

Article By RoboForex.com

URUSD, “Euro vs US Dollar”

As we can see in the H4 chart, after forming a Shooting Star reversal pattern close to the resistance area, the asset is moving sideways. At the moment, EURUSD may reverse in the form of another descending impulse. In this case, the downside target may be at 1.0110. However, an alternative scenario implies that the price may correct to reach 1.0340 and continue the downtrend only after testing the resistance area.

EURUSD
Risk Warning: the result of previous trading operations do not guarantee the same results in the future

USDJPY, “US Dollar vs Japanese Yen”

As we can see in the H4 chart, USDJPY has formed a Hammer reversal pattern not far from the support area. At the moment, the asset may reverse and form a new ascending impulse. In this case, the upside target may be at 137.80. At the same time, an opposite scenario implies that the price may correct to reach 135.70 and continue the uptrend only after testing the support area.

USDJPY
Risk Warning: the result of previous trading operations do not guarantee the same results in the future

EURGBP, “Euro vs Great Britain Pound”

As we can see in the H4 chart, after forming an Engulfing reversal pattern near the resistance area, EURGBP is reversing in the form of a new descending impulse. In this case, the downside target may be the support level at 0.8420. Later, the market may test this level, break it, and continue moving downwards. Still, there might be an alternative scenario, in which the asset may correct to reach 0.8550 before testing 0.8420.

EURGBP

Article By RoboForex.com

Attention!
Forecasts presented in this section only reflect the author’s private opinion and should not be considered as guidance for trading. RoboForex LP bears no responsibility for trading results based on trading recommendations described in these analytical reviews.