Archive for Financial News – Page 313

Bond yields move lower, stocks too

By ForexTime

Asian stocks have kicked off August on the back foot as US-China tensions stir safe-haven demand. This follows on from US equities, that snapped a three-day win streak after capping their best month since 2020 last week. Trading volumes are typically thinner during summer as European traders especially are running flat trading books during the holiday season. This means volumes will be a fraction of the size of normal trading activity which can exacerbate price action and swings. These were certainly seen intraday yesterday as the broad S&P500 index moved between gains and losses.

Yesterday’s falls across the pond followed on from a gain of more than 9% for the blue-chip S&P500 in July and a 12.3% increase in the tech-heavy Nasdaq that marked the tech benchmark’s strongest month since April 2020. Easing expectations for interest rate rises and positive earnings updates from several big tech and energy companies were the two key drivers of this summer rally. The question on many investors’ lips has been if the low is now in place, or if this is a bear market rally in a broader downtrend?

On the technical side, the S&P500 has hit the 100-day simple moving average at 4121 in a resistance zone with the February low at 4114. The halfway point of the March to June move is also near at 4137.

Data Dependent traders

Market participants are now watching data more closely too, after Fed Chair Powell, and President Lagarde, and the ECB, bailed out of offering forward guidance to investors and markets. Probably this is an honest admission that policymakers don’t know what the economy is going to do next. Instead, they are now data dependent and yesterday’s main economic indicator painted a cloudy picture at best.

The US ISM slipped to 52.9 in July, its lowest level since June 2020. Any figure above 50 indicates an expansion, but the latest result points to a slowdown in growth.  But the ISM’s index did provide an encouraging gauge that cost pressures may be easing on companies. The sub-index fell to a near two-year low, well below the estimates of economists.

Falling bond yields take down USD/JPY

The high in USD/JPY seems a distant memory today from when it was posted in mid-July above 139. The major is correlated with US 10-year rate differentials, mainly due to the Bank of Japan’s commitment to yield curve control. This effectively means where the US 10-year Treasury yield goes, so to does USD/JPY. And those yields have fallen sharply as markets have scaled back their expectations of how much the Fed will tighten policy to curb red-hot inflation. From a high close to 3.5%, the US 10-year yield is now nearing 2.5% after dropping below the lower bound of the recent sideways trading range around 2.7%. This is a mighty fall in bond markets and has weighed heavily on USD/JPY.

The major is back below 135 and smashed down through the next major support at 131.34 overnight. The latest US wage and inflation data may slow the descent of US yields. But the yen may retain a small bid on growing odds of a US recession as the Fed hiking cycle continues. This week’s bid for safe haven assets as US House Speaker Pelosi gears up to visit Taiwan is also helping the yen. The 100-day simple moving average could offer support at 130.12 as prices go into overbought territory.


Forex-Time-LogoArticle by ForexTime

ForexTime Ltd (FXTM) is an award winning international online forex broker regulated by CySEC 185/12 www.forextime.com

Crude Oil Prices Continue to Be Under Pressure

By RoboForex Analytical Department

The commodity sector remains rather tense on Monday; Brent is trading at $102.75.

Global geopolitics is what investors are focused on right now. Any complications in this area muddy the water one way or another, and it’s bad news. Last weekend, the Kosovo situation escalated – a gas pipeline “Balkan Stream” is going through Serbia, which doesn’t recognise the independence of Kosovo. The pipeline delivers natural gas from “TurkStream” to Hungary.

Later this week, OPEC and OPECF+ will have meetings. The OPEC+ agreement is ending in August and the organisations are set to discuss options to increase oil production. First of all, it depends on Saudi Arabia, a country that still has the potential for oil extraction expansion. However, Saudis don’t seem to be interested in it.

The latest report from Baker Hughes showed that over the past week, the Oil Rig Count in the US gained 6 units, up to 605. In Canada, the indicator increased by 13 units, up to 137.

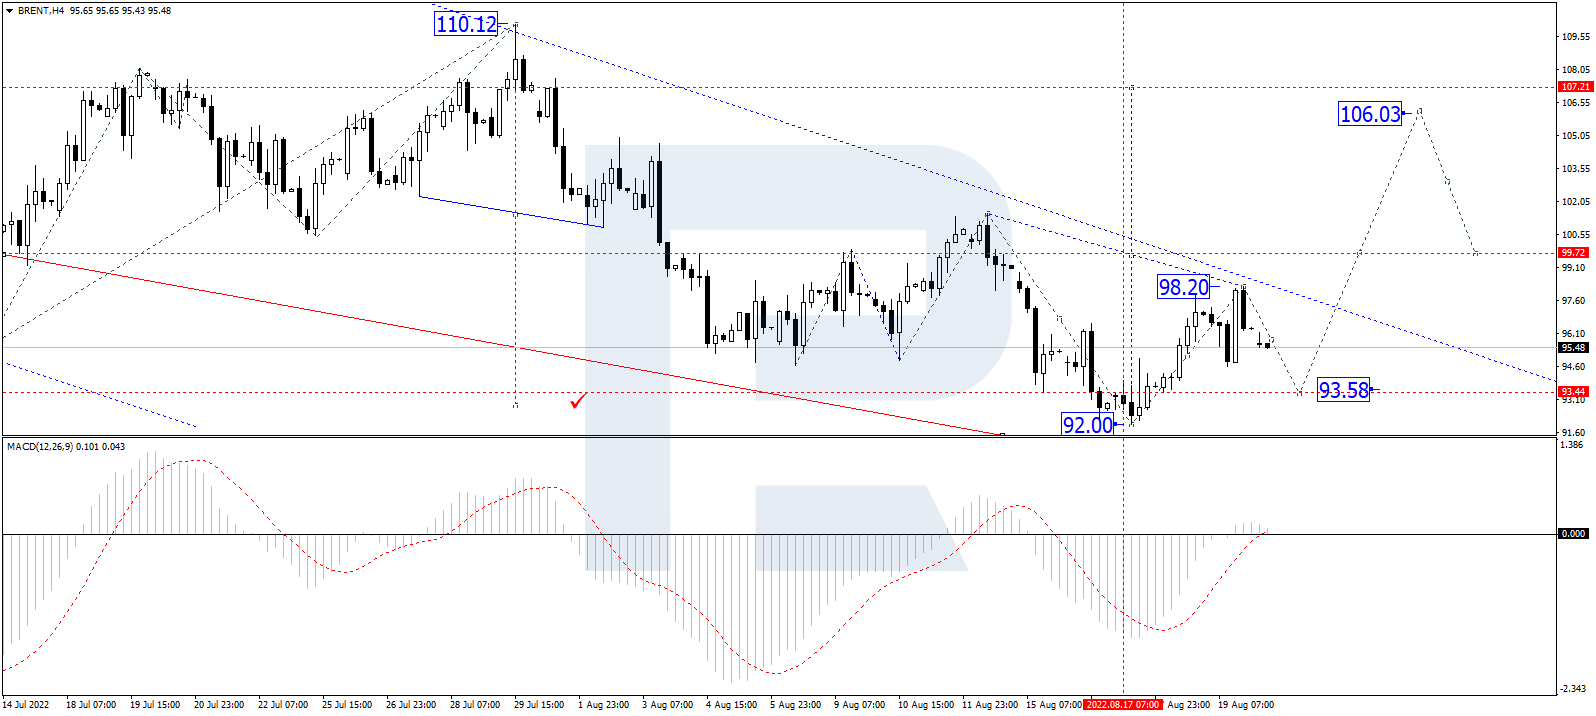
On the H4 chart, Brent is forming the third ascending wave with the target at 111.55 and may later correct down to 106.16. After that, the instrument may resume trading upwards with the short-term target at 118.80. From the technical point of view, this scenario is confirmed by the MACD Oscillator: its signal line is moving above 0 inside the histogram area. Both the line and the price chart may yet continue to move upwards.

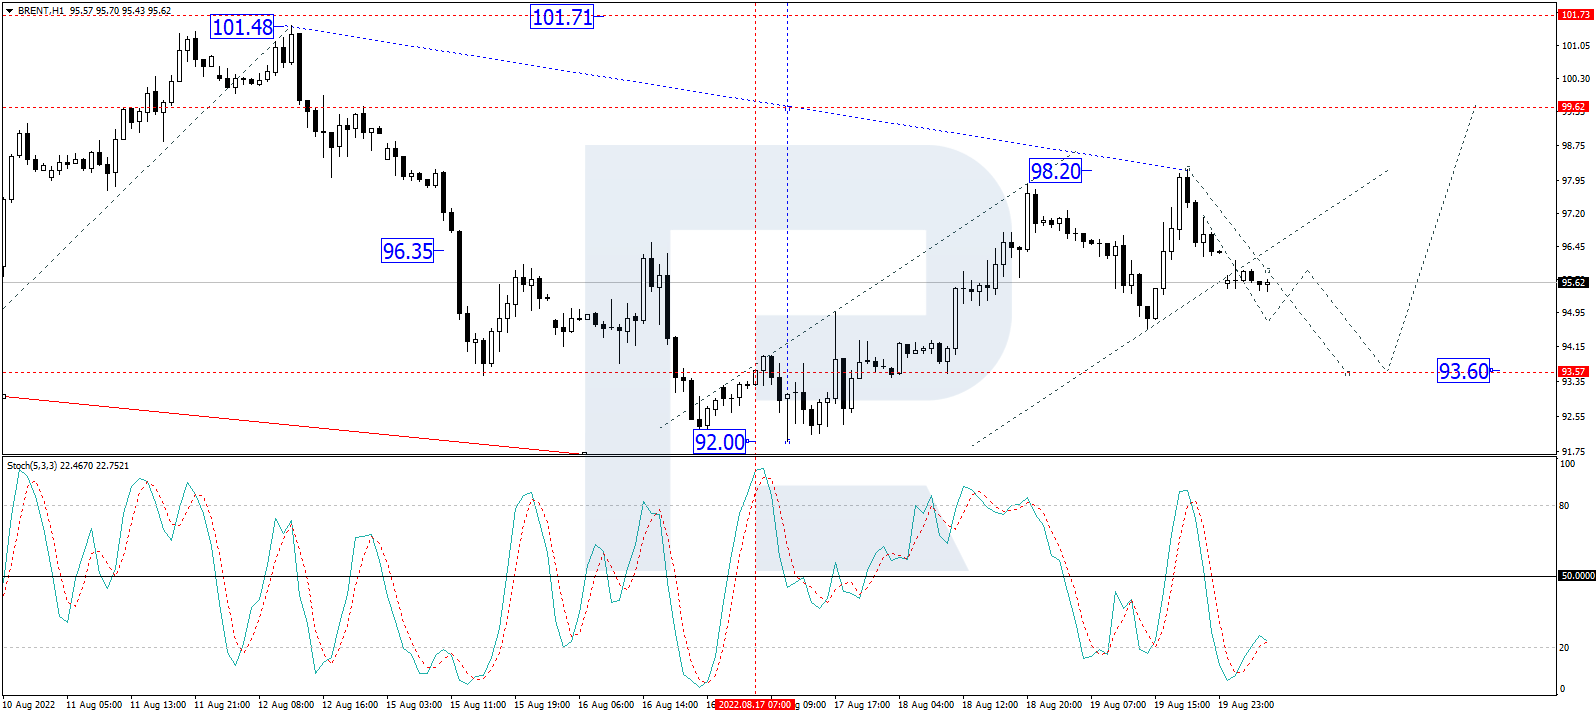
As we can see in the H1 chart, after finishing the descending correctional structure at 106.16, Brent is consolidating above this level. Possibly, the asset may break the range to the upside and start another growth with the target at 111.55, or even extends this structure up to 118.70. From the technical point of view, this idea is confirmed by the Stochastic Oscillator: after breaking 20, its signal line is heading towards 50. Later, the line may break the latter level and continue growing to reach 80.

Disclaimer

Any forecasts contained herein are based on the author’s particular opinion. This analysis may not be treated as trading advice. RoboForex bears no responsibility for trading results based on trading recommendations and reviews contained herein.

Ichimoku Cloud Analysis 01.08.2022 (EURUSD, XAUUSD, AUDUSD)

Article By RoboForex.com

EURUSD, “Euro vs US Dollar”

EURUSD continues testing the bearish channel’s upside border. The instrument is currently moving above Ichimoku Cloud, thus indicating an ascending tendency. The markets could indicate that the price may re-test the cloud’s upside border at 1.0175 and then resume moving upwards to reach 1.0405. Another signal in favour of a further uptrend will be a rebound from the rising channel’s downside border. However, the bullish scenario may no longer be valid if the price breaks the cloud’s downside border and fixes below 1.0085. In this case, the pair may continue falling towards 0.9990. To confirm a further uptrend, the price must break the bearish channel’s upside border and fix above 1.0275.

EURUSD
Risk Warning: the result of previous trading operations do not guarantee the same results in the future

XAUUSD, “Gold vs US Dollar”

XAUUSD is rebounding from Tenkan-Sen and Kijun-Sen. The instrument is currently moving above Ichimoku Cloud, thus indicating an ascending tendency. The markets could indicate that the price may test Kijun-Sen at 1740.00 and then resume moving upwards to reach 1820.00. Another signal in favour of a further uptrend will be a rebound from the rising channel’s downside border. However, the bullish scenario may no longer be valid if the price breaks the cloud’s downside border and fixes below 1700.00. In this case, the pair may continue falling towards 1655.00.

XAUUSD
Risk Warning: the result of previous trading operations do not guarantee the same results in the future

AUDUSD, “Australian Dollar vs US Dollar”

AUDUSD is growing inside the bullish channel. The instrument is currently moving above Ichimoku Cloud, thus indicating an ascending tendency. The markets could indicate that the price may test Tenkan-Sen at 0.6960 and then resume moving upwards to reach 0.7150. Another signal in favour of a further uptrend will be a rebound from the rising channel’s downside border. However, the bullish scenario may no longer be valid if the price breaks the cloud’s downside border and fixes below 0.6805. In this case, the pair may continue falling towards 0.6710.

AUDUSD
Risk Warning: the result of previous trading operations do not guarantee the same results in the future

Article By RoboForex.com

Attention!
Forecasts presented in this section only reflect the author’s private opinion and should not be considered as guidance for trading. RoboForex LP bears no responsibility for trading results based on trading recommendations described in these analytical reviews.

Forex Technical Analysis & Forecast for August 2022

Article By RoboForex.com

EURUSD, “Euro vs US Dollar”

As we can see in the daily chart, after reaching the short-term downside target at 0.9964, EURUSD has completed the ascending impulse along with the correction; right now, it is forming one more ascending structure towards 1.0360 and may later consolidate there. If the price breaks the range to the upside, the market may start another growth with the short-term target at 1.0616 or even extend this correctional wave up to 1.0764. After that, the instrument may resume trading within the downtrend to reach 0.9300.

EURUSD
Risk Warning: the result of previous trading operations do not guarantee the same results in the future

GBPUSD, “Great Britain Pound vs US Dollar”

On the daily chart, GBPUSD has finished the ascending impulse at 1.2222. Possibly, the pair may correct down to 1.2000 and then resume growing with the short-term target at 1.2444. The entire ascending structure is considered a correction of the previous decline towards 1.2665. After the correction is over, the instrument may start a new decline with the target at 1.1690, or even extend this wave down to 1.1500.

GBPUSD
Risk Warning: the result of previous trading operations do not guarantee the same results in the future

USDJPY, “US Dollar vs Japanese Yen”

On the daily chart, having completed the descending wave at 132.22, USDJPY is expected to grow and test 135.08 from below. Later, the market may resume falling with the first target at 130.37 and then start another correction up to 135.10.

USDJPY
Risk Warning: the result of previous trading operations do not guarantee the same results in the future

BRENT

As we can see in the daily chart, after finishing the first ascending impulse at 108.00 along with the correction down to 100.00, Brent is expected to form the third ascending wave towards 118.18. Later, the market may correct to test 108.00 from above and then continue growing with the first target at 122.00.

BRENT
Risk Warning: the result of previous trading operations do not guarantee the same results in the future

XAUUSD, “Gold vs US Dollar”

On the daily chart, having completed the first ascending impulse along with the correction, Gold is forming one more ascending wave with the first target at 1799.33. After that, the instrument may correct down to 1740.00, and then resume growing to reach 1855.00, or even extend this structure up to 1888.30.

GOLD
Risk Warning: the result of previous trading operations do not guarantee the same results in the future

S&P 500

On the daily chart, the S&P index is still correcting up 4163.6 and may later start a new decline towards 3900.0. After that, the instrument may complete this ascending wave by reaching 4208.0, and then resume trading downwards with the target at 3500.0.

S&P 500

Article By RoboForex.com

Attention!
Forecasts presented in this section only reflect the author’s private opinion and should not be considered as guidance for trading. RoboForex LP bears no responsibility for trading results based on trading recommendations described in these analytical reviews.

The Analytical Overview of the Main Currency Pairs on 2022.08.01

By JustForex

The EUR/USD currency pair

Technical indicators of the currency pair:
  • Prev Open: 1.0197
  • Prev Close: 1.0225
  • % chg. over the last day: +0.27%

Inflation in the Eurozone broke another record and rose to 8.9% in July (8.6% in June). The energy price boom continues, and the geopolitical factors behind it show no signs of abating. The Overall Energy Index increased to 39.7% y/y as gas prices continue to rise and their carryover to consumer prices increases. Along with energy, food has become a very large contributor to inflation as food prices have already increased to 9.8% y/y. Eurozone GDP showed growth of +0.7%, which came as a surprise to analysts. Spain, France, and Italy showed the most considerable GDP growth. Germany’s GDP was unchanged from January-March. Germany was one of the countries hit hardest by high energy prices and problems in global supply chains.

Trading recommendations
  • Support levels: 1.0112, 1.0035, 1.0000
  • Resistance levels: 1.0284, 1.0365, 1.0415, 1.050

From the technical point of view, the trend on the EUR/USD currency pair on the hourly time frame is bullish. The price is still forming a wide volatile balance, and buyer pressure prevails now. The MACD indicator is in the positive zone. Under such market conditions, buy trades are best sought on intraday time frames from the support level of 1.0112. Sell trades can be considered from the resistance level of 1.0284, but only after additional confirmation and only with short targets.

Alternative scenario: if the price breaks down through the 1.0112 support level and fixes below, the downtrend will likely resume.

EUR/USD
News feed for 2022.08.01:
  • – German Retail Sales (m/m) at 09:00 (GMT+3);
  • – Spanish Manufacturing PMI (m/m) at 10:15 (GMT+3);
  • – Italian Manufacturing PMI (m/m) at 10:45 (GMT+3);
  • – French Manufacturing PMI (m/m) at 10:50 (GMT+3);
  • – German Manufacturing PMI (m/m) at 10:55 (GMT+3);
  • – Eurozone Manufacturing PMI (m/m) at 11:00 (GMT+3);
  • – US ISM Manufacturing PMI (m/m) at 17:00 (GMT+3).

The GBP/USD currency pair

Technical indicators of the currency pair:
  • Prev Open: 1.2165
  • Prev Close: 1.2174
  • % chg. over the last day: +0.07%

The Bank of England intends to accelerate its fight against inflation. The Bank of England will hold its monetary policy and interest rate meetings this week, where it is expected (70% probability) to raise the rate by another 0.5%. This move will mark the UK’s most significant interest rate hike in 27 years. Bank of England governor Andrew Bailey suggested at a previous speech that this hike would not be the last, saying that policymakers are willing to act “decisively” if necessary to combat inflation. It should not be forgotten that there is a struggle for the Prime minister’s chair in Britain. Foreign Secretary Liz Truss has promised tax cuts if she wins the race for the leadership of the ruling Conservative Party. Former Chancellor of the Exchequer Rishi Sunak says this will increase inflation, forcing interest rates to go even higher.

Trading recommendations
  • Support levels: 1.2150, 1.2114, 1.2063, 1.1907, 1.1803
  • Resistance levels: 1.2191, 1.2238, 1.2294

From the technical point of view, the GBP/USD currency pair trend on the hourly time frame is bullish. But sellers’ pressure is increasing again. The MACD indicator is in the positive zone but shows signs of divergence already in several time frames. Under such market conditions, it is better to look for buy trades on the intraday time frames from the support level 1.2150 or 1.2114, but only with confirmation. Sell trades can be considered from the resistance level of 1.2191, but only after additional confirmation and with short targets.

Alternative scenario: if the price breaks down through the 1.2006 support level and fixes below, the downtrend will likely resume.

GBP/USD
News feed for 2022.08.01:
  • – UK Manufacturing PMI (m/m) at 11:30 (GMT+3).

The USD/JPY currency pair

Technical indicators of the currency pair:
  • Prev Open: 134.23
  • Prev Close: 133.21
  • % chg. over the last day: -0.76%

Japan included currency response measures as items to consider in its fiscal year 2023 budget, which is due later this year, budget guidance showed Friday, warning investors against selling the yen. Currencies are rarely mentioned in the annual budget guidance, so the inclusion underscores policymakers’ concerns about the rapid sell-off in the yen, which has raised living costs and hurt the terms of trade underscored by the trade deficit.

Trading recommendations
  • Support levels: 131.67, 130.99
  • Resistance levels: 133.17, 134.00, 135.10, 136.03, 137.11

From the technical point of view, the medium-term trend on the USD/JPY currency pair is bearish. In the last trading sessions, the Japanese yen is getting stronger. The MACD indicator has become negative, and the sellers’ pressure is still there, but there are signs of divergence. Under such market conditions, buy trades can be sought from the support level of 131.67, but with additional confirmation. Resistance levels of 133.17 or 134.00 may be considered for sell deals, but only with additional confirmation and short targets.

Alternative scenario: If the price fixes above 136.03, the uptrend will likely resume.

USD/JPY
News feed for 2022.08.01:
  • – Japan Manufacturing PMI (m/m) at 03:30 (GMT+3).

The USD/CAD currency pair

Technical indicators of the currency pair:
  • Prev Open: 1.2806
  • Prev Close: 1.2804
  • % chg. over the last day: -0.02%

Real Gross Domestic Product (GDP) was unchanged in May after growing 0.3% in April. Growth in service-producing industries (+0.4%) was offset by a decline in goods-producing industries (-1.0%). Canada’s manufacturing sector contracted by 1.7% in May after seven months of growth. Output rose in the construction, manufacturing, accommodation, and catering sectors. Declines were recorded in mining, quarrying, oil and gas extraction, financial and insurance, and professional scientific and technical services sectors.

Trading recommendations
  • Support levels: 1.2781
  • Resistance levels: 1.2880, 1.2923, 1.3006, 1.3085, 1.3154

In terms of technical analysis, the USD/CAD currency pair trend is bearish. Currently, the price is forming a wide balance and trading on the lower border of the descending channel. The MACD indicator is in the negative zone, but there is a divergence, which indicates that it is harder for the price to move lower. Under such market conditions, it is better to consider sell deals from the resistance level of 1.2880, but with confirmation. Buy trades should be considered on the lower time frames from the support level of 1.2781 or from the lower border of the channel, but only with confirmation and short targets.

Alternative scenario: if the price breaks out and consolidates above the 1.3006 resistance level, the uptrend will likely resume.

USD/CAD
There is no news feed for today.

By JustForex


This article reflects a personal opinion and should not be interpreted as an investment advice, and/or offer, and/or a persistent request for carrying out financial transactions, and/or a guarantee, and/or a forecast of future events.


China vs. Taiwan, Serbia vs. Kosovo – new military conflicts are already around the corner

By JustForex

The US Personal Consumer Expenditures (PCE) inflation rate, closely monitored by the Fed, is at its highest since January 1982. The PCE increased to 6.8% in June. The core PCE (which excludes food and fuel prices) was up 4.8% from a year ago and up 0.1% from May. The Employment Cost Index, another figure that Fed policymakers keep a close eye on, rose by 1.3% in the second quarter. The Index added 5.1% in 12 months, a record for a series of data tracked since 2002. Markets expect the Fed to raise rates another 0.5% in September, according to the FedWatch CME Group tracker. However, the probability of a larger three-quarter-point hike rose to 38% Friday morning.

As the stock market closed Friday, the Dow Jones Index (US30) increased by 0.97% (+2.80% for the week, +6.73% for the month ), and the S&P 500 Index (US500) added 1.42% (+4.15% for the week, +9.11% for the month). The Technology Index NASDAQ (US100) gained 1.88% on Friday (+4.67% for the week, +12.35% for the month).

Equity markets in Europe were mostly up on Friday. German DAX (DE30) added 1.52% (weekly result +2.25%, monthly result +5.24%), French CAC 40 (FR40) grew by 1.72% (weekly result +4.03%, monthly result +8.72%), Spanish Index IBEX 35 (ES35) increased by 0.88% (+1.69% for the week, -0.24% for the month), British FTSE 100 (UK100) gained 1.06% (+2.02% for the week, +3.55% for the month).

Inflation in the Eurozone broke another record and rose to 8.9% in July (8.6% in June). The energy price boom continues, and the geopolitical factors behind it show no signs of abating. Analysts expect gas supplies from Russia to remain very limited as winter approaches, putting upward pressure on energy prices. In Germany, the government recently decided to impose an energy tax on consumers starting in October. This means that inflation in Germany could rise above 10%.

Eurozone GDP growth of 0.7% QoQ was unexpectedly strong. Experts had predicted a 0.5% growth, and the consensus was even more pessimistic. The most substantial increase was in Spain (+1.1%), where GDP levels are still below pre-pandemic levels. Analysts expect Spain to benefit from a rebound in foreign tourism this summer and show positive growth numbers in the coming quarters, even if very high inflation hurts households in Spain more than in many other Eurozone countries. Growth was also strong in France (+0.5%) and Italy (+1.0%). Data from France showed that while consumption remained weak, fixed investment and exports supported growth. In Germany, GDP was unchanged from January-March. Germany was one of the countries hit hardest by high energy prices and problems in global supply chains, so the weak growth figures were not a surprise.

The media are reporting on armed clashes on the Serbian-Kosovo border. The Serbian army is on high alert, and the Serbian presidential party is already hinting at “denazification.” Serbia is an ally of Russia, and Kosovo seeks EU and NATO membership. Serbia is behaving very much like Russia before the Russians attacked Ukraine.

Asian markets traded higher last week. Japan’s Nikkei 225 (JP225) added 0.38% for the week (+7.19% for the month), Hong Kong’s Hang Seng (HK50) lost 1.75% last week (-7.67% for the month), and Australia’s S&P/ASX 200 (AU200) was up by 2.26% for the week (monthly result +6.20%).

The situation between Taiwan and China is escalating. Under the guise of exercises, China is redeploying military equipment in the province of Fujian, which is located only 180 kilometers from Taiwan. The transfer of military equipment began just after a Thursday conversation between the US president and China. US Speaker Pelosi’s planned visit to Taiwan provoked an extremely negative reaction from China, which threatened the US with unpredictable consequences, including that the Chinese People’s Liberation Army would shoot down the US speaker’s plane.

The Japanese government will not impose a cap on the defense budget request for the next fiscal year, stressing its determination to increase spending to counter China’s military assertiveness. The government will also allocate about 4.4 trillion yen ($33.12 billion) to Kishida’s “new capitalism” program, which aims to invest in green and digital transformation areas.

After more than two years, New Zealand is fully opening its borders and welcoming all international travelers. According to the New Zealand Ministry of Health, travelers need a rapid antigen test on the day of arrival and a second test on the fifth or sixth day of their trip. Masks are not required outdoors, but they are required indoors.

In the commodities market, natural gas (+27.52%) and palladium (+9.09%) futures showed the biggest gains in July. Gasoline futures (-17.24%), wheat (-12.72%), lumber (-10.06%), Brent oil (-10.55%), WTI oil (-10.46%), corn (-6.85%), sugar (-5.13%), copper (-4.92%), and coffee (-4.69%) showed the biggest drops in July.

S&P 500 (F) (US500) 4,130.29 +57.86 (+1.42%)

Dow Jones (US30) 32,845.13 +315.50 (+0.97%)

DAX (DE40) 13,484.05 +201.94 (+1.52%)

FTSE 100 (UK100) 7,423.43 +78.18 (+1.06%)

USD Index 105.83 −0.52 (−0.49%)

Important events for today:
  • – Japan Manufacturing PMI (m/m) at 03:30 (GMT+3);
  • – China Caixin Manufacturing PMI (m/m) at 04:45 (GMT+3);
  • – German Retail Sales (m/m) at 09:00 (GMT+3);
  • – Spanish Manufacturing PMI (m/m) at 10:15 (GMT+3);
  • – Italian Manufacturing PMI (m/m) at 10:45 (GMT+3);
  • – French Manufacturing PMI (m/m) at 10:50 (GMT+3);
  • – German Manufacturing PMI (m/m) at 10:55 (GMT+3);
  • – Eurozone Manufacturing PMI (m/m) at 11:00 (GMT+3);
  • – UK Manufacturing PMI (m/m) at 11:30 (GMT+3);
  • – US ISM Manufacturing PMI (m/m) at 17:00 (GMT+3).

By JustForex


This article reflects a personal opinion and should not be interpreted as an investment advice, and/or offer, and/or a persistent request for carrying out financial transactions, and/or a guarantee, and/or a forecast of future events.

Chart Spotlight: Tellurian Inc. (TELL)

By Ino.com

Natural gas prices are exploding.

For one, Russia said it would cut natural gas shipments to Europe.

In fact, as noted by Barron’s, “Russian company Gazprom said on Monday that it will cut natural gas shipments from the key Nord Stream pipeline to Germany starting this week. The pipeline’s exports will be cut to 20% of capacity, down from 40%, because of a sanctions-related issue with turbines serving the pipeline.”

Two, there are drought conditions in the U.S., and a heat wave forcing millions to turn up their air conditioners to full blast.

Three, according to EQT CEO Toby Rice, as quoted by Barron’s, “In the United States, we’ve got the natural gas here, we’ll be fine. But you think about our allies in Europe, and the tremendous power and influence that Russia has on these countries. Clearly, we need to take away the gun, and provide the energy to our allies around the world.”

All could create a big opportunity for natural gas stocks, like Tellurian (TELL).

Tellurian – a $2.1 billion company – is “building a low-cost, global natural gas business, profitably delivering natural gas to customers worldwide.”

Better, the company could benefit from a substantial shortage of natural gas.

In fact, according to its latest investor deck, geopolitics and energy security providing a step change in global LNG demand. Tellurian notes there’s (1) underinvestment in energy and post-CV structural growth have collided with a geopolitical crisis; (2) A need to replace 20 Bcf/d of Russian gas to Europe, equivalent to ~35% of the world’s LNG market; (3) Natural gas shortage expected to lead to catastrophic consequences.

Technically, according to MarketClub, shares of TELL are slightly overbought. The MarketClub Smart Scan also gives the stock a score of +60, which tells us at the moment, the stock is struggling to move in a solid trend.

However, with natural gas prices showing no signs of cooling off, I’d like to see the stock run from a current price of $3.68 to $5, near-term.

The MarketClub Trade Triangles are also mostly green.

While it’s telling us that the longer-term trend has been down over the last month, the intermediate trend has been strong since mid-July. In addition, the short-term trend, according to Market Club, has been up since mid-July as well.

TELL Chart with Trade Triangles

Source: MarketClub
 

Ian Cooper
INO.com Contributor

The above analysis of Tellurian Inc. (TELL) was provided by financial writer Ian Cooper. Ian Cooper is not a Registered Investment Advisor or Financial Planner. This writing is for informational purposes only. It does not constitute an offer to sell, a solicitation to buy, or a recommendation regarding any securities transaction. The information contained in this writing should not be construed as financial or investment advice on any subject matter. Ian Cooper expressly disclaims all liability in respect to actions taken based on any or all of the information on this writing.

By Ino.com – See our Trader Blog, INO TV Free & Market Analysis Alerts

Source: Chart Spotlight: Tellurian Inc. (TELL)

COT Week 30 Charts: Bonds Speculators bets fall this week led by 10-Year & 5-Year Bonds

By InvestMacro | COT | Data Tables | COT Leaders | Downloads | COT Newsletter

Here are the latest charts and statistics for the Commitment of Traders (COT) data published by the Commodities Futures Trading Commission (CFTC).

The latest COT data is updated through Tuesday July 26th and shows a quick view of how large traders (for-profit speculators and commercial entities) were positioned in the futures markets.

Weekly Speculator Changes

COT bond market speculator bets were lower this week as just two out of the eight bond markets we cover had higher positioning this week while the other six markets had lower contracts.

Leading the gains for the bond markets was the Fed Funds Futures (33,590 contracts) with the Ultra 10-Year (4,781 contracts) also showing a positive week.

The bond markets leading the declines in speculator bets this week were the 10-Year Bond (-91,156 contracts) and the 5-Year Bond (-57,158 contracts) with the Eurodollar (-40,034 contracts), the 2-Year Bond (-26,811 contracts), the Long US Bond (-4,543 contracts) and the Ultra US Bond (-4,479 contracts) also having lower bets on the week.


Data Snapshot of Bond Market Traders | Columns Legend
Jul-26-2022OIOI-IndexSpec-NetSpec-IndexCom-NetCOM-IndexSmalls-NetSmalls-Index
Eurodollar9,398,09211-2,683,93942,957,40994-273,47044
FedFunds1,885,79971147,16858-139,54943-7,61940
2-Year2,018,24410-89,86464160,60455-70,74019
Long T-Bond1,183,49942-46,6456928,8962117,74967
10-Year3,504,78030-199,86042266,23454-66,37464
5-Year3,988,92951-315,17328449,86968-134,69644


Strength Scores

Strength Scores (a normalized measure of Speculator positions over a 3-Year range, from 0 to 100 where above 80 is extreme bullish and below 20 is extreme bearish) showed that the US Treasury Bond (69.4 percent) continues to lead the strength scores although it has been cooling off over the past weeks. The 2-Year Bond (64.1 percent) and the Fed Funds (57.8 percent) come in as the next highest bonds markets in strength scores this week with both over 50 percent (or the midway point of their 3-year range). On the downside, the Eurodollar (3.5 percent) comes in at the lowest strength level currently – at an extreme bearish position and near the bottom of its three-year range. The Ultra 10-Year Bond is the next lowest at 20.8 percent followed by the 5-Year Bond (27.9 percent).


Strength Statistics:
Fed Funds (57.8 percent) vs Fed Funds previous week (53.6 percent)
2-Year Bond (64.1 percent) vs 2-Year Bond previous week (69.5 percent)
5-Year Bond (27.9 percent) vs 5-Year Bond previous week (37.9 percent)
10-Year Bond (42.1 percent) vs 10-Year Bond previous week (55.9 percent)
Ultra 10-Year Bond (20.8 percent) vs Ultra 10-Year Bond previous week (19.5 percent)
US Treasury Bond (69.4 percent) vs US Treasury Bond previous week (70.9 percent)
Ultra US Treasury Bond (42.3 percent) vs Ultra US Treasury Bond previous week (44.1 percent)
Eurodollar (3.5 percent) vs Eurodollar previous week (4.3 percent)

Strength Trends

Strength Score Trends (or move index, calculates the 6-week changes in strength scores) showed that the 2-Year Bond (14.2 percent) leads the past six weeks trends for bonds this week. The Ultra 10-Year Bond (13.1 percent), the Fed Funds (4.5 percent) and the 10-Year Bond (0.9 percent) round out the only other positive movers in the latest trends data. The 5-Year Bond (-21.8 percent) leads the downside trend scores currently while the next markets with lower trend scores were the Eurodollar (-15.3 percent) followed by the US Treasury Bond (-5.6 percent).

Strength Trend Statistics:
Fed Funds (4.5 percent) vs Fed Funds previous week (7.3 percent)
2-Year Bond (14.2 percent) vs 2-Year Bond previous week (21.7 percent)
5-Year Bond (-21.8 percent) vs 5-Year Bond previous week (-6.2 percent)
10-Year Bond (0.9 percent) vs 10-Year Bond previous week (23.9 percent)
Ultra 10-Year Bond (13.1 percent) vs Ultra 10-Year Bond previous week (10.4 percent)
US Treasury Bond (-5.6 percent) vs US Treasury Bond previous week (-15.3 percent)
Ultra US Treasury Bond (-3.5 percent) vs Ultra US Treasury Bond previous week (-12.6 percent)
Eurodollar (-15.3 percent) vs Eurodollar (0.0 percent)


Individual Markets

3-Month Eurodollars Futures:

Eurodollar Bonds Futures COT ChartThe 3-Month Eurodollars large speculator standing this week came in at a net position of -2,683,939 contracts in the data reported through Tuesday. This was a weekly fall of -40,034 contracts from the previous week which had a total of -2,643,905 net contracts.

This week’s current strength score (the trader positioning range over the past three years, measured from 0 to 100) shows the speculators are currently Bearish-Extreme with a score of 3.5 percent. The commercials are Bullish-Extreme with a score of 93.9 percent and the small traders (not shown in chart) are Bearish with a score of 44.3 percent.

3-Month Eurodollars StatisticsSPECULATORSCOMMERCIALSSMALL TRADERS
– Percent of Open Interest Longs:4.271.54.4
– Percent of Open Interest Shorts:32.840.17.3
– Net Position:-2,683,9392,957,409-273,470
– Gross Longs:397,5706,724,178413,933
– Gross Shorts:3,081,5093,766,769687,403
– Long to Short Ratio:0.1 to 11.8 to 10.6 to 1
NET POSITION TREND:
– Strength Index Score (3 Year Range Pct):3.593.944.3
– Strength Index Reading (3 Year Range):Bearish-ExtremeBullish-ExtremeBearish
NET POSITION MOVEMENT INDEX:
– 6-Week Change in Strength Index:-15.313.120.9


30-Day Federal Funds Futures:Federal Funds 30-Day Bonds Futures COT ChartThe 30-Day Federal Funds large speculator standing this week came in at a net position of 147,168 contracts in the data reported through Tuesday. This was a weekly advance of 33,590 contracts from the previous week which had a total of 113,578 net contracts.

This week’s current strength score (the trader positioning range over the past three years, measured from 0 to 100) shows the speculators are currently Bullish with a score of 57.8 percent. The commercials are Bearish with a score of 42.9 percent and the small traders (not shown in chart) are Bearish with a score of 40.3 percent.

30-Day Federal Funds StatisticsSPECULATORSCOMMERCIALSSMALL TRADERS
– Percent of Open Interest Longs:15.471.41.7
– Percent of Open Interest Shorts:7.678.82.1
– Net Position:147,168-139,549-7,619
– Gross Longs:290,9671,346,03732,709
– Gross Shorts:143,7991,485,58640,328
– Long to Short Ratio:2.0 to 10.9 to 10.8 to 1
NET POSITION TREND:
– Strength Index Score (3 Year Range Pct):57.842.940.3
– Strength Index Reading (3 Year Range):BullishBearishBearish
NET POSITION MOVEMENT INDEX:
– 6-Week Change in Strength Index:4.5-2.9-31.0


2-Year Treasury Note Futures:

2-Year Treasury Bonds Futures COT ChartThe 2-Year Treasury Note large speculator standing this week came in at a net position of -89,864 contracts in the data reported through Tuesday. This was a weekly decrease of -26,811 contracts from the previous week which had a total of -63,053 net contracts.

This week’s current strength score (the trader positioning range over the past three years, measured from 0 to 100) shows the speculators are currently Bullish with a score of 64.1 percent. The commercials are Bullish with a score of 55.0 percent and the small traders (not shown in chart) are Bearish-Extreme with a score of 19.1 percent.

2-Year Treasury Note StatisticsSPECULATORSCOMMERCIALSSMALL TRADERS
– Percent of Open Interest Longs:11.980.06.8
– Percent of Open Interest Shorts:16.372.010.3
– Net Position:-89,864160,604-70,740
– Gross Longs:239,9801,613,664137,474
– Gross Shorts:329,8441,453,060208,214
– Long to Short Ratio:0.7 to 11.1 to 10.7 to 1
NET POSITION TREND:
– Strength Index Score (3 Year Range Pct):64.155.019.1
– Strength Index Reading (3 Year Range):BullishBullishBearish-Extreme
NET POSITION MOVEMENT INDEX:
– 6-Week Change in Strength Index:14.2-14.8-1.2


5-Year Treasury Note Futures:

5-Year Treasury Bonds Futures COT ChartThe 5-Year Treasury Note large speculator standing this week came in at a net position of -315,173 contracts in the data reported through Tuesday. This was a weekly fall of -57,158 contracts from the previous week which had a total of -258,015 net contracts.

This week’s current strength score (the trader positioning range over the past three years, measured from 0 to 100) shows the speculators are currently Bearish with a score of 27.9 percent. The commercials are Bullish with a score of 68.2 percent and the small traders (not shown in chart) are Bearish with a score of 44.0 percent.

5-Year Treasury Note StatisticsSPECULATORSCOMMERCIALSSMALL TRADERS
– Percent of Open Interest Longs:7.983.97.1
– Percent of Open Interest Shorts:15.872.710.5
– Net Position:-315,173449,869-134,696
– Gross Longs:314,6963,348,396283,150
– Gross Shorts:629,8692,898,527417,846
– Long to Short Ratio:0.5 to 11.2 to 10.7 to 1
NET POSITION TREND:
– Strength Index Score (3 Year Range Pct):27.968.244.0
– Strength Index Reading (3 Year Range):BearishBullishBearish
NET POSITION MOVEMENT INDEX:
– 6-Week Change in Strength Index:-21.89.412.8


10-Year Treasury Note Futures:

10-Year Treasury Notes Bonds Futures COT ChartThe 10-Year Treasury Note large speculator standing this week came in at a net position of -199,860 contracts in the data reported through Tuesday. This was a weekly lowering of -91,156 contracts from the previous week which had a total of -108,704 net contracts.

This week’s current strength score (the trader positioning range over the past three years, measured from 0 to 100) shows the speculators are currently Bearish with a score of 42.1 percent. The commercials are Bullish with a score of 53.5 percent and the small traders (not shown in chart) are Bullish with a score of 63.8 percent.

10-Year Treasury Note StatisticsSPECULATORSCOMMERCIALSSMALL TRADERS
– Percent of Open Interest Longs:7.680.110.0
– Percent of Open Interest Shorts:13.372.511.9
– Net Position:-199,860266,234-66,374
– Gross Longs:266,8142,805,832351,590
– Gross Shorts:466,6742,539,598417,964
– Long to Short Ratio:0.6 to 11.1 to 10.8 to 1
NET POSITION TREND:
– Strength Index Score (3 Year Range Pct):42.153.563.8
– Strength Index Reading (3 Year Range):BearishBullishBullish
NET POSITION MOVEMENT INDEX:
– 6-Week Change in Strength Index:0.9-12.824.0


Ultra 10-Year Notes Futures:

Ultra 10-Year Treasury Notes Bonds Futures COT ChartThe Ultra 10-Year Notes large speculator standing this week came in at a net position of -30,926 contracts in the data reported through Tuesday. This was a weekly advance of 4,781 contracts from the previous week which had a total of -35,707 net contracts.

This week’s current strength score (the trader positioning range over the past three years, measured from 0 to 100) shows the speculators are currently Bearish with a score of 20.8 percent. The commercials are Bullish with a score of 79.1 percent and the small traders (not shown in chart) are Bearish with a score of 47.0 percent.

Ultra 10-Year Notes StatisticsSPECULATORSCOMMERCIALSSMALL TRADERS
– Percent of Open Interest Longs:5.183.011.3
– Percent of Open Interest Shorts:7.870.021.6
– Net Position:-30,926151,176-120,250
– Gross Longs:59,468967,242131,774
– Gross Shorts:90,394816,066252,024
– Long to Short Ratio:0.7 to 11.2 to 10.5 to 1
NET POSITION TREND:
– Strength Index Score (3 Year Range Pct):20.879.147.0
– Strength Index Reading (3 Year Range):BearishBullishBearish
NET POSITION MOVEMENT INDEX:
– 6-Week Change in Strength Index:13.1-16.18.2


US Treasury Bonds Futures:

US Year Treasury Notes Long Bonds Futures COT ChartThe US Treasury Bonds large speculator standing this week came in at a net position of -46,645 contracts in the data reported through Tuesday. This was a weekly decline of -4,543 contracts from the previous week which had a total of -42,102 net contracts.

This week’s current strength score (the trader positioning range over the past three years, measured from 0 to 100) shows the speculators are currently Bullish with a score of 69.4 percent. The commercials are Bearish with a score of 20.9 percent and the small traders (not shown in chart) are Bullish with a score of 66.7 percent.

US Treasury Bonds StatisticsSPECULATORSCOMMERCIALSSMALL TRADERS
– Percent of Open Interest Longs:7.077.914.4
– Percent of Open Interest Shorts:11.075.512.9
– Net Position:-46,64528,89617,749
– Gross Longs:83,344922,508169,862
– Gross Shorts:129,989893,612152,113
– Long to Short Ratio:0.6 to 11.0 to 11.1 to 1
NET POSITION TREND:
– Strength Index Score (3 Year Range Pct):69.420.966.7
– Strength Index Reading (3 Year Range):BullishBearishBullish
NET POSITION MOVEMENT INDEX:
– 6-Week Change in Strength Index:-5.6-5.325.6


Ultra US Treasury Bonds Futures:

Ultra US Year Treasury Notes Long Bonds Futures COT ChartThe Ultra US Treasury Bonds large speculator standing this week came in at a net position of -350,261 contracts in the data reported through Tuesday. This was a weekly decrease of -4,479 contracts from the previous week which had a total of -345,782 net contracts.

This week’s current strength score (the trader positioning range over the past three years, measured from 0 to 100) shows the speculators are currently Bearish with a score of 42.3 percent. The commercials are Bullish with a score of 62.5 percent and the small traders (not shown in chart) are Bullish with a score of 63.2 percent.

Ultra US Treasury Bonds StatisticsSPECULATORSCOMMERCIALSSMALL TRADERS
– Percent of Open Interest Longs:3.784.411.7
– Percent of Open Interest Shorts:30.161.78.0
– Net Position:-350,261301,56848,693
– Gross Longs:49,1911,120,969154,740
– Gross Shorts:399,452819,401106,047
– Long to Short Ratio:0.1 to 11.4 to 11.5 to 1
NET POSITION TREND:
– Strength Index Score (3 Year Range Pct):42.362.563.2
– Strength Index Reading (3 Year Range):BearishBullishBullish
NET POSITION MOVEMENT INDEX:
– 6-Week Change in Strength Index:-3.5-4.813.3


Article By InvestMacroReceive our weekly COT Reports by Email

*COT Report: The COT data, released weekly to the public each Friday, is updated through the most recent Tuesday (data is 3 days old) and shows a quick view of how large speculators or non-commercials (for-profit traders) were positioned in the futures markets.

The CFTC categorizes trader positions according to commercial hedgers (traders who use futures contracts for hedging as part of the business), non-commercials (large traders who speculate to realize trading profits) and nonreportable traders (usually small traders/speculators) as well as their open interest (contracts open in the market at time of reporting).See CFTC criteria here.

COT Week 30 Charts: Soft Commodities Speculator bets slightly higher led by Live Cattle & Soybean Meal

By InvestMacro | COT | Data Tables | COT Leaders | Downloads | COT Newsletter

Here are the latest charts and statistics for the Commitment of Traders (COT) data published by the Commodities Futures Trading Commission (CFTC).

The latest COT data is updated through Tuesday July 26th and shows a quick view of how large traders (for-profit speculators and commercial entities) were positioned in the futures markets.

Weekly Speculator Changes

COT soft commodities speculator bets were overall slightly higher this week as six out of the eleven soft commodities markets we cover had higher positioning this week while the other five markets had lower contracts.

Leading the gains for soft commodities markets was Live Cattle (13,971 contracts) and Soybean Meal (5,833 contracts) with Lean Hogs (5,802 contracts), Cocoa (4,010 contracts), Cotton (1,447 contracts) and Coffee (662 contracts) also showing a positive weeks.

The softs markets leading the declines in speculator bets this week were Sugar (-63,059 contracts) and Corn (-23,412 contracts) with Soybeans (-17,352 contracts), Wheat (-6,497 contracts) and Soybean Oil (-6,295 contracts) also seeing lower bets on the week.


Data Snapshot of Commodity Market Traders | Columns Legend
Jul-26-2022OIOI-IndexSpec-NetSpec-IndexCom-NetCOM-IndexSmalls-NetSmalls-Index
WTI Crude1,597,4512259,2600-283,48910024,22949
Gold487,5151092,6900-108,42210015,7320
Silver147,78414-4,5000-2,6531007,1534
Copper183,95815-26,5622326,83978-27724
Palladium7,1244-3,40843,89497-48616
Platinum73,42345-4,4682-171984,63927
Natural Gas976,1264-118,2904383,0285735,26264
Brent177,83722-41,4824240,5576192522
Heating Oil269,1272318,68470-33,5313614,84750
Soybeans583,850085,24140-57,57366-27,66824
Corn1,320,7682186,52854-138,89952-47,62916
Coffee199,536528,64164-28,867432262
Sugar722,469464,10350-65,756561,65310
Wheat301,674625198,06871-8,09368


Strength Scores

Strength Scores (a normalized measure of Speculator positions over a 3-Year range, from 0 to 100 where above 80 is extreme bullish and below 20 is extreme bearish) show that Soybean Meal (86.8 percent) has seen rising speculator sentiment recently and is currently in a bullish extreme position (above 80 percent). Coffee (63.6 percent) comes in as the next highest soft commodity markets market in strength scores followed by Corn (53.9 percent) and Sugar (49.8 percent). On the downside, Wheat (19.1 percent) comes in at the lowest strength level currently, followed by Soybean Oil (19.9 percent) and both of these markets have bearish extreme readings.


Strength Statistics:
Corn (53.9 percent) vs Corn previous week (56.8 percent)
Sugar (49.8 percent) vs Sugar previous week (62.8 percent)
Coffee (63.6 percent) vs Coffee previous week (63.0 percent)
Soybeans (40.1 percent) vs Soybeans previous week (45.4 percent)
Soybean Oil (19.9 percent) vs Soybean Oil previous week (24.1 percent)
Soybean Meal (86.8 percent) vs Soybean Meal previous week (83.5 percent)
Live Cattle (24.4 percent) vs Live Cattle previous week (6.9 percent)
Lean Hogs (45.3 percent) vs Lean Hogs previous week (39.0 percent)
Cotton (47.6 percent) vs Cotton previous week (46.7 percent)
Cocoa (21.0 percent) vs Cocoa previous week (17.0 percent)
Wheat (19.1 percent) vs Wheat previous week (27.5 percent)

Strength Trends

Strength Score Trends (or move index, calculates the 6-week changes in strength scores) show that the Lean Hogs (30.5 percent) leads the past six weeks trends for soft commodity markets this week. Soybean Meal (9.8 percent), Cocoa (6.6 percent) and Live Cattle (4.0 percent) fill out the only other positive movers in the latest trends data. Soybean Oil (-34.9 percent) leads the downside trend scores currently while the next markets with lower trend scores were Soybeans (-29.6 percent), Corn (-27.2 percent), Wheat (-26.6 percent) and Sugar (-21.9 percent).


Strength Trend Statistics:
Corn (-27.2 percent) vs Corn previous week (-23.2 percent)
Sugar (-21.9 percent) vs Sugar previous week (-14.0 percent)
Coffee (-15.8 percent) vs Coffee previous week (-18.0 percent)
Soybeans (-29.6 percent) vs Soybeans previous week (-22.5 percent)
Soybean Oil (-34.9 percent) vs Soybean Oil previous week (-34.2 percent)
Soybean Meal (9.8 percent) vs Soybean Meal previous week (6.1 percent)
Live Cattle (4.0 percent) vs Live Cattle previous week (-4.4 percent)
Lean Hogs (30.5 percent) vs Lean Hogs previous week (20.8 percent)
Cotton (-17.3 percent) vs Cotton previous week (-21.0 percent)
Cocoa (6.6 percent) vs Cocoa previous week (-14.8 percent)
Wheat (-26.6 percent) vs Wheat previous week (-22.6 percent)


Individual Markets:

CORN Futures:

CORN Futures COT ChartThe CORN large speculator standing this week recorded a net position of 186,528 contracts in the data reported through Tuesday. This was a weekly decline of -23,412 contracts from the previous week which had a total of 209,940 net contracts.

This week’s current strength score (the trader positioning range over the past three years, measured from 0 to 100) shows the speculators are currently Bullish with a score of 53.9 percent. The commercials are Bullish with a score of 52.1 percent and the small traders (not shown in chart) are Bearish-Extreme with a score of 15.6 percent.

CORN Futures StatisticsSPECULATORSCOMMERCIALSSMALL TRADERS
– Percent of Open Interest Longs:25.049.29.7
– Percent of Open Interest Shorts:10.959.713.3
– Net Position:186,528-138,899-47,629
– Gross Longs:330,027649,795128,521
– Gross Shorts:143,499788,694176,150
– Long to Short Ratio:2.3 to 10.8 to 10.7 to 1
NET POSITION TREND:
– Strength Index Score (3 Year Range Pct):53.952.115.6
– Strength Index Reading (3 Year Range):BullishBullishBearish-Extreme
NET POSITION MOVEMENT INDEX:
– 6-Week Change in Strength Index:-27.229.24.6


SUGAR Futures:

SUGAR Futures COT ChartThe SUGAR large speculator standing this week recorded a net position of 64,103 contracts in the data reported through Tuesday. This was a weekly lowering of -63,059 contracts from the previous week which had a total of 127,162 net contracts.

This week’s current strength score (the trader positioning range over the past three years, measured from 0 to 100) shows the speculators are currently Bearish with a score of 49.8 percent. The commercials are Bullish with a score of 55.7 percent and the small traders (not shown in chart) are Bearish-Extreme with a score of 9.9 percent.

SUGAR Futures StatisticsSPECULATORSCOMMERCIALSSMALL TRADERS
– Percent of Open Interest Longs:25.252.49.0
– Percent of Open Interest Shorts:16.361.58.8
– Net Position:64,103-65,7561,653
– Gross Longs:181,773378,48664,876
– Gross Shorts:117,670444,24263,223
– Long to Short Ratio:1.5 to 10.9 to 11.0 to 1
NET POSITION TREND:
– Strength Index Score (3 Year Range Pct):49.855.79.9
– Strength Index Reading (3 Year Range):BearishBullishBearish-Extreme
NET POSITION MOVEMENT INDEX:
– 6-Week Change in Strength Index:-21.925.1-32.0


COFFEE Futures:

COFFEE Futures COT ChartThe COFFEE large speculator standing this week recorded a net position of 28,641 contracts in the data reported through Tuesday. This was a weekly advance of 662 contracts from the previous week which had a total of 27,979 net contracts.

This week’s current strength score (the trader positioning range over the past three years, measured from 0 to 100) shows the speculators are currently Bullish with a score of 63.6 percent. The commercials are Bearish with a score of 43.0 percent and the small traders (not shown in chart) are Bearish-Extreme with a score of 1.6 percent.

COFFEE Futures StatisticsSPECULATORSCOMMERCIALSSMALL TRADERS
– Percent of Open Interest Longs:23.253.73.8
– Percent of Open Interest Shorts:8.968.23.7
– Net Position:28,641-28,867226
– Gross Longs:46,313107,1557,626
– Gross Shorts:17,672136,0227,400
– Long to Short Ratio:2.6 to 10.8 to 11.0 to 1
NET POSITION TREND:
– Strength Index Score (3 Year Range Pct):63.643.01.6
– Strength Index Reading (3 Year Range):BullishBearishBearish-Extreme
NET POSITION MOVEMENT INDEX:
– 6-Week Change in Strength Index:-15.817.7-11.8


SOYBEANS Futures:

SOYBEANS Futures COT ChartThe SOYBEANS large speculator standing this week recorded a net position of 85,241 contracts in the data reported through Tuesday. This was a weekly reduction of -17,352 contracts from the previous week which had a total of 102,593 net contracts.

This week’s current strength score (the trader positioning range over the past three years, measured from 0 to 100) shows the speculators are currently Bearish with a score of 40.1 percent. The commercials are Bullish with a score of 66.3 percent and the small traders (not shown in chart) are Bearish with a score of 24.3 percent.

SOYBEANS Futures StatisticsSPECULATORSCOMMERCIALSSMALL TRADERS
– Percent of Open Interest Longs:24.654.36.4
– Percent of Open Interest Shorts:10.064.211.2
– Net Position:85,241-57,573-27,668
– Gross Longs:143,708317,20437,501
– Gross Shorts:58,467374,77765,169
– Long to Short Ratio:2.5 to 10.8 to 10.6 to 1
NET POSITION TREND:
– Strength Index Score (3 Year Range Pct):40.166.324.3
– Strength Index Reading (3 Year Range):BearishBullishBearish
NET POSITION MOVEMENT INDEX:
– 6-Week Change in Strength Index:-29.629.3-1.1


SOYBEAN OIL Futures:

SOYBEAN OIL Futures COT ChartThe SOYBEAN OIL large speculator standing this week recorded a net position of 21,030 contracts in the data reported through Tuesday. This was a weekly reduction of -6,295 contracts from the previous week which had a total of 27,325 net contracts.

This week’s current strength score (the trader positioning range over the past three years, measured from 0 to 100) shows the speculators are currently Bearish-Extreme with a score of 19.9 percent. The commercials are Bullish-Extreme with a score of 82.4 percent and the small traders (not shown in chart) are Bearish with a score of 22.6 percent.

SOYBEAN OIL Futures StatisticsSPECULATORSCOMMERCIALSSMALL TRADERS
– Percent of Open Interest Longs:17.559.46.9
– Percent of Open Interest Shorts:11.865.86.3
– Net Position:21,030-23,4772,447
– Gross Longs:64,485218,59025,574
– Gross Shorts:43,455242,06723,127
– Long to Short Ratio:1.5 to 10.9 to 11.1 to 1
NET POSITION TREND:
– Strength Index Score (3 Year Range Pct):19.982.422.6
– Strength Index Reading (3 Year Range):Bearish-ExtremeBullish-ExtremeBearish
NET POSITION MOVEMENT INDEX:
– 6-Week Change in Strength Index:-34.938.5-42.0


SOYBEAN MEAL Futures:

SOYBEAN MEAL Futures COT ChartThe SOYBEAN MEAL large speculator standing this week recorded a net position of 106,507 contracts in the data reported through Tuesday. This was a weekly advance of 5,833 contracts from the previous week which had a total of 100,674 net contracts.

This week’s current strength score (the trader positioning range over the past three years, measured from 0 to 100) shows the speculators are currently Bullish-Extreme with a score of 86.8 percent. The commercials are Bearish-Extreme with a score of 17.2 percent and the small traders (not shown in chart) are Bearish with a score of 36.0 percent.

SOYBEAN MEAL Futures StatisticsSPECULATORSCOMMERCIALSSMALL TRADERS
– Percent of Open Interest Longs:29.841.011.5
– Percent of Open Interest Shorts:3.072.96.5
– Net Position:106,507-126,39419,887
– Gross Longs:118,336162,66145,699
– Gross Shorts:11,829289,05525,812
– Long to Short Ratio:10.0 to 10.6 to 11.8 to 1
NET POSITION TREND:
– Strength Index Score (3 Year Range Pct):86.817.236.0
– Strength Index Reading (3 Year Range):Bullish-ExtremeBearish-ExtremeBearish
NET POSITION MOVEMENT INDEX:
– 6-Week Change in Strength Index:9.8-6.1-31.1


LIVE CATTLE Futures:

LIVE CATTLE Futures COT ChartThe LIVE CATTLE large speculator standing this week recorded a net position of 35,927 contracts in the data reported through Tuesday. This was a weekly rise of 13,971 contracts from the previous week which had a total of 21,956 net contracts.

This week’s current strength score (the trader positioning range over the past three years, measured from 0 to 100) shows the speculators are currently Bearish with a score of 24.4 percent. The commercials are Bullish with a score of 65.5 percent and the small traders (not shown in chart) are Bullish with a score of 78.2 percent.

LIVE CATTLE Futures StatisticsSPECULATORSCOMMERCIALSSMALL TRADERS
– Percent of Open Interest Longs:35.638.712.3
– Percent of Open Interest Shorts:21.452.612.7
– Net Position:35,927-34,885-1,042
– Gross Longs:89,82297,76630,957
– Gross Shorts:53,895132,65131,999
– Long to Short Ratio:1.7 to 10.7 to 11.0 to 1
NET POSITION TREND:
– Strength Index Score (3 Year Range Pct):24.465.578.2
– Strength Index Reading (3 Year Range):BearishBullishBullish
NET POSITION MOVEMENT INDEX:
– 6-Week Change in Strength Index:4.0-6.55.5


LEAN HOGS Futures:

LEAN HOGS Futures COT ChartThe LEAN HOGS large speculator standing this week recorded a net position of 35,421 contracts in the data reported through Tuesday. This was a weekly advance of 5,802 contracts from the previous week which had a total of 29,619 net contracts.

This week’s current strength score (the trader positioning range over the past three years, measured from 0 to 100) shows the speculators are currently Bearish with a score of 45.3 percent. The commercials are Bullish with a score of 61.3 percent and the small traders (not shown in chart) are Bullish with a score of 53.8 percent.

LEAN HOGS Futures StatisticsSPECULATORSCOMMERCIALSSMALL TRADERS
– Percent of Open Interest Longs:38.035.19.6
– Percent of Open Interest Shorts:21.048.213.6
– Net Position:35,421-27,182-8,239
– Gross Longs:79,02273,07419,948
– Gross Shorts:43,601100,25628,187
– Long to Short Ratio:1.8 to 10.7 to 10.7 to 1
NET POSITION TREND:
– Strength Index Score (3 Year Range Pct):45.361.353.8
– Strength Index Reading (3 Year Range):BearishBullishBullish
NET POSITION MOVEMENT INDEX:
– 6-Week Change in Strength Index:30.5-32.4-3.4


COTTON Futures:

COTTON Futures COT ChartThe COTTON large speculator standing this week recorded a net position of 39,198 contracts in the data reported through Tuesday. This was a weekly rise of 1,447 contracts from the previous week which had a total of 37,751 net contracts.

This week’s current strength score (the trader positioning range over the past three years, measured from 0 to 100) shows the speculators are currently Bearish with a score of 47.6 percent. The commercials are Bullish with a score of 53.9 percent and the small traders (not shown in chart) are Bearish with a score of 26.1 percent.

COTTON Futures StatisticsSPECULATORSCOMMERCIALSSMALL TRADERS
– Percent of Open Interest Longs:37.345.56.4
– Percent of Open Interest Shorts:15.968.05.2
– Net Position:39,198-41,4052,207
– Gross Longs:68,50283,61811,696
– Gross Shorts:29,304125,0239,489
– Long to Short Ratio:2.3 to 10.7 to 11.2 to 1
NET POSITION TREND:
– Strength Index Score (3 Year Range Pct):47.653.926.1
– Strength Index Reading (3 Year Range):BearishBullishBearish
NET POSITION MOVEMENT INDEX:
– 6-Week Change in Strength Index:-17.320.1-45.7


COCOA Futures:

COCOA Futures COT ChartThe COCOA large speculator standing this week recorded a net position of 3,408 contracts in the data reported through Tuesday. This was a weekly rise of 4,010 contracts from the previous week which had a total of -602 net contracts.

This week’s current strength score (the trader positioning range over the past three years, measured from 0 to 100) shows the speculators are currently Bearish with a score of 21.0 percent. The commercials are Bullish-Extreme with a score of 80.9 percent and the small traders (not shown in chart) are Bearish-Extreme with a score of 13.7 percent.

COCOA Futures StatisticsSPECULATORSCOMMERCIALSSMALL TRADERS
– Percent of Open Interest Longs:30.344.44.5
– Percent of Open Interest Shorts:29.246.03.9
– Net Position:3,408-5,1341,726
– Gross Longs:94,825139,10813,968
– Gross Shorts:91,417144,24212,242
– Long to Short Ratio:1.0 to 11.0 to 11.1 to 1
NET POSITION TREND:
– Strength Index Score (3 Year Range Pct):21.080.913.7
– Strength Index Reading (3 Year Range):BearishBullish-ExtremeBearish-Extreme
NET POSITION MOVEMENT INDEX:
– 6-Week Change in Strength Index:6.6-4.9-17.7


WHEAT Futures:

WHEAT Futures COT ChartThe WHEAT large speculator standing this week recorded a net position of 25 contracts in the data reported through Tuesday. This was a weekly reduction of -6,497 contracts from the previous week which had a total of 6,522 net contracts.

This week’s current strength score (the trader positioning range over the past three years, measured from 0 to 100) shows the speculators are currently Bearish-Extreme with a score of 19.1 percent. The commercials are Bullish with a score of 71.1 percent and the small traders (not shown in chart) are Bullish with a score of 68.4 percent.

WHEAT Futures StatisticsSPECULATORSCOMMERCIALSSMALL TRADERS
– Percent of Open Interest Longs:29.340.59.6
– Percent of Open Interest Shorts:29.337.812.3
– Net Position:258,068-8,093
– Gross Longs:88,400122,22128,925
– Gross Shorts:88,375114,15337,018
– Long to Short Ratio:1.0 to 11.1 to 10.8 to 1
NET POSITION TREND:
– Strength Index Score (3 Year Range Pct):19.171.168.4
– Strength Index Reading (3 Year Range):Bearish-ExtremeBullishBullish
NET POSITION MOVEMENT INDEX:
– 6-Week Change in Strength Index:-26.637.2-29.8


Article By InvestMacroReceive our weekly COT Reports by Email

*COT Report: The COT data, released weekly to the public each Friday, is updated through the most recent Tuesday (data is 3 days old) and shows a quick view of how large speculators or non-commercials (for-profit traders) were positioned in the futures markets.

The CFTC categorizes trader positions according to commercial hedgers (traders who use futures contracts for hedging as part of the business), non-commercials (large traders who speculate to realize trading profits) and nonreportable traders (usually small traders/speculators) as well as their open interest (contracts open in the market at time of reporting).See CFTC criteria here.

COT Week 30 Charts: Energy Speculator bets rise higher led by Heating Oil & Gasoline

By InvestMacro | COT | Data Tables | COT Leaders | Downloads | COT Newsletter

Here are the latest charts and statistics for the Commitment of Traders (COT) data published by the Commodities Futures Trading Commission (CFTC).

The latest COT data is updated through Tuesday July 26th and shows a quick view of how large traders (for-profit speculators and commercial entities) were positioned in the futures markets.

Weekly Speculator Changes

COT energy market speculator bets were overall higher this week as four out of the six energy markets we cover had higher positioning this week while the other two markets had lower contracts.

Leading the gains for energy markets was Heating Oil (9,441 contracts) with Gasoline (5,588 contracts), Natural Gas (2,033 contracts) and Brent Crude Oil (-180 contracts) also showing positive weeks.

The energy markets leading the declines in speculator bets this week were WTI Crude Oil (-11,831 contracts) and the Bloomberg Commodity Index (-1,535 contracts) also registering lower bets on the week.


Data Snapshot of Commodity Market Traders | Columns Legend
Jul-26-2022OIOI-IndexSpec-NetSpec-IndexCom-NetCOM-IndexSmalls-NetSmalls-Index
WTI Crude1,597,4512259,2600-283,48910024,22949
Gold487,5151092,6900-108,42210015,7320
Silver147,78414-4,5000-2,6531007,1534
Copper183,95815-26,5622326,83978-27724
Palladium7,1244-3,40843,89497-48616
Platinum73,42345-4,4682-171984,63927
Natural Gas976,1264-118,2904383,0285735,26264
Brent177,83722-41,4824240,5576192522
Heating Oil269,1272318,68470-33,5313614,84750
Soybeans583,850085,24140-57,57366-27,66824
Corn1,320,7682186,52854-138,89952-47,62916
Coffee199,536528,64164-28,867432262
Sugar722,469464,10350-65,756561,65310
Wheat301,674625198,06871-8,09368


Strength Scores

Strength Scores (a normalized measure of Speculator positions over a 3-Year range, from 0 to 100 where above 80 is extreme bullish and below 20 is extreme bearish) show that Heating Oil (69.9 percent) leads the energy markets this week and is up from 56.0 percent last week. The Bloomberg Commodity Index (47.6 percent) comes in as the next highest energy market in strength scores but has been down-trending in past weeks followed by Natural Gas (43.1 percent) and Brent Crude Oil (41.6 percent). On the downside, the WTI Crude Oil (0.0 percent) comes in at the lowest strength level currently and is at the bottom of its three-year range. Gasoline (17.4 percent) is the next lowest and joins the WTI Crude in a bearish extreme level (under 20 percent).


Strength Statistics:
WTI Crude Oil (0.0 percent) vs WTI Crude Oil previous week (3.6 percent)
Brent Crude Oil (41.6 percent) vs Brent Crude Oil previous week (41.9 percent)
Natural Gas (43.1 percent) vs Natural Gas previous week (42.5 percent)
Gasoline (17.4 percent) vs Gasoline previous week (11.8 percent)
Heating Oil (69.9 percent) vs Heating Oil previous week (56.0 percent)
Bloomberg Commodity Index (47.6 percent) vs Bloomberg Commodity Index previous week (53.4 percent)

Strength Trends

Strength Score Trends (or move index, calculates the 6-week changes in strength scores) show that Heating Oil (15.0 percent) has the highest six-week trend for energy this week. Gasoline (14.0 percent) and Natural Gas (1.6 percent) fill out the only other positive movers in the latest trends data. The Bloomberg Commodity Index (-28.1 percent) leads the downside trend scores currently while the next market with lower trend scores were WTI Crude Oil (-13.2 percent) followed by Brent Crude Oil (-8.6 percent).


Strength Trend Statistics:
WTI Crude Oil (-13.2 percent) vs WTI Crude Oil previous week (-17.3 percent)
Brent Crude Oil (-8.6 percent) vs Brent Crude Oil previous week (-8.7 percent)
Natural Gas (1.6 percent) vs Natural Gas previous week (-1.8 percent)
Gasoline (14.0 percent) vs Gasoline previous week (9.4 percent)
Heating Oil (15.0 percent) vs Heating Oil previous week (6.4 percent)
Bloomberg Commodity Index (-28.1 percent) vs Bloomberg Commodity Index previous week (-22.0 percent)


Individual Markets:

WTI Crude Oil Futures:

WTI Crude Oil Futures COT ChartThe WTI Crude Oil Futures large speculator standing this week reached a net position of 259,260 contracts in the data reported through Tuesday. This was a weekly decline of -11,831 contracts from the previous week which had a total of 271,091 net contracts.

This week’s current strength score (the trader positioning range over the past three years, measured from 0 to 100) shows the speculators are currently Bearish-Extreme with a score of 0.0 percent. The commercials are Bullish-Extreme with a score of 100.0 percent and the small traders (not shown in chart) are Bearish with a score of 49.1 percent.

WTI Crude Oil Futures StatisticsSPECULATORSCOMMERCIALSSMALL TRADERS
– Percent of Open Interest Longs:23.137.25.0
– Percent of Open Interest Shorts:6.855.03.5
– Net Position:259,260-283,48924,229
– Gross Longs:368,453595,03279,895
– Gross Shorts:109,193878,52155,666
– Long to Short Ratio:3.4 to 10.7 to 11.4 to 1
NET POSITION TREND:
– Strength Index Score (3 Year Range Pct):0.0100.049.1
– Strength Index Reading (3 Year Range):Bearish-ExtremeBullish-ExtremeBearish
NET POSITION MOVEMENT INDEX:
– 6-Week Change in Strength Index:-13.217.9-20.4


Brent Crude Oil Futures:

Brent Last Day Crude Oil Futures COT ChartThe Brent Crude Oil Futures large speculator standing this week reached a net position of -41,482 contracts in the data reported through Tuesday. This was a weekly decline of -180 contracts from the previous week which had a total of -41,302 net contracts.

This week’s current strength score (the trader positioning range over the past three years, measured from 0 to 100) shows the speculators are currently Bearish with a score of 41.6 percent. The commercials are Bullish with a score of 60.7 percent and the small traders (not shown in chart) are Bearish with a score of 21.7 percent.

Brent Crude Oil Futures StatisticsSPECULATORSCOMMERCIALSSMALL TRADERS
– Percent of Open Interest Longs:14.953.23.9
– Percent of Open Interest Shorts:38.330.43.4
– Net Position:-41,48240,557925
– Gross Longs:26,54794,5907,001
– Gross Shorts:68,02954,0336,076
– Long to Short Ratio:0.4 to 11.8 to 11.2 to 1
NET POSITION TREND:
– Strength Index Score (3 Year Range Pct):41.660.721.7
– Strength Index Reading (3 Year Range):BearishBullishBearish
NET POSITION MOVEMENT INDEX:
– 6-Week Change in Strength Index:-8.69.9-11.7


Natural Gas Futures:

Natural Gas Futures COT ChartThe Natural Gas Futures large speculator standing this week reached a net position of -118,290 contracts in the data reported through Tuesday. This was a weekly advance of 2,033 contracts from the previous week which had a total of -120,323 net contracts.

This week’s current strength score (the trader positioning range over the past three years, measured from 0 to 100) shows the speculators are currently Bearish with a score of 43.1 percent. The commercials are Bullish with a score of 57.0 percent and the small traders (not shown in chart) are Bullish with a score of 63.6 percent.

Natural Gas Futures StatisticsSPECULATORSCOMMERCIALSSMALL TRADERS
– Percent of Open Interest Longs:18.840.16.7
– Percent of Open Interest Shorts:30.931.63.1
– Net Position:-118,29083,02835,262
– Gross Longs:183,441391,77165,474
– Gross Shorts:301,731308,74330,212
– Long to Short Ratio:0.6 to 11.3 to 12.2 to 1
NET POSITION TREND:
– Strength Index Score (3 Year Range Pct):43.157.063.6
– Strength Index Reading (3 Year Range):BearishBullishBullish
NET POSITION MOVEMENT INDEX:
– 6-Week Change in Strength Index:1.62.8-32.8


Gasoline Blendstock Futures:

RBOB Gasoline Energy Futures COT ChartThe Gasoline Blendstock Futures large speculator standing this week reached a net position of 45,404 contracts in the data reported through Tuesday. This was a weekly lift of 5,588 contracts from the previous week which had a total of 39,816 net contracts.

This week’s current strength score (the trader positioning range over the past three years, measured from 0 to 100) shows the speculators are currently Bearish-Extreme with a score of 17.4 percent. The commercials are Bullish-Extreme with a score of 83.1 percent and the small traders (not shown in chart) are Bearish with a score of 45.5 percent.

Nasdaq Mini Futures StatisticsSPECULATORSCOMMERCIALSSMALL TRADERS
– Percent of Open Interest Longs:29.148.87.7
– Percent of Open Interest Shorts:11.468.55.8
– Net Position:45,404-50,3194,915
– Gross Longs:74,431124,78419,651
– Gross Shorts:29,027175,10314,736
– Long to Short Ratio:2.6 to 10.7 to 11.3 to 1
NET POSITION TREND:
– Strength Index Score (3 Year Range Pct):17.483.145.5
– Strength Index Reading (3 Year Range):Bearish-ExtremeBullish-ExtremeBearish
NET POSITION MOVEMENT INDEX:
– 6-Week Change in Strength Index:14.0-6.4-48.6


#2 Heating Oil NY-Harbor Futures:

NY Harbor Heating Oil Energy Futures COT ChartThe #2 Heating Oil NY-Harbor Futures large speculator standing this week reached a net position of 18,684 contracts in the data reported through Tuesday. This was a weekly rise of 9,441 contracts from the previous week which had a total of 9,243 net contracts.

This week’s current strength score (the trader positioning range over the past three years, measured from 0 to 100) shows the speculators are currently Bullish with a score of 69.9 percent. The commercials are Bearish with a score of 35.6 percent and the small traders (not shown in chart) are Bearish with a score of 49.8 percent.

Heating Oil Futures StatisticsSPECULATORSCOMMERCIALSSMALL TRADERS
– Percent of Open Interest Longs:16.052.015.4
– Percent of Open Interest Shorts:9.164.59.8
– Net Position:18,684-33,53114,847
– Gross Longs:43,158139,94841,336
– Gross Shorts:24,474173,47926,489
– Long to Short Ratio:1.8 to 10.8 to 11.6 to 1
NET POSITION TREND:
– Strength Index Score (3 Year Range Pct):69.935.649.8
– Strength Index Reading (3 Year Range):BullishBearishBearish
NET POSITION MOVEMENT INDEX:
– 6-Week Change in Strength Index:15.0-5.2-18.6


Bloomberg Commodity Index Futures:

Bloomberg Commodity Index Futures COT ChartThe Bloomberg Commodity Index Futures large speculator standing this week reached a net position of -15,663 contracts in the data reported through Tuesday. This was a weekly decline of -1,535 contracts from the previous week which had a total of -14,128 net contracts.

This week’s current strength score (the trader positioning range over the past three years, measured from 0 to 100) shows the speculators are currently Bearish with a score of 47.6 percent. The commercials are Bullish with a score of 52.5 percent and the small traders (not shown in chart) are Bearish-Extreme with a score of 19.8 percent.

Bloomberg Index Futures StatisticsSPECULATORSCOMMERCIALSSMALL TRADERS
– Percent of Open Interest Longs:20.776.60.5
– Percent of Open Interest Shorts:43.254.50.2
– Net Position:-15,66315,400263
– Gross Longs:14,43553,388374
– Gross Shorts:30,09837,988111
– Long to Short Ratio:0.5 to 11.4 to 13.4 to 1
NET POSITION TREND:
– Strength Index Score (3 Year Range Pct):47.652.519.8
– Strength Index Reading (3 Year Range):BearishBullishBearish-Extreme
NET POSITION MOVEMENT INDEX:
– 6-Week Change in Strength Index:-28.129.4-11.4


Article By InvestMacroReceive our weekly COT Reports by Email

*COT Report: The COT data, released weekly to the public each Friday, is updated through the most recent Tuesday (data is 3 days old) and shows a quick view of how large speculators or non-commercials (for-profit traders) were positioned in the futures markets.

The CFTC categorizes trader positions according to commercial hedgers (traders who use futures contracts for hedging as part of the business), non-commercials (large traders who speculate to realize trading profits) and nonreportable traders (usually small traders/speculators) as well as their open interest (contracts open in the market at time of reporting).See CFTC criteria here.