By InvestMacro

Here are the latest charts and statistics for the Commitment of Traders (COT) reports data published by the Commodities Futures Trading Commission (CFTC).
The latest COT data is updated through Tuesday January 20th and shows a quick view of how large traders (for-profit speculators and commercial entities) were positioned in the futures markets.
Weekly Speculator Changes led by Soybean Oil & Lean Hogs
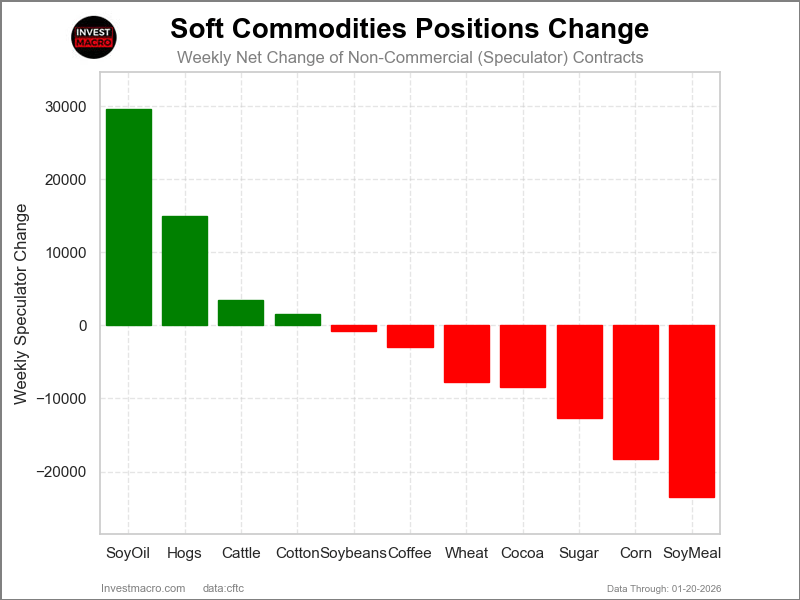
The COT soft commodities markets speculator bets were overall lower this week as just four out of the eleven softs markets we cover had higher positioning while the other seven markets had lower speculator contracts.
Leading the gains for the softs markets was Soybean Oil (29,678 contracts) with Lean Hogs (14,919 contracts), Live Cattle (3,410 contracts) and Cotton (1,607 contracts) also seeing positive weeks.
The markets with the declines in speculator bets this week were Soybean Meal (-23,547 contracts), Corn (-18,281 contracts), Sugar (-12,637 contracts) Cocoa (-8,378 contracts), Wheat (-7,705 contracts), Coffee (-2,989 contracts) and with Soybeans (-818 contracts) also having lower bets on the week.
Soft Commodities Price Performance was led this week by Wheat and Soybean Oil
Wheat led the soft commodities price performances of the week with a 3.39% increase over the past five days. Soybean Oil came in a close second with a 3.38% rise over the same period. Lean Hogs had an up week with a 2.19% rise, while Corn was also higher by 2.17%. Soybeans rose by 1.74% on the week, Sugar gained by 0.74%, and Live Cattle rounded out the gainers with a 0.73% increase.
Cocoa saw a dip by -0.78%, followed by Cotton with a decline of -0.90%, and Coffee with a -1.30% decrease. Soybean Meal saw the biggest fall this week with a -4.74% slide.
The price performance leaders over the past 30 days have been Lean Hogs, up by 9.12%, and Soybean Oil, up over 6% in that period. Cocoa is by far the biggest leader over the past 90 days with a 31.44% gain.
Soft Commodities Data:
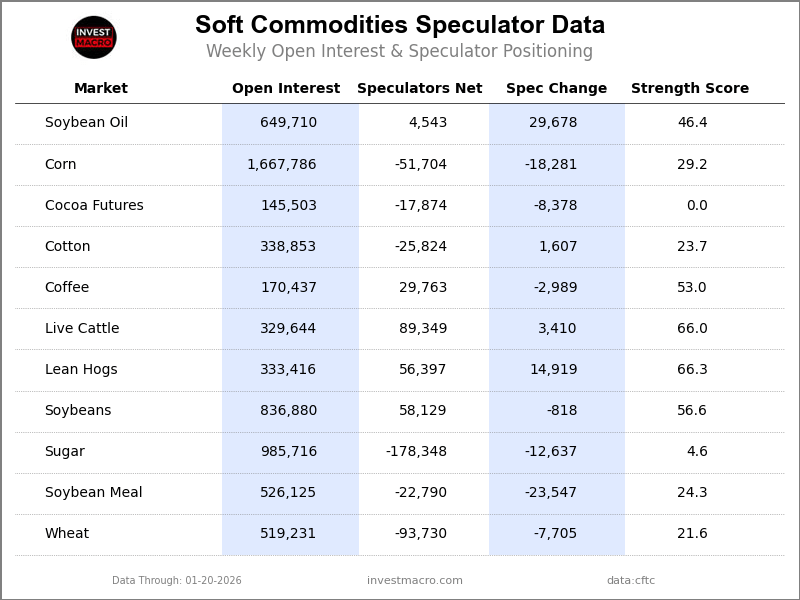
Legend: Weekly Speculators Change | Speculators Current Net Position | Speculators Strength Score compared to last 3-Years (0-100 range)
Strength Scores led by Live Cattle & Lean Hogs

COT Strength Scores (a normalized measure of Speculator positions over a 3-Year range, from 0 to 100 where above 80 is Extreme-Bullish and below 20 is Extreme-Bearish) showed that Live Cattle (66 percent) and Lean Hogs (66 percent) lead the softs markets this week. Soybeans (57 percent) and Coffee (53 percent) come in as the next highest in the weekly strength scores.
On the downside, Cocoa (0 percent) and Sugar (5 percent) come in at the lowest strength levels currently and are in Extreme-Bearish territory (below 20 percent). The next lowest strength scores are the Wheat (22 percent) and the Cotton (24 percent).
Strength Statistics:
Corn (29.2 percent) vs Corn previous week (31.7 percent)
Sugar (4.6 percent) vs Sugar previous week (7.3 percent)
Coffee (53.0 percent) vs Coffee previous week (56.1 percent)
Soybeans (56.6 percent) vs Soybeans previous week (56.8 percent)
Soybean Oil (46.4 percent) vs Soybean Oil previous week (29.3 percent)
Soybean Meal (24.3 percent) vs Soybean Meal previous week (33.2 percent)
Live Cattle (66.0 percent) vs Live Cattle previous week (62.6 percent)
Lean Hogs (66.3 percent) vs Lean Hogs previous week (55.6 percent)
Cotton (23.7 percent) vs Cotton previous week (22.7 percent)
Cocoa (0.0 percent) vs Cocoa previous week (7.9 percent)
Wheat (21.6 percent) vs Wheat previous week (28.5 percent)
Lean Hogs & Live Cattle top the 6-Week Strength Trends

COT Strength Score Trends (or move index, calculates the 6-week changes in strength scores) showed that Lean Hogs (24 percent) and Live Cattle (13 percent) lead the past six weeks trends for soft commodities. Cotton (6 percent) and Sugar (1 percent) are the next highest positive movers in the latest trends data.
Wheat (-57 percent) leads the downside trend scores currently with Soybeans (-35 percent), Soybean Meal (-19 percent) and Corn (-16 percent) following next with lower trend scores.
Strength Trend Statistics:
Corn (-16.2 percent) vs Corn previous week (-16.4 percent)
Sugar (0.9 percent) vs Sugar previous week (4.0 percent)
Coffee (-5.0 percent) vs Coffee previous week (-2.6 percent)
Soybeans (-35.0 percent) vs Soybeans previous week (-41.3 percent)
Soybean Oil (-2.5 percent) vs Soybean Oil previous week (-21.8 percent)
Soybean Meal (-18.6 percent) vs Soybean Meal previous week (-20.2 percent)
Live Cattle (13.1 percent) vs Live Cattle previous week (12.2 percent)
Lean Hogs (24.2 percent) vs Lean Hogs previous week (12.9 percent)
Cotton (6.2 percent) vs Cotton previous week (6.9 percent)
Cocoa (-14.3 percent) vs Cocoa previous week (-3.1 percent)
Wheat (-57.4 percent) vs Wheat previous week (-52.9 percent)
Individual Soft Commodities Markets:
CORN Futures:
 The CORN large speculator standing this week resulted in a net position of -51,704 contracts in the data reported through Tuesday. This was a weekly decline of -18,281 contracts from the previous week which had a total of -33,423 net contracts.
This week’s current strength score (the trader positioning range over the past three years, measured from 0 to 100) shows the speculators are currently Bearish with a score of 29.2 percent. The commercials are Bullish with a score of 67.5 percent and the small traders (not shown in chart) are Bullish-Extreme with a score of 87.6 percent.
Price Trend-Following Model: Weak Uptrend
Our weekly trend-following model classifies the current market price position as: Weak Uptrend.
| CORN Futures Statistics | SPECULATORS | COMMERCIALS | SMALL TRADERS |
| – Percent of Open Interest Longs: | 19.8 | 47.1 | 8.5 |
| – Percent of Open Interest Shorts: | 22.9 | 43.1 | 9.5 |
| – Net Position: | -51,704 | 68,044 | -16,340 |
| – Gross Longs: | 329,434 | 786,229 | 142,160 |
| – Gross Shorts: | 381,138 | 718,185 | 158,500 |
| – Long to Short Ratio: | 0.9 to 1 | 1.1 to 1 | 0.9 to 1 |
| NET POSITION TREND: | |||
| – Strength Index Score (3 Year Range Pct): | 29.2 | 67.5 | 87.6 |
| – Strength Index Reading (3 Year Range): | Bearish | Bullish | Bullish-Extreme |
| NET POSITION MOVEMENT INDEX: | |||
| – 6-Week Change in Strength Index: | -16.2 | 17.0 | 8.1 |
SUGAR Futures:
 The SUGAR large speculator standing this week resulted in a net position of -178,348 contracts in the data reported through Tuesday. This was a weekly decline of -12,637 contracts from the previous week which had a total of -165,711 net contracts.
This week’s current strength score (the trader positioning range over the past three years, measured from 0 to 100) shows the speculators are currently Bearish-Extreme with a score of 4.6 percent. The commercials are Bullish-Extreme with a score of 96.7 percent and the small traders (not shown in chart) are Bearish-Extreme with a score of 4.4 percent.
Price Trend-Following Model: Downtrend
Our weekly trend-following model classifies the current market price position as: Downtrend.
| SUGAR Futures Statistics | SPECULATORS | COMMERCIALS | SMALL TRADERS |
| – Percent of Open Interest Longs: | 14.6 | 57.3 | 7.0 |
| – Percent of Open Interest Shorts: | 32.7 | 38.0 | 8.2 |
| – Net Position: | -178,348 | 190,230 | -11,882 |
| – Gross Longs: | 143,656 | 564,457 | 69,420 |
| – Gross Shorts: | 322,004 | 374,227 | 81,302 |
| – Long to Short Ratio: | 0.4 to 1 | 1.5 to 1 | 0.9 to 1 |
| NET POSITION TREND: | |||
| – Strength Index Score (3 Year Range Pct): | 4.6 | 96.7 | 4.4 |
| – Strength Index Reading (3 Year Range): | Bearish-Extreme | Bullish-Extreme | Bearish-Extreme |
| NET POSITION MOVEMENT INDEX: | |||
| – 6-Week Change in Strength Index: | 0.9 | 0.4 | -8.8 |
COFFEE Futures:
 The COFFEE large speculator standing this week resulted in a net position of 29,763 contracts in the data reported through Tuesday. This was a weekly fall of -2,989 contracts from the previous week which had a total of 32,752 net contracts.
This week’s current strength score (the trader positioning range over the past three years, measured from 0 to 100) shows the speculators are currently Bullish with a score of 53.0 percent. The commercials are Bearish with a score of 49.0 percent and the small traders (not shown in chart) are Bearish with a score of 24.3 percent.
Price Trend-Following Model: Strong Downtrend
Our weekly trend-following model classifies the current market price position as: Strong Downtrend.
| COFFEE Futures Statistics | SPECULATORS | COMMERCIALS | SMALL TRADERS |
| – Percent of Open Interest Longs: | 32.9 | 40.6 | 4.4 |
| – Percent of Open Interest Shorts: | 15.4 | 58.3 | 4.1 |
| – Net Position: | 29,763 | -30,151 | 388 |
| – Gross Longs: | 56,009 | 69,268 | 7,449 |
| – Gross Shorts: | 26,246 | 99,419 | 7,061 |
| – Long to Short Ratio: | 2.1 to 1 | 0.7 to 1 | 1.1 to 1 |
| NET POSITION TREND: | |||
| – Strength Index Score (3 Year Range Pct): | 53.0 | 49.0 | 24.3 |
| – Strength Index Reading (3 Year Range): | Bullish | Bearish | Bearish |
| NET POSITION MOVEMENT INDEX: | |||
| – 6-Week Change in Strength Index: | -5.0 | 5.9 | -19.0 |
SOYBEANS Futures:
 The SOYBEANS large speculator standing this week resulted in a net position of 58,129 contracts in the data reported through Tuesday. This was a weekly decrease of -818 contracts from the previous week which had a total of 58,947 net contracts.
This week’s current strength score (the trader positioning range over the past three years, measured from 0 to 100) shows the speculators are currently Bullish with a score of 56.6 percent. The commercials are Bearish with a score of 43.5 percent and the small traders (not shown in chart) are Bullish with a score of 64.6 percent.
Price Trend-Following Model: Weak Uptrend
Our weekly trend-following model classifies the current market price position as: Weak Uptrend.
| SOYBEANS Futures Statistics | SPECULATORS | COMMERCIALS | SMALL TRADERS |
| – Percent of Open Interest Longs: | 20.7 | 51.4 | 6.2 |
| – Percent of Open Interest Shorts: | 13.7 | 56.1 | 8.4 |
| – Net Position: | 58,129 | -39,788 | -18,341 |
| – Gross Longs: | 173,031 | 429,894 | 51,801 |
| – Gross Shorts: | 114,902 | 469,682 | 70,142 |
| – Long to Short Ratio: | 1.5 to 1 | 0.9 to 1 | 0.7 to 1 |
| NET POSITION TREND: | |||
| – Strength Index Score (3 Year Range Pct): | 56.6 | 43.5 | 64.6 |
| – Strength Index Reading (3 Year Range): | Bullish | Bearish | Bullish |
| NET POSITION MOVEMENT INDEX: | |||
| – 6-Week Change in Strength Index: | -35.0 | 35.3 | 9.3 |
SOYBEAN OIL Futures:
 The SOYBEAN OIL large speculator standing this week resulted in a net position of 4,543 contracts in the data reported through Tuesday. This was a weekly lift of 29,678 contracts from the previous week which had a total of -25,135 net contracts.
This week’s current strength score (the trader positioning range over the past three years, measured from 0 to 100) shows the speculators are currently Bearish with a score of 46.4 percent. The commercials are Bullish with a score of 56.9 percent and the small traders (not shown in chart) are Bearish with a score of 20.9 percent.
Price Trend-Following Model: Weak Downtrend
Our weekly trend-following model classifies the current market price position as: Weak Downtrend.
| SOYBEAN OIL Futures Statistics | SPECULATORS | COMMERCIALS | SMALL TRADERS |
| – Percent of Open Interest Longs: | 19.0 | 48.7 | 4.6 |
| – Percent of Open Interest Shorts: | 18.3 | 49.5 | 4.6 |
| – Net Position: | 4,543 | -5,045 | 502 |
| – Gross Longs: | 123,574 | 316,601 | 30,092 |
| – Gross Shorts: | 119,031 | 321,646 | 29,590 |
| – Long to Short Ratio: | 1.0 to 1 | 1.0 to 1 | 1.0 to 1 |
| NET POSITION TREND: | |||
| – Strength Index Score (3 Year Range Pct): | 46.4 | 56.9 | 20.9 |
| – Strength Index Reading (3 Year Range): | Bearish | Bullish | Bearish |
| NET POSITION MOVEMENT INDEX: | |||
| – 6-Week Change in Strength Index: | -2.5 | 3.8 | -13.8 |
SOYBEAN MEAL Futures:
 The SOYBEAN MEAL large speculator standing this week resulted in a net position of -22,790 contracts in the data reported through Tuesday. This was a weekly decrease of -23,547 contracts from the previous week which had a total of 757 net contracts.
This week’s current strength score (the trader positioning range over the past three years, measured from 0 to 100) shows the speculators are currently Bearish with a score of 24.3 percent. The commercials are Bullish with a score of 78.5 percent and the small traders (not shown in chart) are Bearish with a score of 25.7 percent.
Price Trend-Following Model: Weak Uptrend
Our weekly trend-following model classifies the current market price position as: Weak Uptrend.
| SOYBEAN MEAL Futures Statistics | SPECULATORS | COMMERCIALS | SMALL TRADERS |
| – Percent of Open Interest Longs: | 21.4 | 52.1 | 8.4 |
| – Percent of Open Interest Shorts: | 25.7 | 50.5 | 5.7 |
| – Net Position: | -22,790 | 8,261 | 14,529 |
| – Gross Longs: | 112,415 | 274,052 | 44,344 |
| – Gross Shorts: | 135,205 | 265,791 | 29,815 |
| – Long to Short Ratio: | 0.8 to 1 | 1.0 to 1 | 1.5 to 1 |
| NET POSITION TREND: | |||
| – Strength Index Score (3 Year Range Pct): | 24.3 | 78.5 | 25.7 |
| – Strength Index Reading (3 Year Range): | Bearish | Bullish | Bearish |
| NET POSITION MOVEMENT INDEX: | |||
| – 6-Week Change in Strength Index: | -18.6 | 20.0 | -17.0 |
LIVE CATTLE Futures:
 The LIVE CATTLE large speculator standing this week resulted in a net position of 89,349 contracts in the data reported through Tuesday. This was a weekly increase of 3,410 contracts from the previous week which had a total of 85,939 net contracts.
This week’s current strength score (the trader positioning range over the past three years, measured from 0 to 100) shows the speculators are currently Bullish with a score of 66.0 percent. The commercials are Bearish with a score of 27.9 percent and the small traders (not shown in chart) are Bullish with a score of 56.6 percent.
Price Trend-Following Model: Uptrend
Our weekly trend-following model classifies the current market price position as: Uptrend.
| LIVE CATTLE Futures Statistics | SPECULATORS | COMMERCIALS | SMALL TRADERS |
| – Percent of Open Interest Longs: | 44.6 | 33.2 | 8.7 |
| – Percent of Open Interest Shorts: | 17.5 | 56.7 | 12.3 |
| – Net Position: | 89,349 | -77,472 | -11,877 |
| – Gross Longs: | 147,002 | 109,484 | 28,606 |
| – Gross Shorts: | 57,653 | 186,956 | 40,483 |
| – Long to Short Ratio: | 2.5 to 1 | 0.6 to 1 | 0.7 to 1 |
| NET POSITION TREND: | |||
| – Strength Index Score (3 Year Range Pct): | 66.0 | 27.9 | 56.6 |
| – Strength Index Reading (3 Year Range): | Bullish | Bearish | Bullish |
| NET POSITION MOVEMENT INDEX: | |||
| – 6-Week Change in Strength Index: | 13.1 | -18.8 | 7.9 |
LEAN HOGS Futures:
 The LEAN HOGS large speculator standing this week resulted in a net position of 56,397 contracts in the data reported through Tuesday. This was a weekly increase of 14,919 contracts from the previous week which had a total of 41,478 net contracts.
This week’s current strength score (the trader positioning range over the past three years, measured from 0 to 100) shows the speculators are currently Bullish with a score of 66.3 percent. The commercials are Bearish with a score of 36.4 percent and the small traders (not shown in chart) are Bearish with a score of 33.3 percent.
Price Trend-Following Model: Uptrend
Our weekly trend-following model classifies the current market price position as: Uptrend.
| LEAN HOGS Futures Statistics | SPECULATORS | COMMERCIALS | SMALL TRADERS |
| – Percent of Open Interest Longs: | 40.3 | 33.9 | 6.5 |
| – Percent of Open Interest Shorts: | 23.4 | 48.7 | 8.7 |
| – Net Position: | 56,397 | -49,048 | -7,349 |
| – Gross Longs: | 134,411 | 113,181 | 21,820 |
| – Gross Shorts: | 78,014 | 162,229 | 29,169 |
| – Long to Short Ratio: | 1.7 to 1 | 0.7 to 1 | 0.7 to 1 |
| NET POSITION TREND: | |||
| – Strength Index Score (3 Year Range Pct): | 66.3 | 36.4 | 33.3 |
| – Strength Index Reading (3 Year Range): | Bullish | Bearish | Bearish |
| NET POSITION MOVEMENT INDEX: | |||
| – 6-Week Change in Strength Index: | 24.2 | -26.1 | 3.0 |
COTTON Futures:
 The COTTON large speculator standing this week resulted in a net position of -25,824 contracts in the data reported through Tuesday. This was a weekly increase of 1,607 contracts from the previous week which had a total of -27,431 net contracts.
This week’s current strength score (the trader positioning range over the past three years, measured from 0 to 100) shows the speculators are currently Bearish with a score of 23.7 percent. The commercials are Bullish with a score of 75.2 percent and the small traders (not shown in chart) are Bearish with a score of 40.1 percent.
Price Trend-Following Model: Downtrend
Our weekly trend-following model classifies the current market price position as: Downtrend.
| COTTON Futures Statistics | SPECULATORS | COMMERCIALS | SMALL TRADERS |
| – Percent of Open Interest Longs: | 27.3 | 46.6 | 4.4 |
| – Percent of Open Interest Shorts: | 34.9 | 39.7 | 3.7 |
| – Net Position: | -25,824 | 23,415 | 2,409 |
| – Gross Longs: | 92,421 | 158,038 | 14,887 |
| – Gross Shorts: | 118,245 | 134,623 | 12,478 |
| – Long to Short Ratio: | 0.8 to 1 | 1.2 to 1 | 1.2 to 1 |
| NET POSITION TREND: | |||
| – Strength Index Score (3 Year Range Pct): | 23.7 | 75.2 | 40.1 |
| – Strength Index Reading (3 Year Range): | Bearish | Bullish | Bearish |
| NET POSITION MOVEMENT INDEX: | |||
| – 6-Week Change in Strength Index: | 6.2 | -7.8 | 27.6 |
COCOA Futures:
 The COCOA large speculator standing this week resulted in a net position of -17,874 contracts in the data reported through Tuesday. This was a weekly lowering of -8,378 contracts from the previous week which had a total of -9,496 net contracts.
This week’s current strength score (the trader positioning range over the past three years, measured from 0 to 100) shows the speculators are currently Bearish-Extreme with a score of 0.0 percent. The commercials are Bullish-Extreme with a score of 100.0 percent and the small traders (not shown in chart) are Bearish-Extreme with a score of 19.2 percent.
Price Trend-Following Model: Uptrend
Our weekly trend-following model classifies the current market price position as: Uptrend.
| COCOA Futures Statistics | SPECULATORS | COMMERCIALS | SMALL TRADERS |
| – Percent of Open Interest Longs: | 18.0 | 48.9 | 6.4 |
| – Percent of Open Interest Shorts: | 30.3 | 36.0 | 7.0 |
| – Net Position: | -17,874 | 18,722 | -848 |
| – Gross Longs: | 26,157 | 71,172 | 9,372 |
| – Gross Shorts: | 44,031 | 52,450 | 10,220 |
| – Long to Short Ratio: | 0.6 to 1 | 1.4 to 1 | 0.9 to 1 |
| NET POSITION TREND: | |||
| – Strength Index Score (3 Year Range Pct): | 0.0 | 100.0 | 19.2 |
| – Strength Index Reading (3 Year Range): | Bearish-Extreme | Bullish-Extreme | Bearish-Extreme |
| NET POSITION MOVEMENT INDEX: | |||
| – 6-Week Change in Strength Index: | -14.3 | 12.4 | 13.9 |
WHEAT Futures:
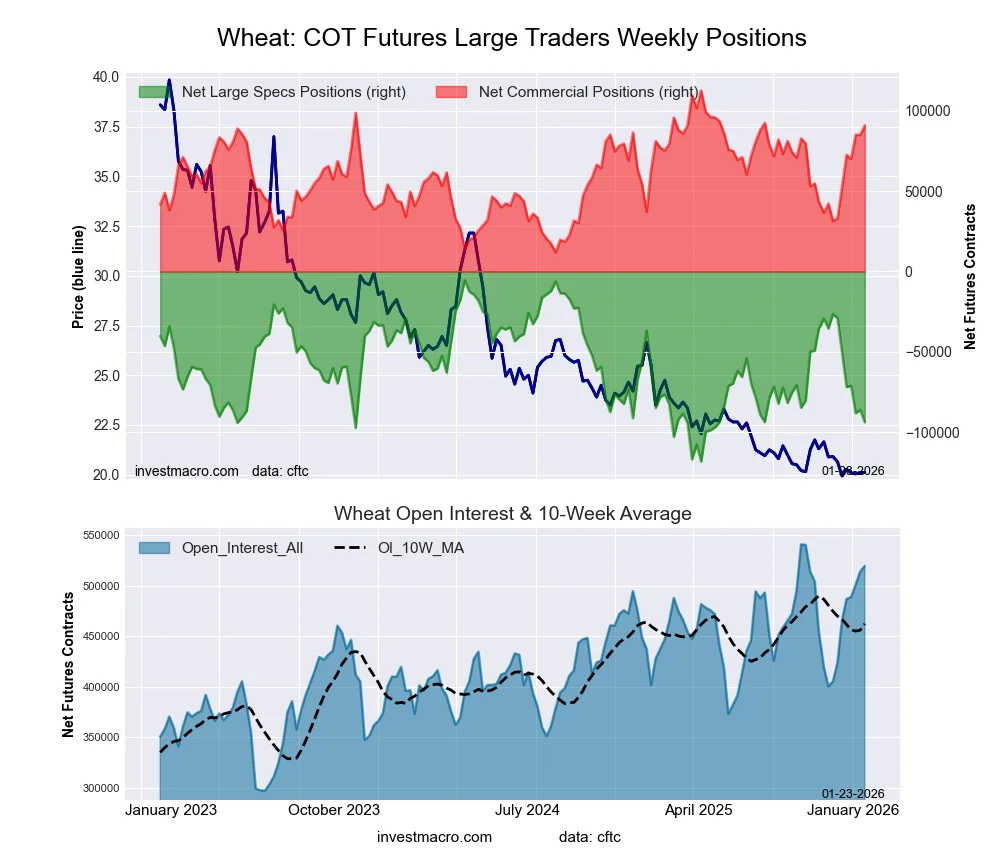 The WHEAT large speculator standing this week resulted in a net position of -93,730 contracts in the data reported through Tuesday. This was a weekly decrease of -7,705 contracts from the previous week which had a total of -86,025 net contracts.
This week’s current strength score (the trader positioning range over the past three years, measured from 0 to 100) shows the speculators are currently Bearish with a score of 21.6 percent. The commercials are Bullish with a score of 78.5 percent and the small traders (not shown in chart) are Bullish with a score of 71.0 percent.
Price Trend-Following Model: Weak Downtrend
Our weekly trend-following model classifies the current market price position as: Weak Downtrend.
| WHEAT Futures Statistics | SPECULATORS | COMMERCIALS | SMALL TRADERS |
| – Percent of Open Interest Longs: | 24.0 | 37.6 | 6.2 |
| – Percent of Open Interest Shorts: | 42.1 | 20.1 | 5.6 |
| – Net Position: | -93,730 | 90,844 | 2,886 |
| – Gross Longs: | 124,615 | 195,236 | 32,217 |
| – Gross Shorts: | 218,345 | 104,392 | 29,331 |
| – Long to Short Ratio: | 0.6 to 1 | 1.9 to 1 | 1.1 to 1 |
| NET POSITION TREND: | |||
| – Strength Index Score (3 Year Range Pct): | 21.6 | 78.5 | 71.0 |
| – Strength Index Reading (3 Year Range): | Bearish | Bullish | Bullish |
| NET POSITION MOVEMENT INDEX: | |||
| – 6-Week Change in Strength Index: | -57.4 | 57.4 | 40.6 |
Article By InvestMacro – Receive our weekly COT Newsletter
*COT Report: The COT data, released weekly to the public each Friday, is updated through the most recent Tuesday (data is 3 days old) and shows a quick view of how large speculators or non-commercials (for-profit traders) were positioned in the futures markets.
The CFTC categorizes trader positions according to commercial hedgers (traders who use futures contracts for hedging as part of the business), non-commercials (large traders who speculate to realize trading profits) and nonreportable traders (usually small traders/speculators) as well as their open interest (contracts open in the market at time of reporting). See CFTC criteria here.