By InvestMacro
Here are the latest charts and statistics for the Commitment of Traders (COT) reports data published by the Commodities Futures Trading Commission (CFTC).
The latest COT data is updated through Tuesday January 13th and shows a quick view of how large traders (for-profit speculators and commercial entities) were positioned in the futures markets.
Weekly Speculator Changes led by Soybean Oil & Soybean Meal
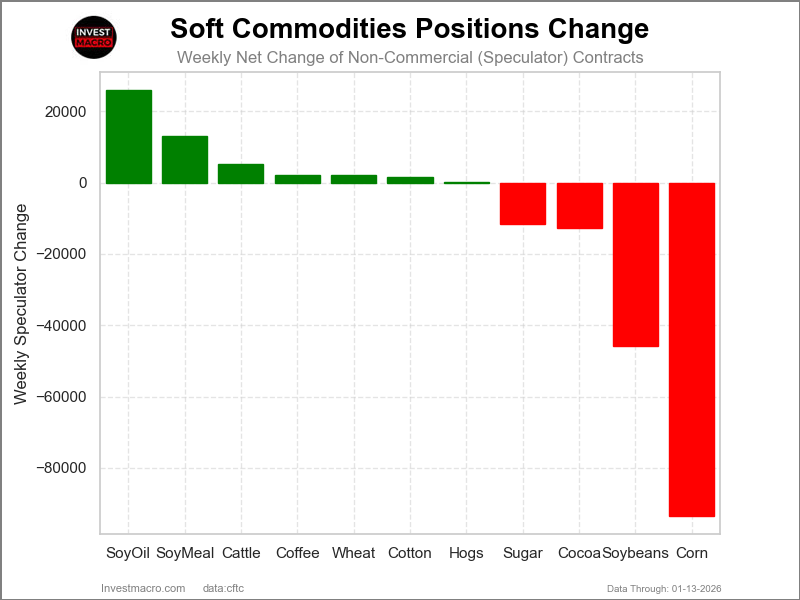
The COT soft commodities markets speculator bets were overall higher this week as seven out of the eleven softs markets we cover had higher positioning while the other four markets had lower speculator contracts.
Leading the gains for the softs markets was Soybean Oil (26,028 contracts) with Soybean Meal (13,215 contracts), Live Cattle (5,213 contracts), Coffee (2,216 contracts), Wheat (2,066 contracts), Cotton (1,489 contracts) and Lean Hogs (90 contracts) also showing positive weeks.
The markets with the declines in speculator bets this week were Corn (-93,535 contracts), Soybeans (-45,823 contracts), Cocoa (-12,726 contracts) and with Sugar (-11,613 contracts) also registering lower bets on the week.
5-Day Price Performance led by Soybean Oil
Soft commodity prices this week saw Soybean Oil lead the past five days’ performance with a gain of 5.33%. Soybean Oil has risen by almost 3% over the past 90 days.
Lean Hogs came in second with a 1.13% gain this week, followed by Cotton, which rose by 0.45%. Sugar (0.10%) and Wheat (0.09%) were marginally higher on the week while Live Cattle was virtually unchanged.
Soybeans fell by just over half a percent (-0.68%), followed by Coffee (-0.81%), which was lower by just under -1%. Cocoa fell by -2.6%, while Corn dropped by over -4%, and Soybean Meal was down by about -5%.
Soft Commodities Data:
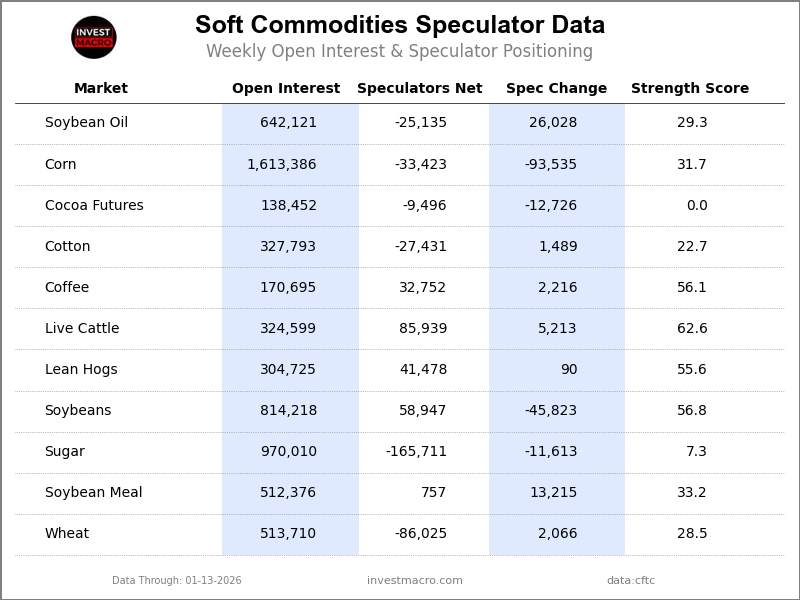
Legend: Weekly Speculators Change | Speculators Current Net Position | Speculators Strength Score compared to last 3-Years (0-100 range)
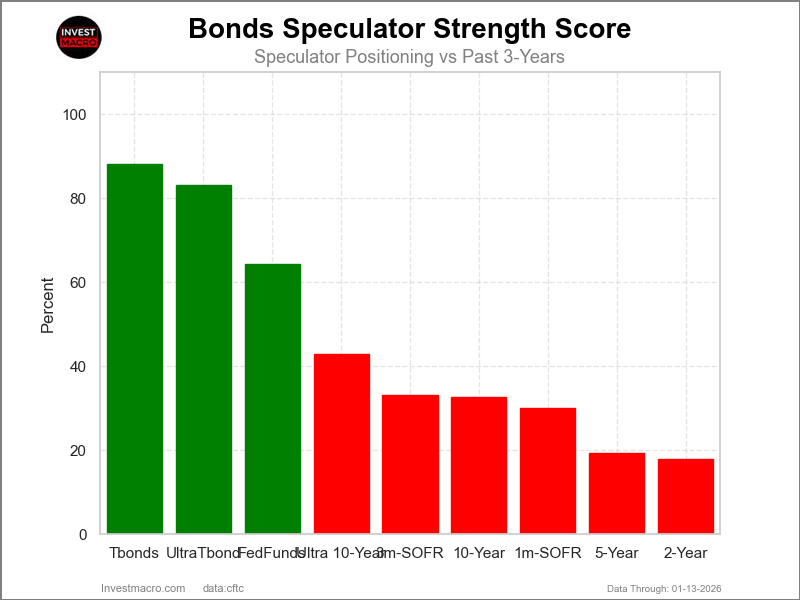
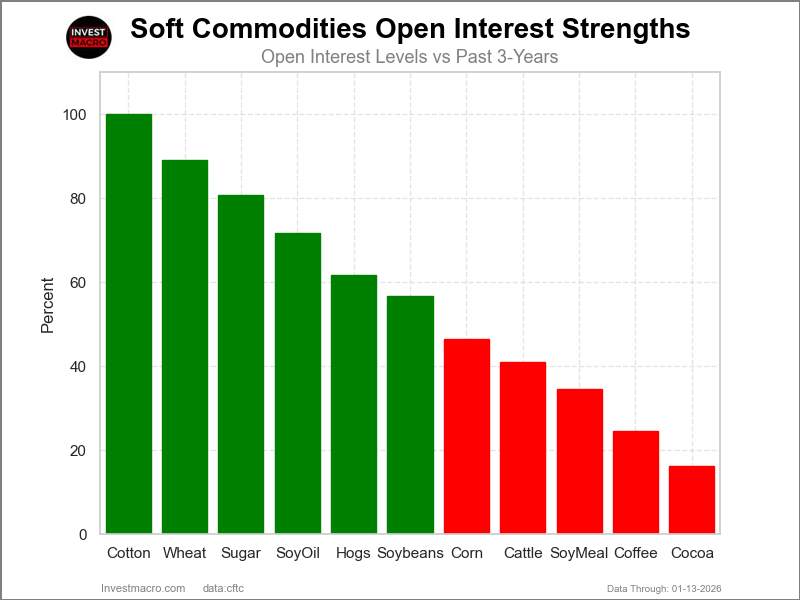
Strength Scores led by Live Cattle & Soybeans
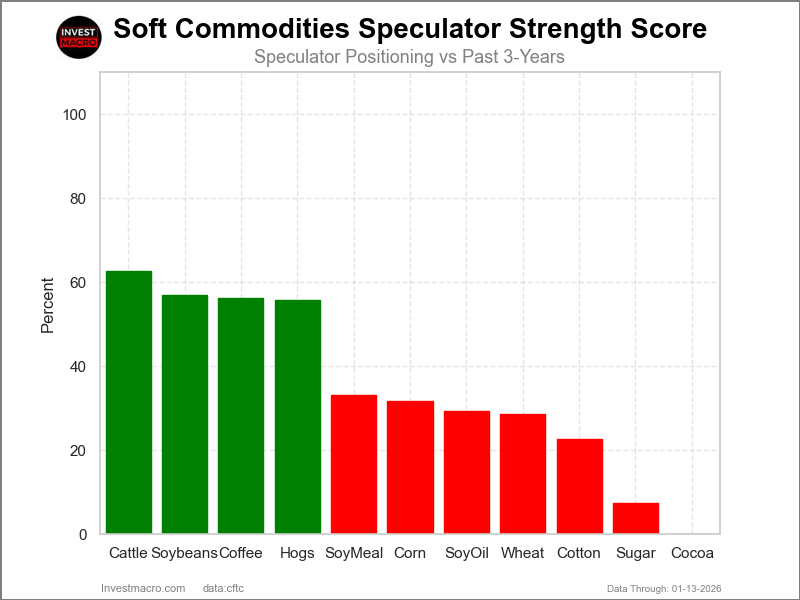
COT Strength Scores (a normalized measure of Speculator positions over a 3-Year range, from 0 to 100 where above 80 is Extreme-Bullish and below 20 is Extreme-Bearish) showed that Live Cattle (63 percent), Soybeans (57 percent), Coffee (56 percent) and Lean Hogs (56 percent) lead the softs markets this week.
On the downside, Cocoa (0 percent) and Sugar (7 percent) come in at the lowest strength levels currently and are in Extreme-Bearish territory (below 20 percent). The next lowest strength scores are the Cotton (23 percent) and the Wheat (28 percent).
Strength Statistics:
Corn (31.7 percent) vs Corn previous week (44.4 percent)
Sugar (7.3 percent) vs Sugar previous week (9.7 percent)
Coffee (56.1 percent) vs Coffee previous week (53.8 percent)
Soybeans (56.8 percent) vs Soybeans previous week (66.9 percent)
Soybean Oil (29.3 percent) vs Soybean Oil previous week (14.2 percent)
Soybean Meal (33.2 percent) vs Soybean Meal previous week (28.2 percent)
Live Cattle (62.6 percent) vs Live Cattle previous week (57.4 percent)
Lean Hogs (55.6 percent) vs Lean Hogs previous week (55.6 percent)
Cotton (22.7 percent) vs Cotton previous week (21.9 percent)
Cocoa (0.0 percent) vs Cocoa previous week (13.0 percent)
Wheat (28.5 percent) vs Wheat previous week (26.6 percent)
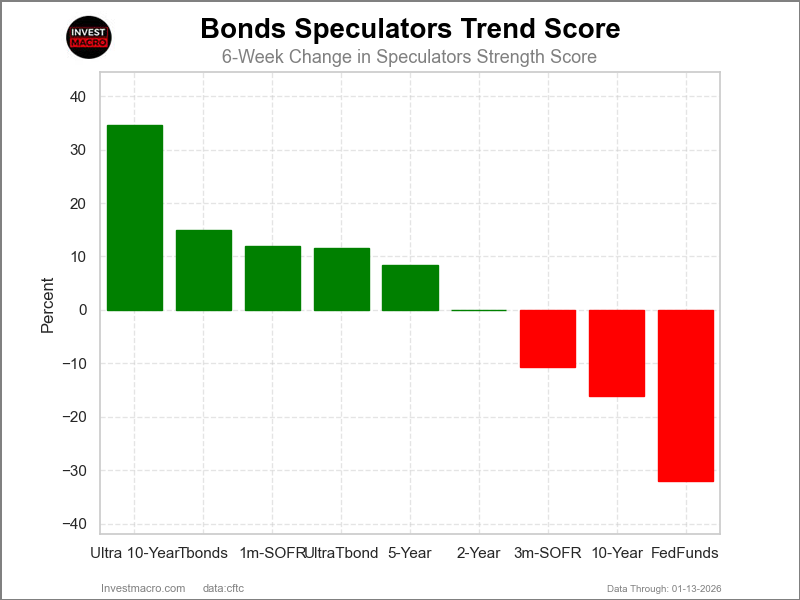
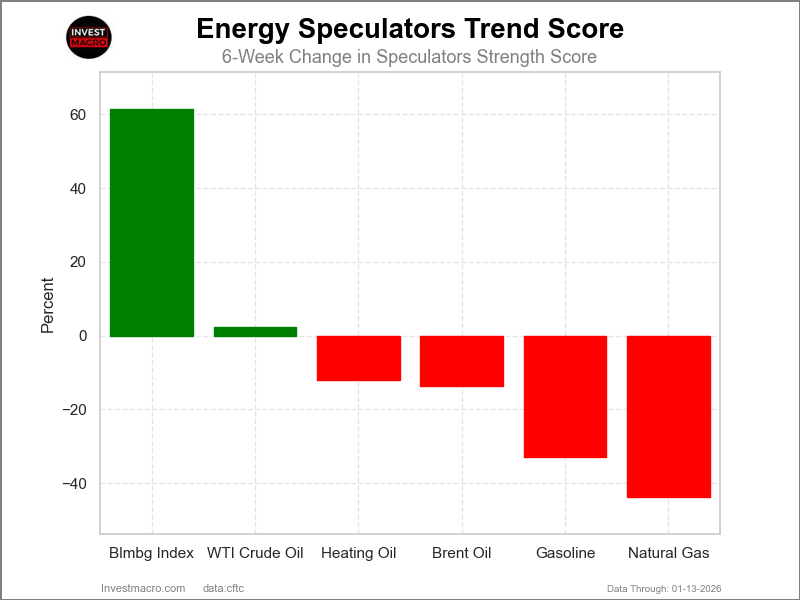
Lean Hogs & Live Cattle top the 6-Week Strength Trends
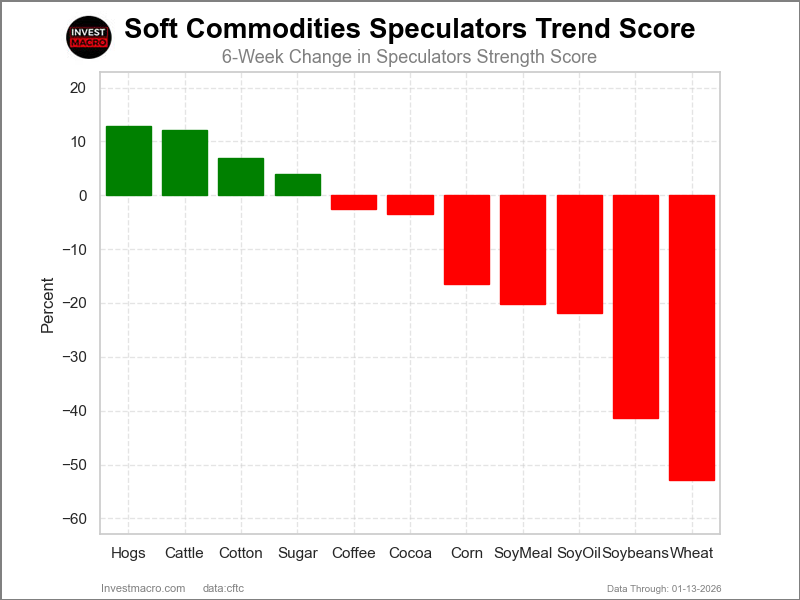
COT Strength Score Trends (or move index, calculates the 6-week changes in strength scores) showed that Lean Hogs (13 percent) and Live Cattle (12 percent) lead the past six weeks trends for soft commodities. Cotton (7 percent) and Sugar (4 percent) are the next highest positive movers in the latest trends data.
Wheat (-53 percent) leads the downside trend scores currently with Soybeans (-41 percent), Soybean Oil (-22 percent) and Soybean Meal (-20 percent) following next with lower trend scores.
Strength Trend Statistics:
Corn (-16.4 percent) vs Corn previous week (0.2 percent)
Sugar (4.0 percent) vs Sugar previous week (8.4 percent)
Coffee (-2.6 percent) vs Coffee previous week (-5.5 percent)
Soybeans (-41.3 percent) vs Soybeans previous week (-29.9 percent)
Soybean Oil (-21.8 percent) vs Soybean Oil previous week (-27.9 percent)
Soybean Meal (-20.2 percent) vs Soybean Meal previous week (-27.8 percent)
Live Cattle (12.2 percent) vs Live Cattle previous week (-0.9 percent)
Lean Hogs (12.9 percent) vs Lean Hogs previous week (10.2 percent)
Cotton (6.9 percent) vs Cotton previous week (7.6 percent)
Cocoa (-3.4 percent) vs Cocoa previous week (9.2 percent)
Wheat (-52.9 percent) vs Wheat previous week (-46.8 percent)
Individual Soft Commodities Markets:
CORN Futures:
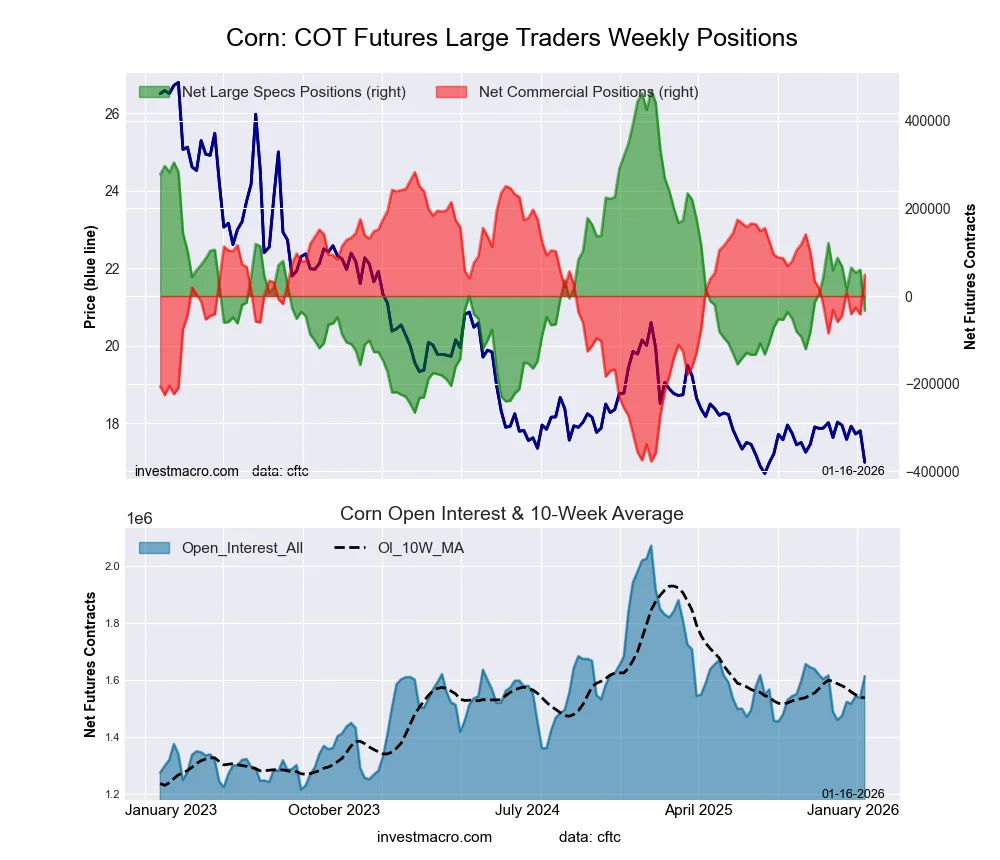 The CORN large speculator standing this week reached a net position of -33,423 contracts in the data reported through Tuesday. This was a weekly reduction of -93,535 contracts from the previous week which had a total of 60,112 net contracts.
This week’s current strength score (the trader positioning range over the past three years, measured from 0 to 100) shows the speculators are currently Bearish with a score of 31.7 percent. The commercials are Bullish with a score of 64.6 percent and the small traders (not shown in chart) are Bullish-Extreme with a score of 88.6 percent.
Price Trend-Following Model: Downtrend
Our weekly trend-following model classifies the current market price position as: Downtrend.
| CORN Futures Statistics | SPECULATORS | COMMERCIALS | SMALL TRADERS |
| – Percent of Open Interest Longs: | 20.4 | 48.1 | 8.7 |
| – Percent of Open Interest Shorts: | 22.4 | 45.1 | 9.6 |
| – Net Position: | -33,423 | 48,923 | -15,500 |
| – Gross Longs: | 328,395 | 776,624 | 140,104 |
| – Gross Shorts: | 361,818 | 727,701 | 155,604 |
| – Long to Short Ratio: | 0.9 to 1 | 1.1 to 1 | 0.9 to 1 |
| NET POSITION TREND: | | | |
| – Strength Index Score (3 Year Range Pct): | 31.7 | 64.6 | 88.6 |
| – Strength Index Reading (3 Year Range): | Bearish | Bullish | Bullish-Extreme |
| NET POSITION MOVEMENT INDEX: | | | |
| – 6-Week Change in Strength Index: | -16.4 | 16.3 | 14.9 |
SUGAR Futures:
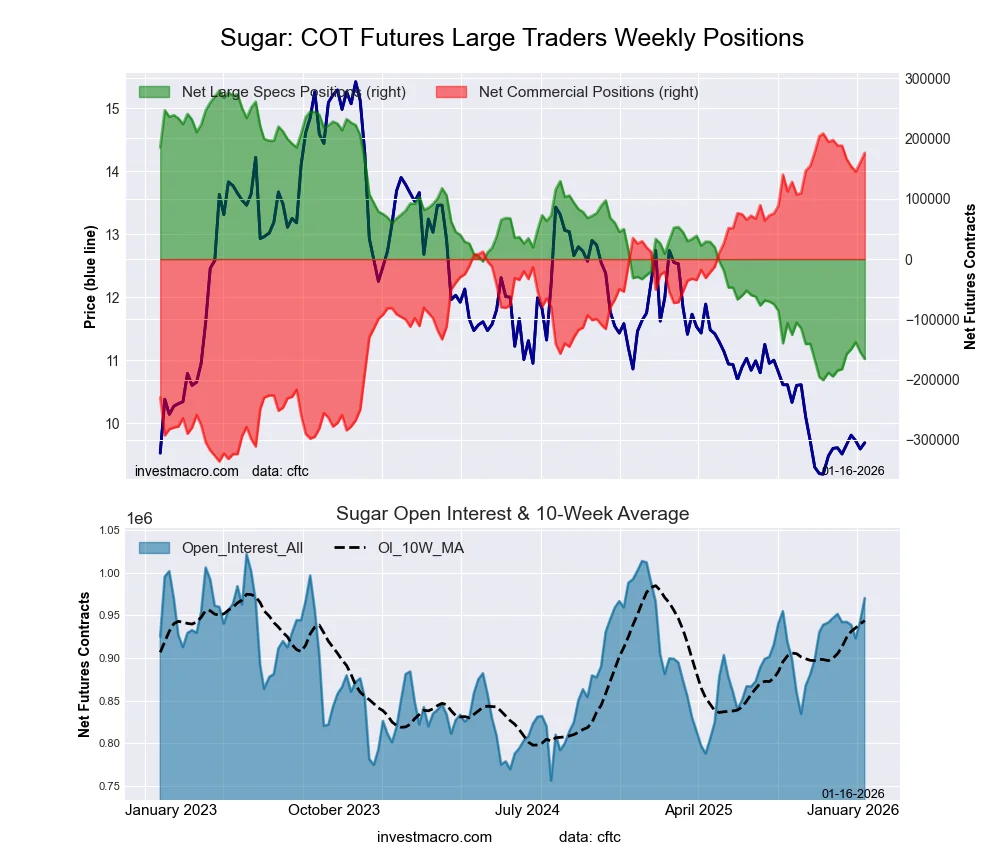 The SUGAR large speculator standing this week reached a net position of -165,711 contracts in the data reported through Tuesday. This was a weekly decline of -11,613 contracts from the previous week which had a total of -154,098 net contracts.
This week’s current strength score (the trader positioning range over the past three years, measured from 0 to 100) shows the speculators are currently Bearish-Extreme with a score of 7.3 percent. The commercials are Bullish-Extreme with a score of 94.1 percent and the small traders (not shown in chart) are Bearish-Extreme with a score of 6.2 percent.
Price Trend-Following Model: Downtrend
Our weekly trend-following model classifies the current market price position as: Downtrend.
| SUGAR Futures Statistics | SPECULATORS | COMMERCIALS | SMALL TRADERS |
| – Percent of Open Interest Longs: | 14.8 | 56.2 | 7.2 |
| – Percent of Open Interest Shorts: | 31.9 | 38.1 | 8.3 |
| – Net Position: | -165,711 | 176,273 | -10,562 |
| – Gross Longs: | 143,494 | 545,372 | 69,916 |
| – Gross Shorts: | 309,205 | 369,099 | 80,478 |
| – Long to Short Ratio: | 0.5 to 1 | 1.5 to 1 | 0.9 to 1 |
| NET POSITION TREND: | | | |
| – Strength Index Score (3 Year Range Pct): | 7.3 | 94.1 | 6.2 |
| – Strength Index Reading (3 Year Range): | Bearish-Extreme | Bullish-Extreme | Bearish-Extreme |
| NET POSITION MOVEMENT INDEX: | | | |
| – 6-Week Change in Strength Index: | 4.0 | -2.2 | -9.7 |
COFFEE Futures:
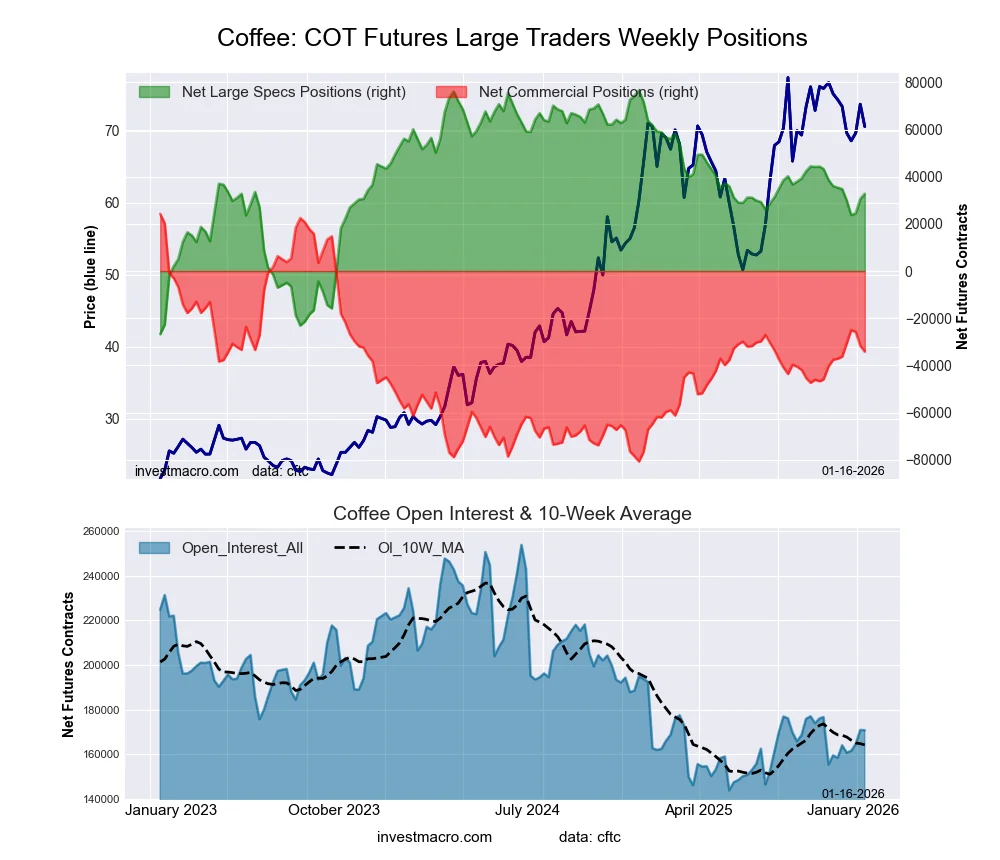 The COFFEE large speculator standing this week reached a net position of 32,752 contracts in the data reported through Tuesday. This was a weekly increase of 2,216 contracts from the previous week which had a total of 30,536 net contracts.
This week’s current strength score (the trader positioning range over the past three years, measured from 0 to 100) shows the speculators are currently Bullish with a score of 56.1 percent. The commercials are Bearish with a score of 45.1 percent and the small traders (not shown in chart) are Bearish with a score of 41.0 percent.
Price Trend-Following Model: Weak Uptrend
Our weekly trend-following model classifies the current market price position as: Weak Uptrend.
| COFFEE Futures Statistics | SPECULATORS | COMMERCIALS | SMALL TRADERS |
| – Percent of Open Interest Longs: | 33.9 | 40.7 | 4.6 |
| – Percent of Open Interest Shorts: | 14.7 | 60.7 | 3.8 |
| – Net Position: | 32,752 | -34,127 | 1,375 |
| – Gross Longs: | 57,888 | 69,400 | 7,843 |
| – Gross Shorts: | 25,136 | 103,527 | 6,468 |
| – Long to Short Ratio: | 2.3 to 1 | 0.7 to 1 | 1.2 to 1 |
| NET POSITION TREND: | | | |
| – Strength Index Score (3 Year Range Pct): | 56.1 | 45.1 | 41.0 |
| – Strength Index Reading (3 Year Range): | Bullish | Bearish | Bearish |
| NET POSITION MOVEMENT INDEX: | | | |
| – 6-Week Change in Strength Index: | -2.6 | 2.9 | -7.1 |
SOYBEANS Futures:
 The SOYBEANS large speculator standing this week reached a net position of 58,947 contracts in the data reported through Tuesday. This was a weekly lowering of -45,823 contracts from the previous week which had a total of 104,770 net contracts.
This week’s current strength score (the trader positioning range over the past three years, measured from 0 to 100) shows the speculators are currently Bullish with a score of 56.8 percent. The commercials are Bearish with a score of 43.6 percent and the small traders (not shown in chart) are Bullish with a score of 61.7 percent.
Price Trend-Following Model: Weak Uptrend
Our weekly trend-following model classifies the current market price position as: Weak Uptrend.
| SOYBEANS Futures Statistics | SPECULATORS | COMMERCIALS | SMALL TRADERS |
| – Percent of Open Interest Longs: | 21.7 | 51.5 | 6.3 |
| – Percent of Open Interest Shorts: | 14.4 | 56.3 | 8.7 |
| – Net Position: | 58,947 | -39,485 | -19,462 |
| – Gross Longs: | 176,440 | 419,099 | 51,203 |
| – Gross Shorts: | 117,493 | 458,584 | 70,665 |
| – Long to Short Ratio: | 1.5 to 1 | 0.9 to 1 | 0.7 to 1 |
| NET POSITION TREND: | | | |
| – Strength Index Score (3 Year Range Pct): | 56.8 | 43.6 | 61.7 |
| – Strength Index Reading (3 Year Range): | Bullish | Bearish | Bullish |
| NET POSITION MOVEMENT INDEX: | | | |
| – 6-Week Change in Strength Index: | -41.3 | 42.4 | 2.6 |
SOYBEAN OIL Futures:
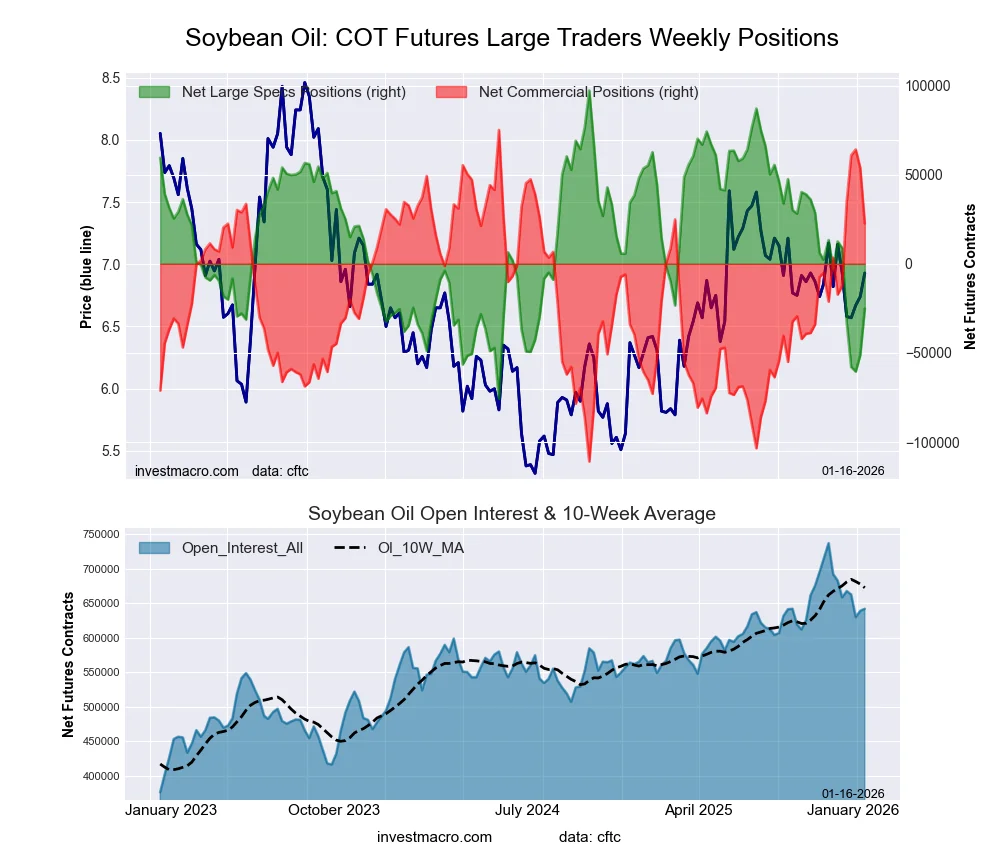 The SOYBEAN OIL large speculator standing this week reached a net position of -25,135 contracts in the data reported through Tuesday. This was a weekly lift of 26,028 contracts from the previous week which had a total of -51,163 net contracts.
This week’s current strength score (the trader positioning range over the past three years, measured from 0 to 100) shows the speculators are currently Bearish with a score of 29.3 percent. The commercials are Bullish with a score of 71.9 percent and the small traders (not shown in chart) are Bearish with a score of 30.3 percent.
Price Trend-Following Model: Weak Downtrend
Our weekly trend-following model classifies the current market price position as: Weak Downtrend.
| SOYBEAN OIL Futures Statistics | SPECULATORS | COMMERCIALS | SMALL TRADERS |
| – Percent of Open Interest Longs: | 18.7 | 49.9 | 4.4 |
| – Percent of Open Interest Shorts: | 22.6 | 46.3 | 4.1 |
| – Net Position: | -25,135 | 22,739 | 2,396 |
| – Gross Longs: | 119,861 | 320,241 | 28,550 |
| – Gross Shorts: | 144,996 | 297,502 | 26,154 |
| – Long to Short Ratio: | 0.8 to 1 | 1.1 to 1 | 1.1 to 1 |
| NET POSITION TREND: | | | |
| – Strength Index Score (3 Year Range Pct): | 29.3 | 71.9 | 30.3 |
| – Strength Index Reading (3 Year Range): | Bearish | Bullish | Bearish |
| NET POSITION MOVEMENT INDEX: | | | |
| – 6-Week Change in Strength Index: | -21.8 | 21.5 | -11.5 |
SOYBEAN MEAL Futures:
 The SOYBEAN MEAL large speculator standing this week reached a net position of 757 contracts in the data reported through Tuesday. This was a weekly advance of 13,215 contracts from the previous week which had a total of -12,458 net contracts.
This week’s current strength score (the trader positioning range over the past three years, measured from 0 to 100) shows the speculators are currently Bearish with a score of 33.2 percent. The commercials are Bullish with a score of 70.1 percent and the small traders (not shown in chart) are Bearish-Extreme with a score of 15.8 percent.
Price Trend-Following Model: Weak Uptrend
Our weekly trend-following model classifies the current market price position as: Weak Uptrend.
| SOYBEAN MEAL Futures Statistics | SPECULATORS | COMMERCIALS | SMALL TRADERS |
| – Percent of Open Interest Longs: | 21.9 | 52.6 | 8.4 |
| – Percent of Open Interest Shorts: | 21.7 | 55.2 | 5.9 |
| – Net Position: | 757 | -13,489 | 12,732 |
| – Gross Longs: | 111,971 | 269,497 | 42,916 |
| – Gross Shorts: | 111,214 | 282,986 | 30,184 |
| – Long to Short Ratio: | 1.0 to 1 | 1.0 to 1 | 1.4 to 1 |
| NET POSITION TREND: | | | |
| – Strength Index Score (3 Year Range Pct): | 33.2 | 70.1 | 15.8 |
| – Strength Index Reading (3 Year Range): | Bearish | Bullish | Bearish-Extreme |
| NET POSITION MOVEMENT INDEX: | | | |
| – 6-Week Change in Strength Index: | -20.2 | 20.7 | -3.6 |
LIVE CATTLE Futures:
 The LIVE CATTLE large speculator standing this week reached a net position of 85,939 contracts in the data reported through Tuesday. This was a weekly gain of 5,213 contracts from the previous week which had a total of 80,726 net contracts.
This week’s current strength score (the trader positioning range over the past three years, measured from 0 to 100) shows the speculators are currently Bullish with a score of 62.6 percent. The commercials are Bearish with a score of 32.1 percent and the small traders (not shown in chart) are Bullish with a score of 56.3 percent.
Price Trend-Following Model: Uptrend
Our weekly trend-following model classifies the current market price position as: Uptrend.
| LIVE CATTLE Futures Statistics | SPECULATORS | COMMERCIALS | SMALL TRADERS |
| – Percent of Open Interest Longs: | 44.6 | 33.1 | 8.5 |
| – Percent of Open Interest Shorts: | 18.1 | 55.9 | 12.2 |
| – Net Position: | 85,939 | -73,983 | -11,956 |
| – Gross Longs: | 144,736 | 107,437 | 27,580 |
| – Gross Shorts: | 58,797 | 181,420 | 39,536 |
| – Long to Short Ratio: | 2.5 to 1 | 0.6 to 1 | 0.7 to 1 |
| NET POSITION TREND: | | | |
| – Strength Index Score (3 Year Range Pct): | 62.6 | 32.1 | 56.3 |
| – Strength Index Reading (3 Year Range): | Bullish | Bearish | Bullish |
| NET POSITION MOVEMENT INDEX: | | | |
| – 6-Week Change in Strength Index: | 12.2 | -14.0 | -2.7 |
LEAN HOGS Futures:
 The LEAN HOGS large speculator standing this week reached a net position of 41,478 contracts in the data reported through Tuesday. This was a weekly rise of 90 contracts from the previous week which had a total of 41,388 net contracts.
This week’s current strength score (the trader positioning range over the past three years, measured from 0 to 100) shows the speculators are currently Bullish with a score of 55.6 percent. The commercials are Bearish with a score of 47.0 percent and the small traders (not shown in chart) are Bearish with a score of 39.6 percent.
Price Trend-Following Model: Uptrend
Our weekly trend-following model classifies the current market price position as: Uptrend.
| LEAN HOGS Futures Statistics | SPECULATORS | COMMERCIALS | SMALL TRADERS |
| – Percent of Open Interest Longs: | 38.7 | 35.7 | 6.8 |
| – Percent of Open Interest Shorts: | 25.1 | 47.2 | 8.9 |
| – Net Position: | 41,478 | -35,177 | -6,301 |
| – Gross Longs: | 117,956 | 108,712 | 20,863 |
| – Gross Shorts: | 76,478 | 143,889 | 27,164 |
| – Long to Short Ratio: | 1.5 to 1 | 0.8 to 1 | 0.8 to 1 |
| NET POSITION TREND: | | | |
| – Strength Index Score (3 Year Range Pct): | 55.6 | 47.0 | 39.6 |
| – Strength Index Reading (3 Year Range): | Bullish | Bearish | Bearish |
| NET POSITION MOVEMENT INDEX: | | | |
| – 6-Week Change in Strength Index: | 12.9 | -14.4 | 6.2 |
COTTON Futures:
 The COTTON large speculator standing this week reached a net position of -27,431 contracts in the data reported through Tuesday. This was a weekly lift of 1,489 contracts from the previous week which had a total of -28,920 net contracts.
This week’s current strength score (the trader positioning range over the past three years, measured from 0 to 100) shows the speculators are currently Bearish with a score of 22.7 percent. The commercials are Bullish with a score of 75.7 percent and the small traders (not shown in chart) are Bearish with a score of 45.3 percent.
Price Trend-Following Model: Downtrend
Our weekly trend-following model classifies the current market price position as: Downtrend.
| COTTON Futures Statistics | SPECULATORS | COMMERCIALS | SMALL TRADERS |
| – Percent of Open Interest Longs: | 27.1 | 45.7 | 4.6 |
| – Percent of Open Interest Shorts: | 35.5 | 38.2 | 3.7 |
| – Net Position: | -27,431 | 24,316 | 3,115 |
| – Gross Longs: | 88,834 | 149,665 | 15,181 |
| – Gross Shorts: | 116,265 | 125,349 | 12,066 |
| – Long to Short Ratio: | 0.8 to 1 | 1.2 to 1 | 1.3 to 1 |
| NET POSITION TREND: | | | |
| – Strength Index Score (3 Year Range Pct): | 22.7 | 75.7 | 45.3 |
| – Strength Index Reading (3 Year Range): | Bearish | Bullish | Bearish |
| NET POSITION MOVEMENT INDEX: | | | |
| – 6-Week Change in Strength Index: | 6.9 | -8.6 | 29.9 |
COCOA Futures:
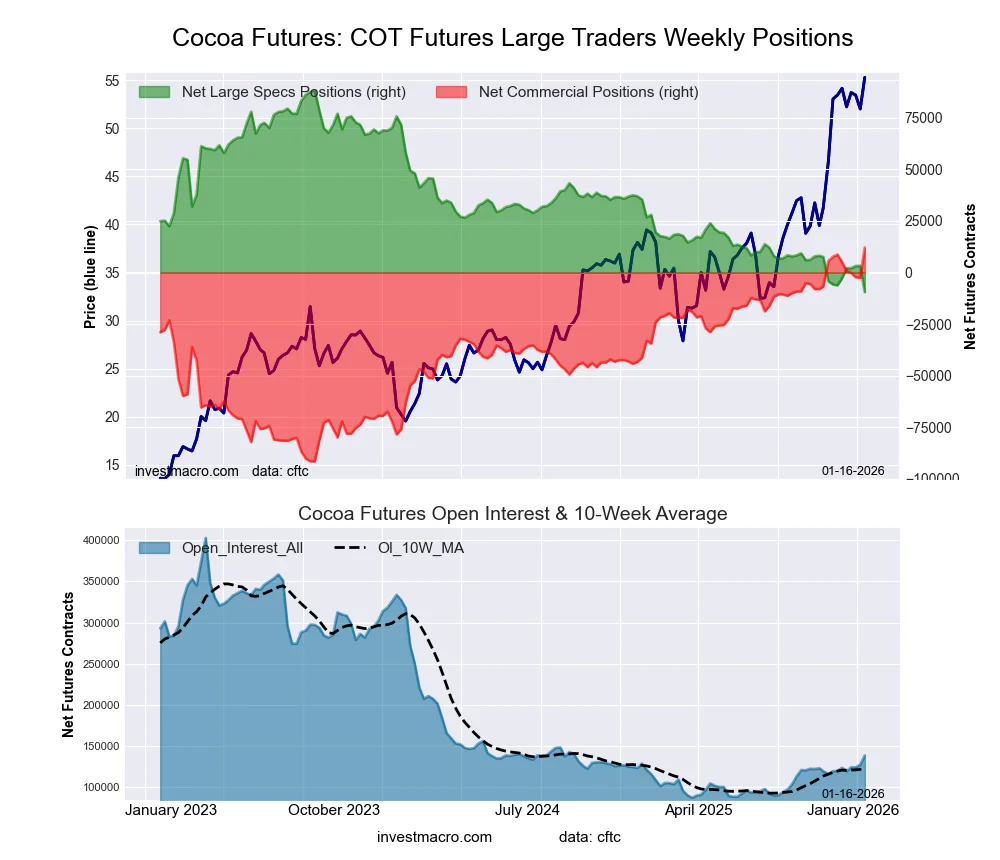 The COCOA large speculator standing this week reached a net position of -9,496 contracts in the data reported through Tuesday. This was a weekly decline of -12,726 contracts from the previous week which had a total of 3,230 net contracts.
This week’s current strength score (the trader positioning range over the past three years, measured from 0 to 100) shows the speculators are currently Bearish-Extreme with a score of 0.0 percent. The commercials are Bullish-Extreme with a score of 100.0 percent and the small traders (not shown in chart) are Bearish-Extreme with a score of 2.5 percent.
Price Trend-Following Model: Uptrend
Our weekly trend-following model classifies the current market price position as: Uptrend.
| COCOA Futures Statistics | SPECULATORS | COMMERCIALS | SMALL TRADERS |
| – Percent of Open Interest Longs: | 19.5 | 47.0 | 6.9 |
| – Percent of Open Interest Shorts: | 26.4 | 38.2 | 8.8 |
| – Net Position: | -9,496 | 12,095 | -2,599 |
| – Gross Longs: | 27,010 | 65,030 | 9,528 |
| – Gross Shorts: | 36,506 | 52,935 | 12,127 |
| – Long to Short Ratio: | 0.7 to 1 | 1.2 to 1 | 0.8 to 1 |
| NET POSITION TREND: | | | |
| – Strength Index Score (3 Year Range Pct): | 0.0 | 100.0 | 2.5 |
| – Strength Index Reading (3 Year Range): | Bearish-Extreme | Bullish-Extreme | Bearish-Extreme |
| NET POSITION MOVEMENT INDEX: | | | |
| – 6-Week Change in Strength Index: | -3.4 | 3.2 | -0.5 |
WHEAT Futures:

The WHEAT large speculator standing this week reached a net position of -86,025 contracts in the data reported through Tuesday. This was a weekly rise of 2,066 contracts from the previous week which had a total of -88,091 net contracts.
This week’s current strength score (the trader positioning range over the past three years, measured from 0 to 100) shows the speculators are currently Bearish with a score of 28.5 percent. The commercials are Bullish with a score of 72.6 percent and the small traders (not shown in chart) are Bullish with a score of 60.8 percent.
Price Trend-Following Model: Uptrend
Our weekly trend-following model classifies the current market price position as: Uptrend.
| WHEAT Futures Statistics | SPECULATORS | COMMERCIALS | SMALL TRADERS |
| – Percent of Open Interest Longs: | 24.9 | 36.7 | 5.9 |
| – Percent of Open Interest Shorts: | 41.7 | 20.2 | 5.7 |
| – Net Position: | -86,025 | 84,878 | 1,147 |
| – Gross Longs: | 128,167 | 188,716 | 30,432 |
| – Gross Shorts: | 214,192 | 103,838 | 29,285 |
| – Long to Short Ratio: | 0.6 to 1 | 1.8 to 1 | 1.0 to 1 |
| NET POSITION TREND: | | | |
| – Strength Index Score (3 Year Range Pct): | 28.5 | 72.6 | 60.8 |
| – Strength Index Reading (3 Year Range): | Bearish | Bullish | Bullish |
| NET POSITION MOVEMENT INDEX: | | | |
| – 6-Week Change in Strength Index: | -52.9 | 53.3 | 35.4 |
Article By InvestMacro – Receive our weekly COT Newsletter
*COT Report: The COT data, released weekly to the public each Friday, is updated through the most recent Tuesday (data is 3 days old) and shows a quick view of how large speculators or non-commercials (for-profit traders) were positioned in the futures markets.
The CFTC categorizes trader positions according to commercial hedgers (traders who use futures contracts for hedging as part of the business), non-commercials (large traders who speculate to realize trading profits) and nonreportable traders (usually small traders/speculators) as well as their open interest (contracts open in the market at time of reporting). See CFTC criteria here.