
By Analytical Department RoboForex
Gold prices fell below 5,150 USD per ounce on Thursday, marking a second consecutive session of decline. Pressure on the market has intensified amid a sharp rise in oil prices, which heightens inflation risks and reduces the likelihood of imminent interest rate cuts by central banks.
Oil has rallied for a second straight day. The market remains concerned about the prospect of a protracted conflict involving Iran, with these worries outweighing the effect of a coordinated release of strategic oil reserves by major economies.
Despite the International Energy Agency’s decision to execute the largest release in history—400 million barrels—investors considered the move insufficient to stabilise the market.
A strengthening US dollar and rising Treasury yields have added further pressure on gold. Increased inflation expectations have diminished the probability of Federal Reserve easing, with the market now pricing in only one rate cut before year-end.
Data released yesterday showed that core inflation in the United States remains moderate at the start of the year. Meanwhile, the European Union has warned that inflation in the region could exceed 3% in 2026.
Free Reports:
 Get our Weekly Commitment of Traders Reports - See where the biggest traders (Hedge Funds and Commercial Hedgers) are positioned in the futures markets on a weekly basis.
 Sign Up for Our Stock Market Newsletter – Get updated on News, Charts & Rankings of Public Companies when you join our Stocks Newsletter
Technical Analysis
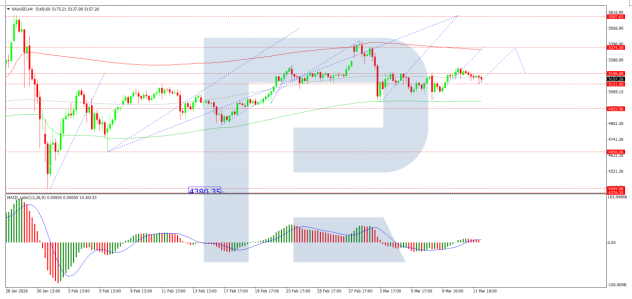
On the H4 XAU/USD chart, the market is forming a consolidation range around the 5,196 USD level. A downside breakout would open potential for a continuation of the correction towards 4,953 USD. Conversely, an upside breakout would suggest the development of a growth wave towards the 5,390 USD level. The MACD indicator confirms the current momentum, with its signal line above zero and pointing upwards.
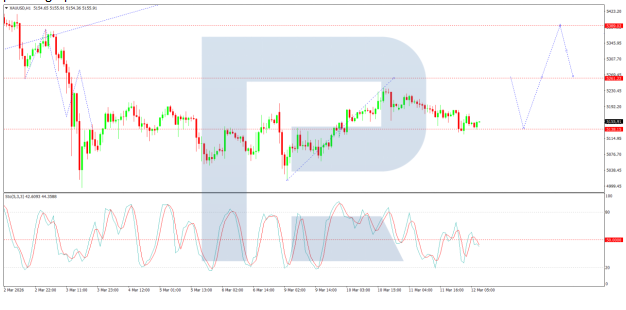
On the H1 chart, the market broke above the 5,135 USD level and completed a growth wave to 5,233 USD, before retracing to 5,140 USD. Looking ahead, the likelihood of a new growth wave developing towards the 5,262 USD level will be considered. The Stochastic oscillator supports this scenario, with its signal line remaining above the 50 level and retaining upside potential towards level 80.
Conclusion
Gold faces mounting headwinds as surging oil prices, driven by geopolitical tensions in the Middle East, reinforce inflation concerns and push central bank rate cut expectations further out. The dollar’s strength and rising yields compound the pressure on the non-yielding asset. While technical indicators suggest potential for a short-term bounce, the broader outlook remains cautious as markets digest the implications of sustained energy price inflation and its impact on monetary policy trajectories.
Disclaimer
Any forecasts contained herein are based on the author’s particular opinion. This analysis may not be treated as trading advice. RoboForex bears no responsibility for trading results based on trading recommendations and reviews contained herein.

- COT Metals Charts: Weekly Speculator Changes led by Copper Jul 26, 2026
- COT Bonds Charts: Speculator Bets led by SOFR 3-Months & 5-Year Bonds Jul 26, 2026
- COT Energy Charts: Weekly Speculator Bets led by WTI Crude & Natural Gas Jul 26, 2026
- COT Soft Commodities Charts: Weekly Speculator Bets led by Corn & Soybeans Jul 26, 2026
- The US introduces new import tariffs for 60 countries. Brent crude surpasses $100 per barrel Jul 24, 2026
- USD/JPY Breaks Records: Nothing Slows the Yen’s Decline Jul 24, 2026
- Oil prices reached a 6‑week high. The AUD strengthened on the back of a strong labor‑market report Jul 23, 2026
- EUR/USD Recovers as Dollar Weakens Jul 23, 2026
- Bitcoin rose to $66,000. The New Zealand dollar continues to strengthen Jul 22, 2026
- Inflationary pressure is easing in Canada. In New Zealand, on the contrary, inflation is rising Jul 21, 2026
