By InvestMacro
Here are the latest charts and statistics for the Commitment of Traders (COT) data published by the Commodities Futures Trading Commission (CFTC).
The latest COT data is updated through Tuesday January 31st and shows a quick view of how large traders (for-profit speculators and commercial entities) were positioned in the futures markets.
*** This data is almost a month old because the CFTC up-to-date data has been delayed due to a cybersecurity event that happened in early February to ION Cleared Derivatives (a subsidiary of ION Markets). This hack of ION has created a problem for the large trader positions to be reported and reconciled. The CFTC states that they will be back-filling the data over the next couple weeks and will get the data back up to date.
Weekly Speculator Changes led by Sugar & Soybeans
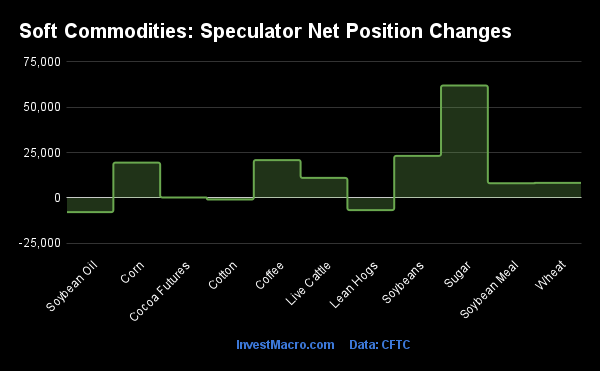
The COT soft commodities markets speculator bets were higher for the week as eight out of the eleven softs markets we cover had higher positioning while the other three markets had lower speculator contracts.
Leading the gains for the softs markets was Sugar (61,988 contracts), Soybeans (23,176 contracts), Coffee (20,847 contracts), Corn (19,443 contracts), Live Cattle (10,995 contracts), Wheat (8,260 contracts), Soybean Meal (8,045 contracts) and Cocoa (218 contracts) also showing positive weeks.
The markets with the declines in speculator bets were Lean Hogs (-6,760 contracts) with Soybean Oil (-7,879 contracts) and Cotton (-928 contracts) also registering lower bets on the week.
| Jan-31-2023 | OI | OI-Index | Spec-Net | Spec-Index | Com-Net | COM-Index | Smalls-Net | Smalls-Index |
|---|
| WTI Crude | 1,726,378 | 29 | 243,820 | 10 | -266,622 | 89 | 22,802 | 37 |
| Gold | 471,642 | 16 | 160,281 | 36 | -180,520 | 63 | 20,239 | 31 |
| Silver | 138,263 | 14 | 27,316 | 44 | -40,434 | 57 | 13,118 | 37 |
| Copper | 224,824 | 61 | 17,215 | 50 | -24,414 | 48 | 7,199 | 67 |
| Palladium | 11,245 | 34 | -4,271 | 0 | 4,632 | 100 | -361 | 20 |
| Platinum | 69,121 | 40 | 16,137 | 33 | -22,213 | 65 | 6,076 | 49 |
| Natural Gas | 1,146,709 | 38 | -169,214 | 24 | 134,013 | 76 | 35,201 | 63 |
| Brent | 156,929 | 16 | -43,407 | 26 | 39,572 | 70 | 3,835 | 61 |
| Heating Oil | 265,444 | 22 | 21,747 | 74 | -45,428 | 23 | 23,681 | 80 |
| Soybeans | 689,806 | 25 | 178,398 | 67 | -137,153 | 46 | -41,245 | 1 |
| Corn | 1,298,164 | 14 | 296,812 | 68 | -225,622 | 40 | -71,190 | 2 |
| Coffee | 221,894 | 29 | -1,881 | 25 | -926 | 75 | 2,807 | 39 |
| Sugar | 995,391 | 55 | 247,072 | 79 | -292,448 | 19 | 45,376 | 64 |
| Wheat | 350,871 | 29 | -40,060 | 7 | 41,564 | 90 | -1,504 | 100 |
Strength Scores led by Soybean Meal & Sugar
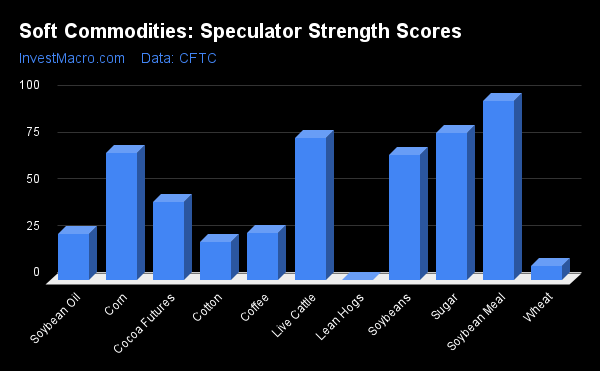
COT Strength Scores (a normalized measure of Speculator positions over a 3-Year range, from 0 to 100 where above 80 is Extreme-Bullish and below 20 is Extreme-Bearish) showed that Soybean Meal (96 percent) and Sugar (79 percent) led the softs markets for the week. Live Cattle (76 percent), Corn (68 percent) and Soybeans (67 percent) came in as the next highest in the weekly strength scores.
On the downside, Lean Hogs (0 percent) and Wheat (7 percent) come in at the lowest strength levels currently and were in Extreme-Bearish territory (below 20 percent). The next lowest strength scores were the Cotton (20 percent) and the Soybean Oil (24 percent).
Strength Statistics:
Corn (67.9 percent) vs Corn previous week (65.5 percent)
Sugar (78.9 percent) vs Sugar previous week (57.6 percent)
Coffee (25.5 percent) vs Coffee previous week (4.1 percent)
Soybeans (66.8 percent) vs Soybeans previous week (59.4 percent)
Soybean Oil (24.5 percent) vs Soybean Oil previous week (29.9 percent)
Soybean Meal (96.0 percent) vs Soybean Meal previous week (92.3 percent)
Live Cattle (76.2 percent) vs Live Cattle previous week (62.4 percent)
Lean Hogs (0.0 percent) vs Lean Hogs previous week (7.6 percent)
Cotton (20.2 percent) vs Cotton previous week (20.9 percent)
Cocoa (41.7 percent) vs Cocoa previous week (41.5 percent)
Wheat (7.5 percent) vs Wheat previous week (0.0 percent)
Live Cattle & Soybeans top the 6-Week Strength Trends
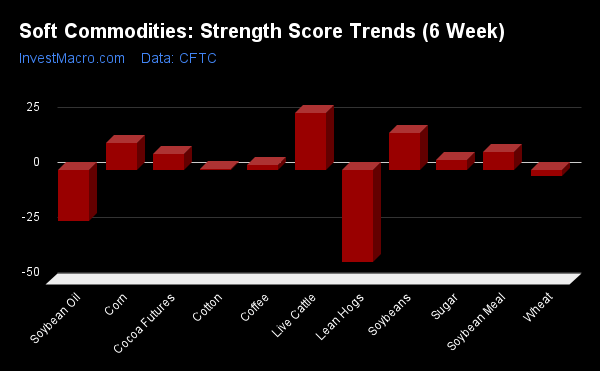
COT Strength Score Trends (or move index, calculates the 6-week changes in strength scores) showed that Live Cattle (26 percent) and Soybeans (17 percent) led the six weeks trends for soft commodities. Corn (12 percent), Soybean Meal (8 percent) and Cocoa (7 percent) were the next highest positive movers in the latest trends data.
Lean Hogs (-42 percent) led the downside trend scores with Soybean Oil (-23 percent), Wheat (-3 percent) and Cotton (0 percent) following next with lower trend scores.
Strength Trend Statistics:
Corn (12.4 percent) vs Corn previous week (8.3 percent)
Sugar (4.8 percent) vs Sugar previous week (-2.7 percent)
Coffee (2.5 percent) vs Coffee previous week (-13.6 percent)
Soybeans (17.2 percent) vs Soybeans previous week (13.5 percent)
Soybean Oil (-23.0 percent) vs Soybean Oil previous week (-11.3 percent)
Soybean Meal (8.2 percent) vs Soybean Meal previous week (7.5 percent)
Live Cattle (26.0 percent) vs Live Cattle previous week (9.3 percent)
Lean Hogs (-41.9 percent) vs Lean Hogs previous week (-34.2 percent)
Cotton (0.4 percent) vs Cotton previous week (2.6 percent)
Cocoa (7.3 percent) vs Cocoa previous week (1.6 percent)
Wheat (-2.8 percent) vs Wheat previous week (-7.6 percent)
Individual Soft Commodities Markets:
CORN Futures:
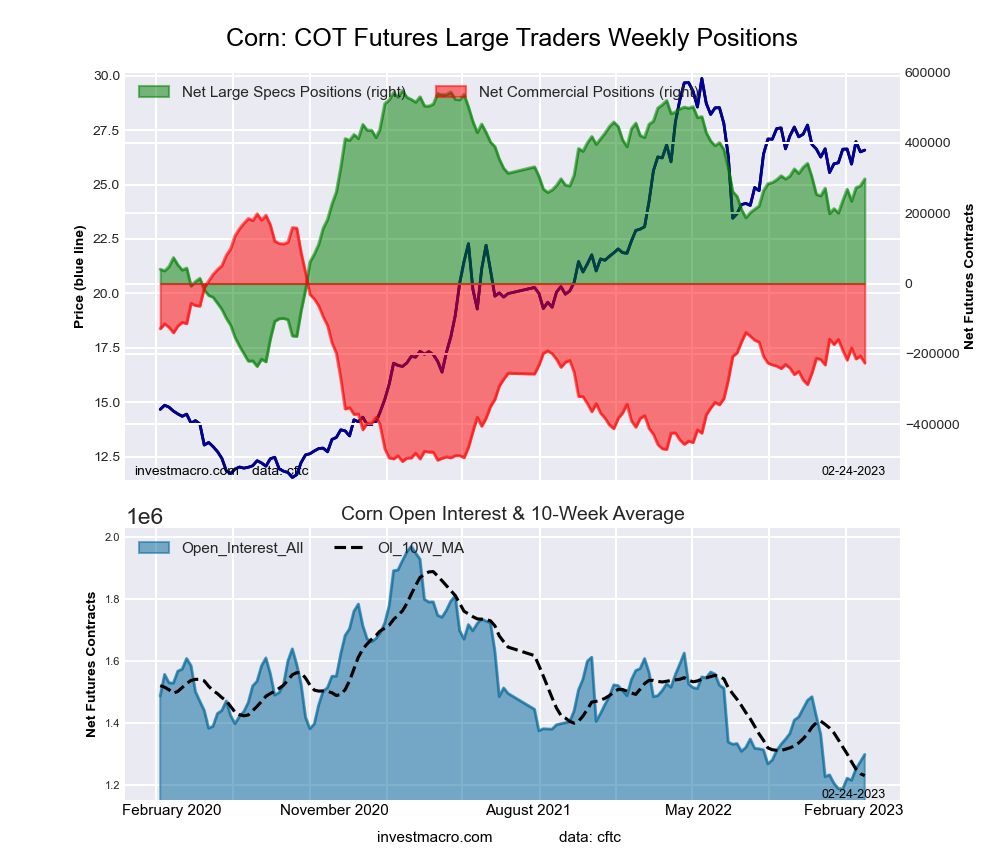 The CORN large speculator standing for the week was a net position of 296,812 contracts in the data reported through January 31st. This was a weekly boost of 19,443 contracts from the previous week which had a total of 277,369 net contracts.
This week’s current strength score (the trader positioning range over the past three years, measured from 0 to 100) shows the speculators are currently Bullish with a score of 67.9 percent. The commercials are Bearish with a score of 39.8 percent and the small traders (not shown in chart) are Bearish-Extreme with a score of 2.5 percent.
| CORN Futures Statistics | SPECULATORS | COMMERCIALS | SMALL TRADERS |
| – Percent of Open Interest Longs: | 31.4 | 42.0 | 8.9 |
| – Percent of Open Interest Shorts: | 8.5 | 59.4 | 14.4 |
| – Net Position: | 296,812 | -225,622 | -71,190 |
| – Gross Longs: | 407,766 | 545,068 | 115,712 |
| – Gross Shorts: | 110,954 | 770,690 | 186,902 |
| – Long to Short Ratio: | 3.7 to 1 | 0.7 to 1 | 0.6 to 1 |
| NET POSITION TREND: | | | |
| – Strength Index Score (3 Year Range Pct): | 67.9 | 39.8 | 2.5 |
| – Strength Index Reading (3 Year Range): | Bullish | Bearish | Bearish-Extreme |
| NET POSITION MOVEMENT INDEX: | | | |
| – 6-Week Change in Strength Index: | 12.4 | -9.5 | -20.3 |
SUGAR Futures:
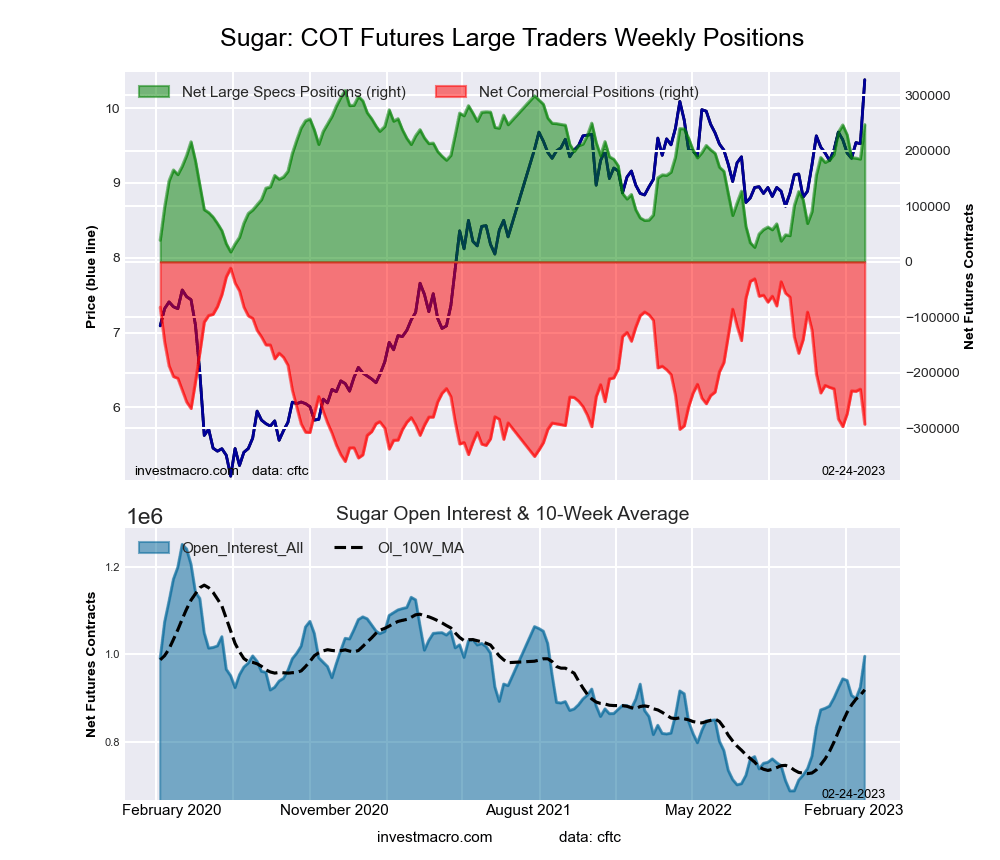 The SUGAR large speculator standing for the week was a net position of 247,072 contracts in the data reported. This was a weekly increase of 61,988 contracts from the previous week which had a total of 185,084 net contracts.
This week’s current strength score (the trader positioning range over the past three years, measured from 0 to 100) shows the speculators are currently Bullish with a score of 78.9 percent. The commercials are Bearish-Extreme with a score of 19.3 percent and the small traders (not shown in chart) are Bullish with a score of 64.0 percent.
| SUGAR Futures Statistics | SPECULATORS | COMMERCIALS | SMALL TRADERS |
| – Percent of Open Interest Longs: | 33.5 | 39.2 | 10.3 |
| – Percent of Open Interest Shorts: | 8.7 | 68.5 | 5.7 |
| – Net Position: | 247,072 | -292,448 | 45,376 |
| – Gross Longs: | 333,718 | 389,834 | 102,320 |
| – Gross Shorts: | 86,646 | 682,282 | 56,944 |
| – Long to Short Ratio: | 3.9 to 1 | 0.6 to 1 | 1.8 to 1 |
| NET POSITION TREND: | | | |
| – Strength Index Score (3 Year Range Pct): | 78.9 | 19.3 | 64.0 |
| – Strength Index Reading (3 Year Range): | Bullish | Bearish-Extreme | Bullish |
| NET POSITION MOVEMENT INDEX: | | | |
| – 6-Week Change in Strength Index: | 4.8 | -2.7 | -5.6 |
COFFEE Futures:
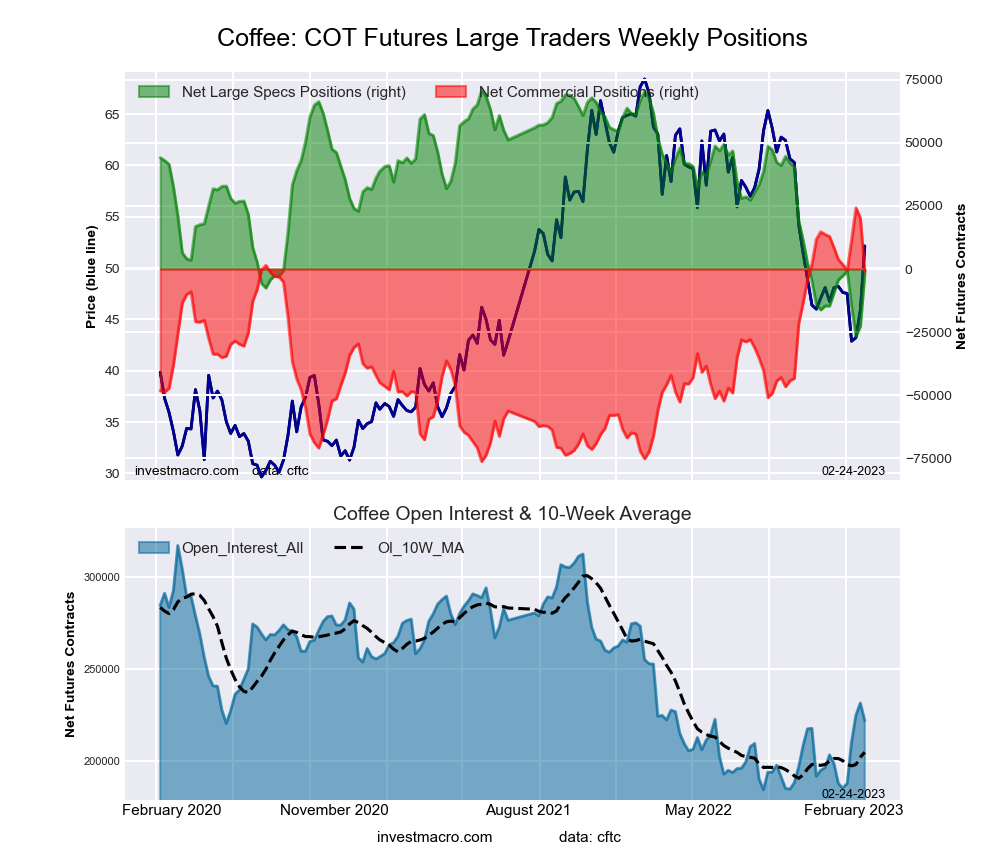 The COFFEE large speculator standing for the week was a net position of -1,881 contracts in the data reported. This was a weekly increase of 20,847 contracts from the previous week which had a total of -22,728 net contracts.
This week’s current strength score (the trader positioning range over the past three years, measured from 0 to 100) shows the speculators are currently Bearish with a score of 25.5 percent. The commercials are Bullish with a score of 75.0 percent and the small traders (not shown in chart) are Bearish with a score of 38.5 percent.
| COFFEE Futures Statistics | SPECULATORS | COMMERCIALS | SMALL TRADERS |
| – Percent of Open Interest Longs: | 20.7 | 46.2 | 4.8 |
| – Percent of Open Interest Shorts: | 21.5 | 46.6 | 3.5 |
| – Net Position: | -1,881 | -926 | 2,807 |
| – Gross Longs: | 45,937 | 102,565 | 10,630 |
| – Gross Shorts: | 47,818 | 103,491 | 7,823 |
| – Long to Short Ratio: | 1.0 to 1 | 1.0 to 1 | 1.4 to 1 |
| NET POSITION TREND: | | | |
| – Strength Index Score (3 Year Range Pct): | 25.5 | 75.0 | 38.5 |
| – Strength Index Reading (3 Year Range): | Bearish | Bullish | Bearish |
| NET POSITION MOVEMENT INDEX: | | | |
| – 6-Week Change in Strength Index: | 2.5 | -4.7 | 31.8 |
SOYBEANS Futures:
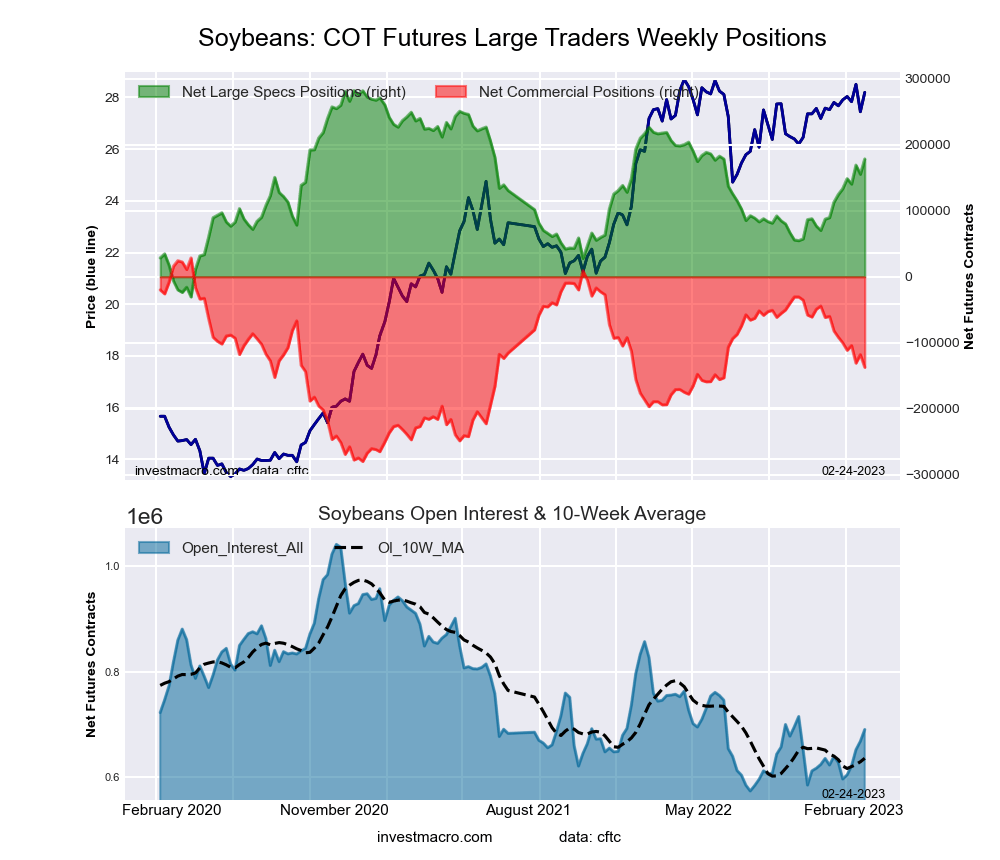 The SOYBEANS large speculator standing for the week was a net position of 178,398 contracts in the data reported. This was a weekly advance of 23,176 contracts from the previous week which had a total of 155,222 net contracts.
This week’s current strength score (the trader positioning range over the past three years, measured from 0 to 100) shows the speculators are currently Bullish with a score of 66.8 percent. The commercials are Bearish with a score of 46.3 percent and the small traders (not shown in chart) are Bearish-Extreme with a score of 1.3 percent.
| SOYBEANS Futures Statistics | SPECULATORS | COMMERCIALS | SMALL TRADERS |
| – Percent of Open Interest Longs: | 32.3 | 46.8 | 6.6 |
| – Percent of Open Interest Shorts: | 6.4 | 66.7 | 12.6 |
| – Net Position: | 178,398 | -137,153 | -41,245 |
| – Gross Longs: | 222,823 | 323,166 | 45,644 |
| – Gross Shorts: | 44,425 | 460,319 | 86,889 |
| – Long to Short Ratio: | 5.0 to 1 | 0.7 to 1 | 0.5 to 1 |
| NET POSITION TREND: | | | |
| – Strength Index Score (3 Year Range Pct): | 66.8 | 46.3 | 1.3 |
| – Strength Index Reading (3 Year Range): | Bullish | Bearish | Bearish-Extreme |
| NET POSITION MOVEMENT INDEX: | | | |
| – 6-Week Change in Strength Index: | 17.2 | -14.8 | -14.0 |
SOYBEAN OIL Futures:
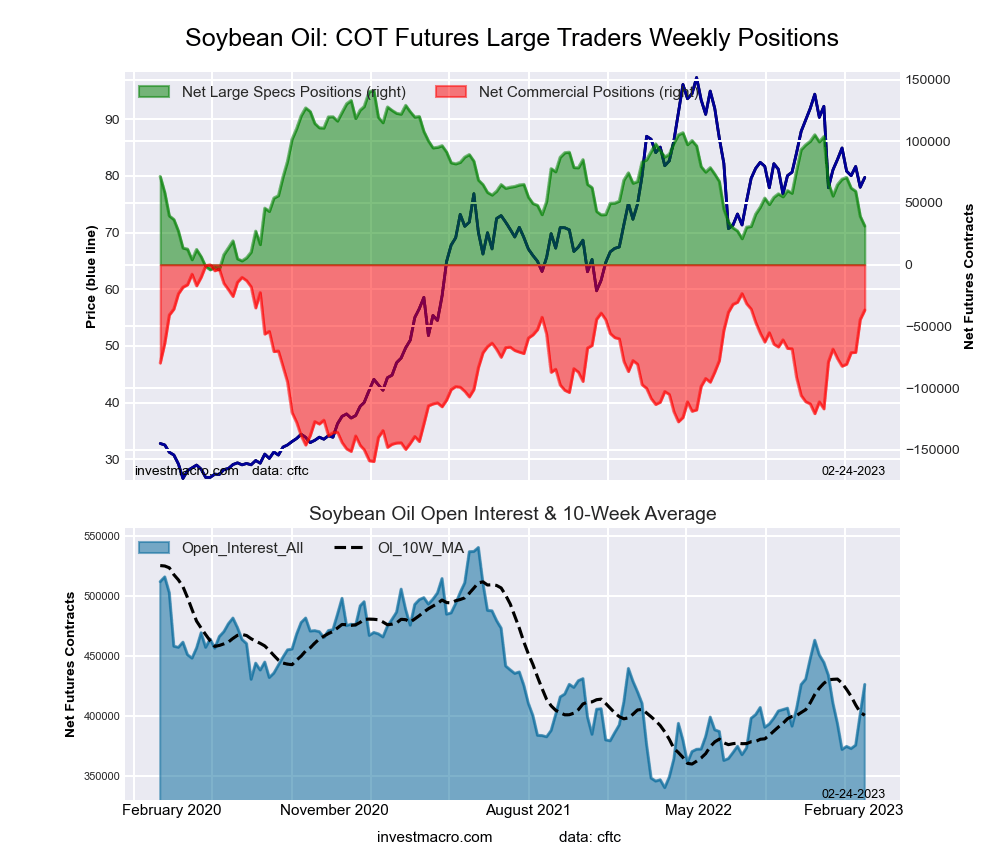 The SOYBEAN OIL large speculator standing for the week was a net position of 31,371 contracts in the data reported. This was a weekly lowering of -7,879 contracts from the previous week which had a total of 39,250 net contracts.
This week’s current strength score (the trader positioning range over the past three years, measured from 0 to 100) shows the speculators are currently Bearish with a score of 24.5 percent. The commercials are Bullish with a score of 77.0 percent and the small traders (not shown in chart) are Bearish with a score of 33.7 percent.
| SOYBEAN OIL Futures Statistics | SPECULATORS | COMMERCIALS | SMALL TRADERS |
| – Percent of Open Interest Longs: | 18.2 | 52.5 | 8.3 |
| – Percent of Open Interest Shorts: | 10.8 | 61.2 | 7.0 |
| – Net Position: | 31,371 | -36,797 | 5,426 |
| – Gross Longs: | 77,553 | 223,986 | 35,438 |
| – Gross Shorts: | 46,182 | 260,783 | 30,012 |
| – Long to Short Ratio: | 1.7 to 1 | 0.9 to 1 | 1.2 to 1 |
| NET POSITION TREND: | | | |
| – Strength Index Score (3 Year Range Pct): | 24.5 | 77.0 | 33.7 |
| – Strength Index Reading (3 Year Range): | Bearish | Bullish | Bearish |
| NET POSITION MOVEMENT INDEX: | | | |
| – 6-Week Change in Strength Index: | -23.0 | 24.7 | -22.0 |
SOYBEAN MEAL Futures:
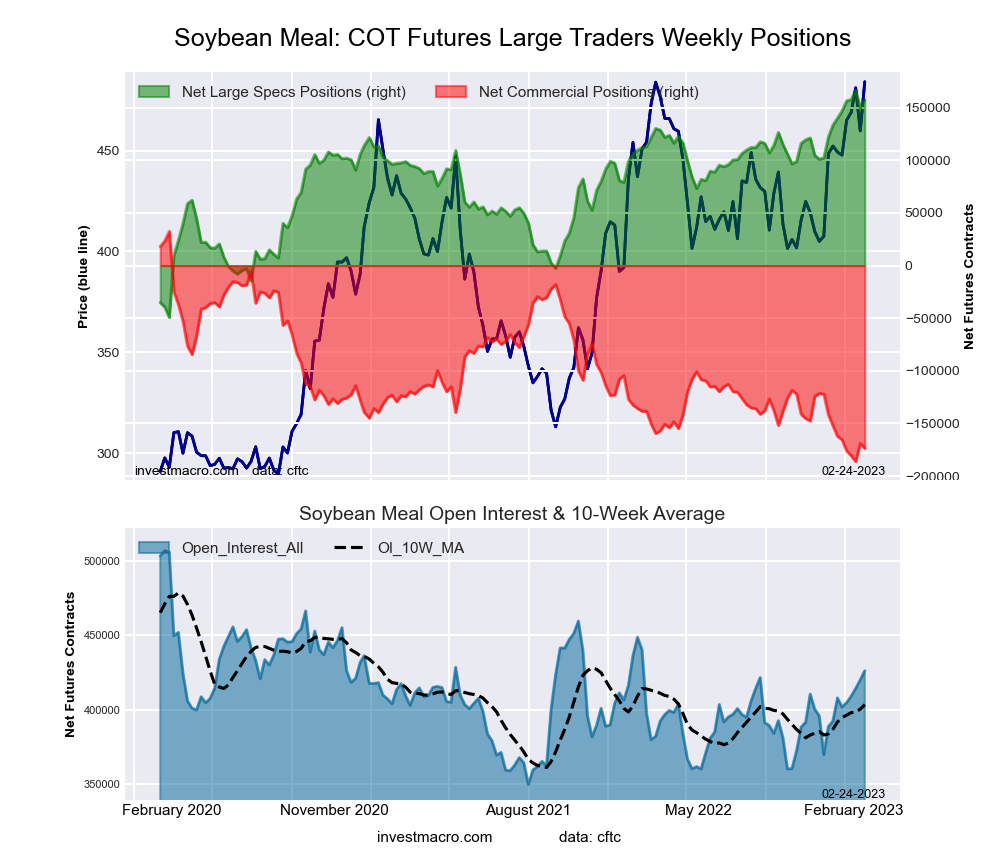 The SOYBEAN MEAL large speculator standing for the week was a net position of 157,830 contracts in the data reported. This was a weekly advance of 8,045 contracts from the previous week which had a total of 149,785 net contracts.
This week’s current strength score (the trader positioning range over the past three years, measured from 0 to 100) shows the speculators are currently Bullish-Extreme with a score of 96.0 percent. The commercials are Bearish-Extreme with a score of 5.7 percent and the small traders (not shown in chart) are Bearish-Extreme with a score of 15.5 percent.
| SOYBEAN MEAL Futures Statistics | SPECULATORS | COMMERCIALS | SMALL TRADERS |
| – Percent of Open Interest Longs: | 41.0 | 33.1 | 11.1 |
| – Percent of Open Interest Shorts: | 4.0 | 73.9 | 7.3 |
| – Net Position: | 157,830 | -173,741 | 15,911 |
| – Gross Longs: | 174,746 | 141,045 | 47,162 |
| – Gross Shorts: | 16,916 | 314,786 | 31,251 |
| – Long to Short Ratio: | 10.3 to 1 | 0.4 to 1 | 1.5 to 1 |
| NET POSITION TREND: | | | |
| – Strength Index Score (3 Year Range Pct): | 96.0 | 5.7 | 15.5 |
| – Strength Index Reading (3 Year Range): | Bullish-Extreme | Bearish-Extreme | Bearish-Extreme |
| NET POSITION MOVEMENT INDEX: | | | |
| – 6-Week Change in Strength Index: | 8.2 | -5.3 | -31.9 |
LIVE CATTLE Futures:
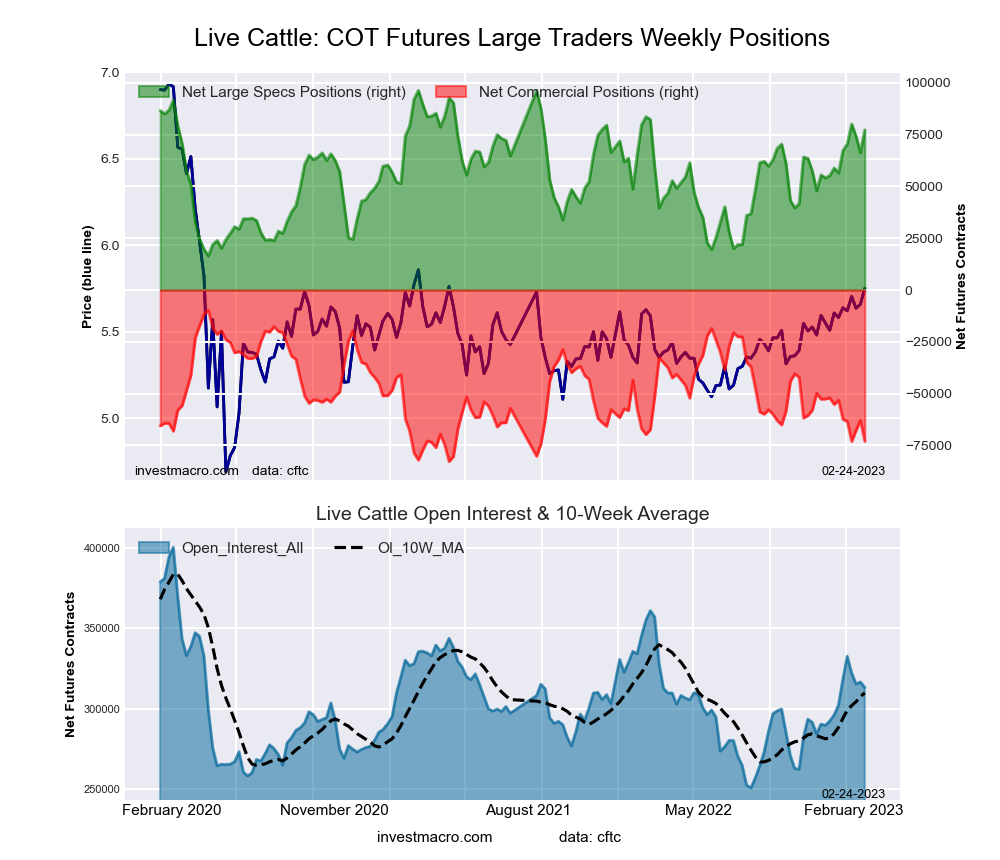 The LIVE CATTLE large speculator standing for the week was a net position of 77,223 contracts in the data reported. This was a weekly boost of 10,995 contracts from the previous week which had a total of 66,228 net contracts.
This week’s current strength score (the trader positioning range over the past three years, measured from 0 to 100) shows the speculators are currently Bullish with a score of 76.2 percent. The commercials are Bearish-Extreme with a score of 13.4 percent and the small traders (not shown in chart) are Bullish with a score of 65.6 percent.
| LIVE CATTLE Futures Statistics | SPECULATORS | COMMERCIALS | SMALL TRADERS |
| – Percent of Open Interest Longs: | 40.5 | 28.2 | 11.0 |
| – Percent of Open Interest Shorts: | 15.9 | 51.5 | 12.4 |
| – Net Position: | 77,223 | -72,958 | -4,265 |
| – Gross Longs: | 126,874 | 88,274 | 34,568 |
| – Gross Shorts: | 49,651 | 161,232 | 38,833 |
| – Long to Short Ratio: | 2.6 to 1 | 0.5 to 1 | 0.9 to 1 |
| NET POSITION TREND: | | | |
| – Strength Index Score (3 Year Range Pct): | 76.2 | 13.4 | 65.6 |
| – Strength Index Reading (3 Year Range): | Bullish | Bearish-Extreme | Bullish |
| NET POSITION MOVEMENT INDEX: | | | |
| – 6-Week Change in Strength Index: | 26.0 | -27.2 | -5.2 |
LEAN HOGS Futures:
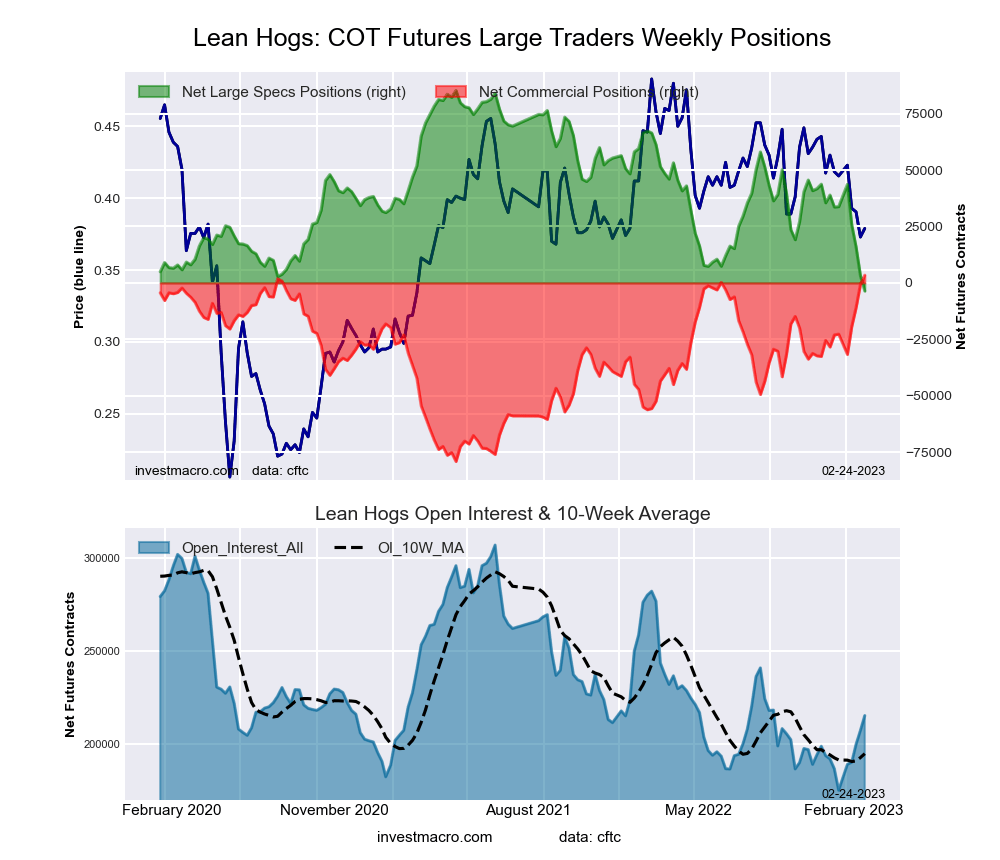 The LEAN HOGS large speculator standing for the week was a net position of -3,594 contracts in the data reported. This was a weekly lowering of -6,760 contracts from the previous week which had a total of 3,166 net contracts.
This week’s current strength score (the trader positioning range over the past three years, measured from 0 to 100) shows the speculators are currently Bearish-Extreme with a score of 0.0 percent. The commercials are Bullish-Extreme with a score of 100.0 percent and the small traders (not shown in chart) are Bullish-Extreme with a score of 100.0 percent.
| LEAN HOGS Futures Statistics | SPECULATORS | COMMERCIALS | SMALL TRADERS |
| – Percent of Open Interest Longs: | 31.2 | 36.6 | 11.9 |
| – Percent of Open Interest Shorts: | 32.9 | 35.0 | 11.8 |
| – Net Position: | -3,594 | 3,412 | 182 |
| – Gross Longs: | 67,149 | 78,668 | 25,530 |
| – Gross Shorts: | 70,743 | 75,256 | 25,348 |
| – Long to Short Ratio: | 0.9 to 1 | 1.0 to 1 | 1.0 to 1 |
| NET POSITION TREND: | | | |
| – Strength Index Score (3 Year Range Pct): | 0.0 | 100.0 | 100.0 |
| – Strength Index Reading (3 Year Range): | Bearish-Extreme | Bullish-Extreme | Bullish-Extreme |
| NET POSITION MOVEMENT INDEX: | | | |
| – 6-Week Change in Strength Index: | -41.9 | 31.6 | 60.1 |
COTTON Futures:
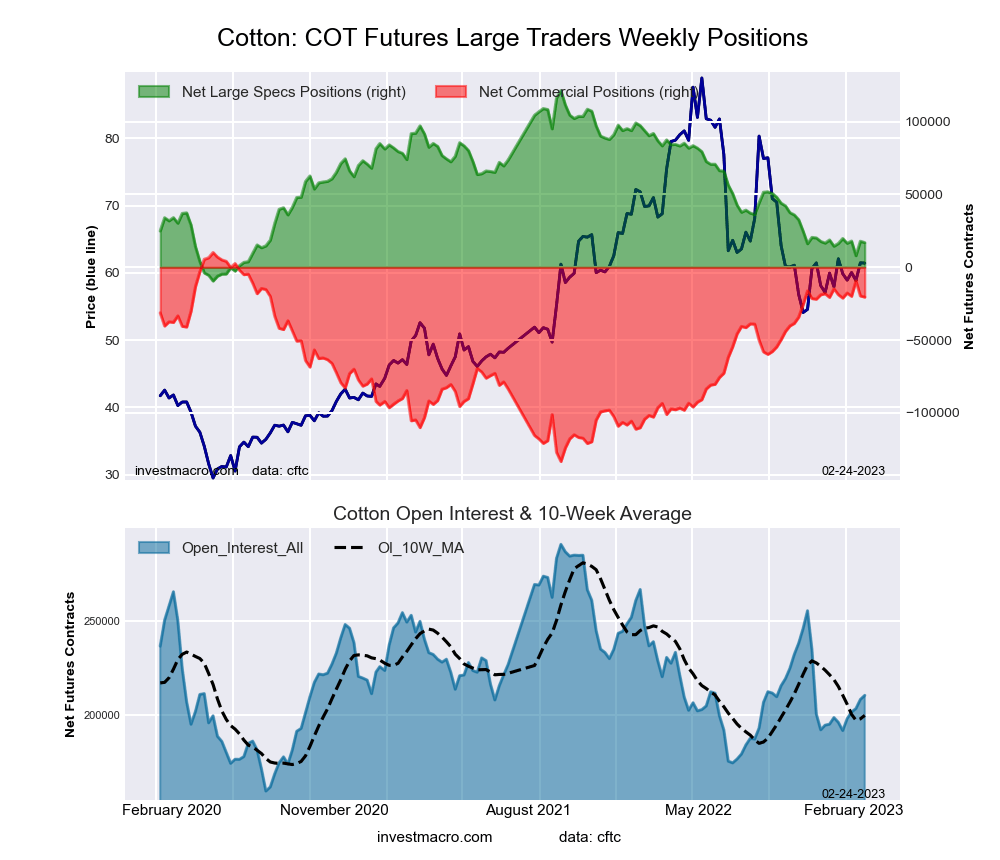 The COTTON large speculator standing for the week was a net position of 16,905 contracts in the data reported. This was a weekly decline of -928 contracts from the previous week which had a total of 17,833 net contracts.
This week’s current strength score (the trader positioning range over the past three years, measured from 0 to 100) shows the speculators are currently Bearish with a score of 20.2 percent. The commercials are Bullish with a score of 78.7 percent and the small traders (not shown in chart) are Bearish with a score of 33.5 percent.
| COTTON Futures Statistics | SPECULATORS | COMMERCIALS | SMALL TRADERS |
| – Percent of Open Interest Longs: | 29.2 | 47.6 | 7.1 |
| – Percent of Open Interest Shorts: | 21.2 | 57.3 | 5.4 |
| – Net Position: | 16,905 | -20,488 | 3,583 |
| – Gross Longs: | 61,398 | 100,108 | 14,890 |
| – Gross Shorts: | 44,493 | 120,596 | 11,307 |
| – Long to Short Ratio: | 1.4 to 1 | 0.8 to 1 | 1.3 to 1 |
| NET POSITION TREND: | | | |
| – Strength Index Score (3 Year Range Pct): | 20.2 | 78.7 | 33.5 |
| – Strength Index Reading (3 Year Range): | Bearish | Bullish | Bearish |
| NET POSITION MOVEMENT INDEX: | | | |
| – 6-Week Change in Strength Index: | 0.4 | -1.2 | 7.0 |
COCOA Futures:
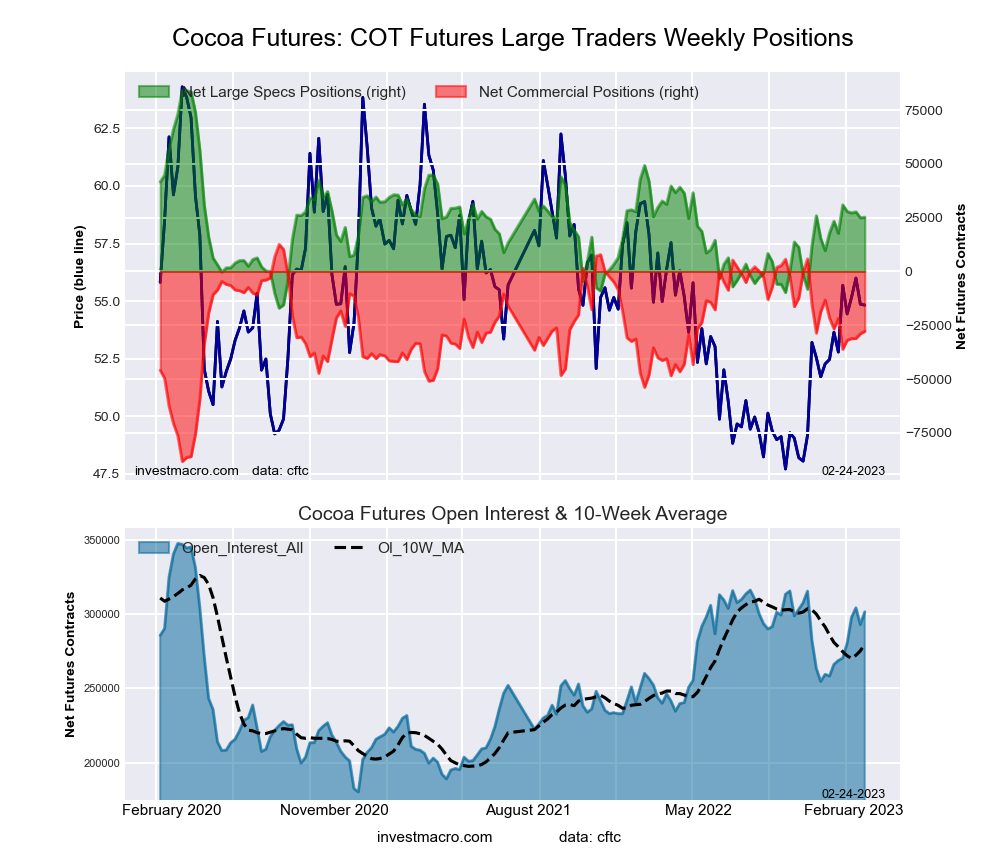 The COCOA large speculator standing for the week was a net position of 25,159 contracts in the data reported. This was a weekly rise of 218 contracts from the previous week which had a total of 24,941 net contracts.
This week’s current strength score (the trader positioning range over the past three years, measured from 0 to 100) shows the speculators are currently Bearish with a score of 41.7 percent. The commercials are Bullish with a score of 59.9 percent and the small traders (not shown in chart) are Bearish with a score of 23.1 percent.
| COCOA Futures Statistics | SPECULATORS | COMMERCIALS | SMALL TRADERS |
| – Percent of Open Interest Longs: | 31.0 | 47.4 | 4.1 |
| – Percent of Open Interest Shorts: | 22.7 | 56.6 | 3.2 |
| – Net Position: | 25,159 | -27,818 | 2,659 |
| – Gross Longs: | 93,440 | 142,793 | 12,252 |
| – Gross Shorts: | 68,281 | 170,611 | 9,593 |
| – Long to Short Ratio: | 1.4 to 1 | 0.8 to 1 | 1.3 to 1 |
| NET POSITION TREND: | | | |
| – Strength Index Score (3 Year Range Pct): | 41.7 | 59.9 | 23.1 |
| – Strength Index Reading (3 Year Range): | Bearish | Bullish | Bearish |
| NET POSITION MOVEMENT INDEX: | | | |
| – 6-Week Change in Strength Index: | 7.3 | -5.9 | -14.2 |
WHEAT Futures:
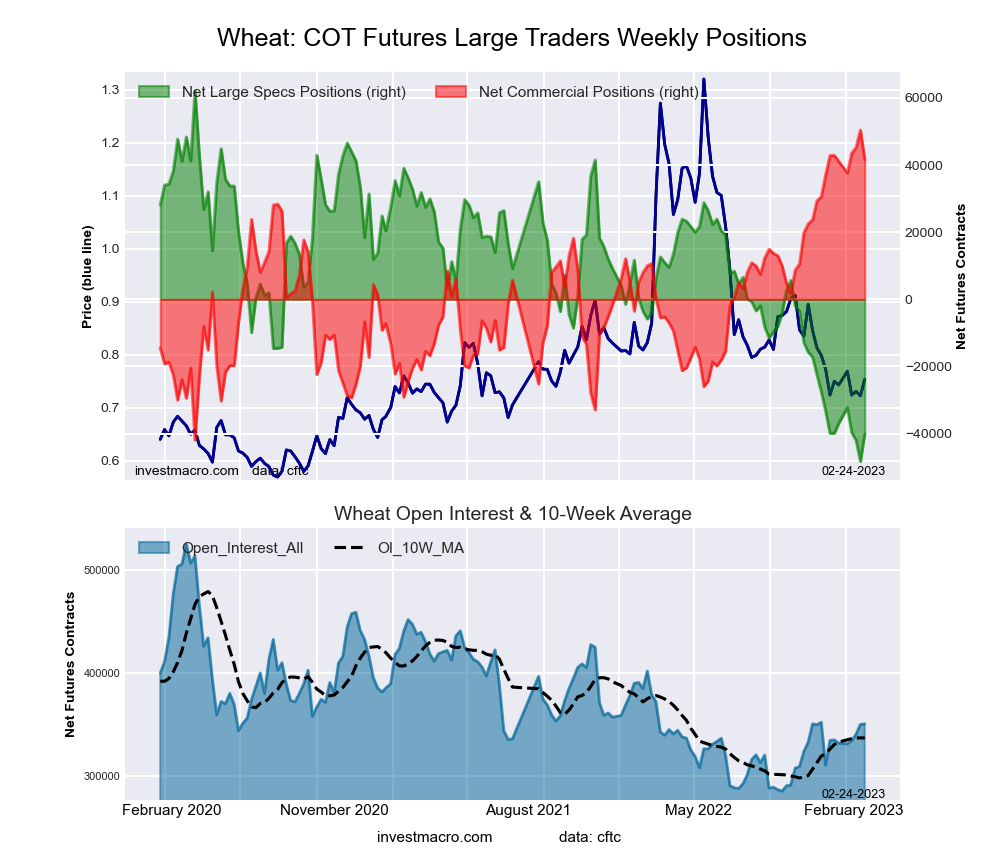 The WHEAT large speculator standing for the week was a net position of -40,060 contracts in the data reported. This was a weekly lift of 8,260 contracts from the previous week which had a total of -48,320 net contracts.
This week’s current strength score (the trader positioning range over the past three years, measured from 0 to 100) shows the speculators are currently Bearish-Extreme with a score of 7.5 percent. The commercials are Bullish-Extreme with a score of 90.4 percent and the small traders (not shown in chart) are Bullish-Extreme with a score of 100.0 percent.
| WHEAT Futures Statistics | SPECULATORS | COMMERCIALS | SMALL TRADERS |
| – Percent of Open Interest Longs: | 25.6 | 38.3 | 10.2 |
| – Percent of Open Interest Shorts: | 37.1 | 26.4 | 10.7 |
| – Net Position: | -40,060 | 41,564 | -1,504 |
| – Gross Longs: | 89,996 | 134,236 | 35,913 |
| – Gross Shorts: | 130,056 | 92,672 | 37,417 |
| – Long to Short Ratio: | 0.7 to 1 | 1.4 to 1 | 1.0 to 1 |
| NET POSITION TREND: | | | |
| – Strength Index Score (3 Year Range Pct): | 7.5 | 90.4 | 100.0 |
| – Strength Index Reading (3 Year Range): | Bearish-Extreme | Bullish-Extreme | Bullish-Extreme |
| NET POSITION MOVEMENT INDEX: | | | |
| – 6-Week Change in Strength Index: | -2.8 | 0.5 | 13.2 |
Article By InvestMacro – Receive our weekly COT Newsletter
*COT Report: The COT data, released weekly to the public each Friday, is updated through the most recent Tuesday (data is 3 days old) and shows a quick view of how large speculators or non-commercials (for-profit traders) were positioned in the futures markets.
The CFTC categorizes trader positions according to commercial hedgers (traders who use futures contracts for hedging as part of the business), non-commercials (large traders who speculate to realize trading profits) and nonreportable traders (usually small traders/speculators) as well as their open interest (contracts open in the market at time of reporting). See CFTC criteria here.


