Source: Ron Struthers (2/21/23)
Future markets have been compromised in the past four weeks by hackers blocking the Commitment of Traders reports. There has been unusual trading in the energy markets and there is no way we know who is buying or selling. Gold sold off in this same time frame and has made a technical bottom. Can it be trusted? Ron Struthers of Struthers Stock Report tells you his opinion.
I believe the oil and gas markets along with the Ukraine war are at very pivotal points and they are both closely tied together. Energy is very critical as fuel for a war machine and as well oil and gas have been highly weaponized and politicized.
I commented that I expected the U.S. was behind the Nord Stream pipeline sabotage, but this should shock the world. Famed investigative journalist and Pulitzer prize winner Seymour Hersh, is older, when investigative journalism was the norm, but sadly no longer. Regardless, for decades he was a star reporter writing for The New York Times and New Yorker and on Wednesday published a new bombshell as his first Substack post, prompting a quick White House response.
He went into so much detail about how the sabotage was planned and carried out, you just can’t make this stuff up. What intrigued me a bit more, the highly skilled divers involved were from Panama City, Florida where I happen to be staying now.
This had to be done covertly and secretly because being carried out by a nation is an act of war, but the Americans are good at that. In a nutshell, they planted explosives during the BALTOPS 22 NATO exercise which is carried out each year in the Baltic sea. They used a trigger device that could be set off some time in the future that was inconspicuous. The trigger could be set off by dropping a beacon from a plane that sent out a signal to set the explosion off. It is fascinating how well this was planned out and I suggest you read Seymour Hersh’s February 8th piece here. Tyler at Zero Hedge did a great summary of the report as well.
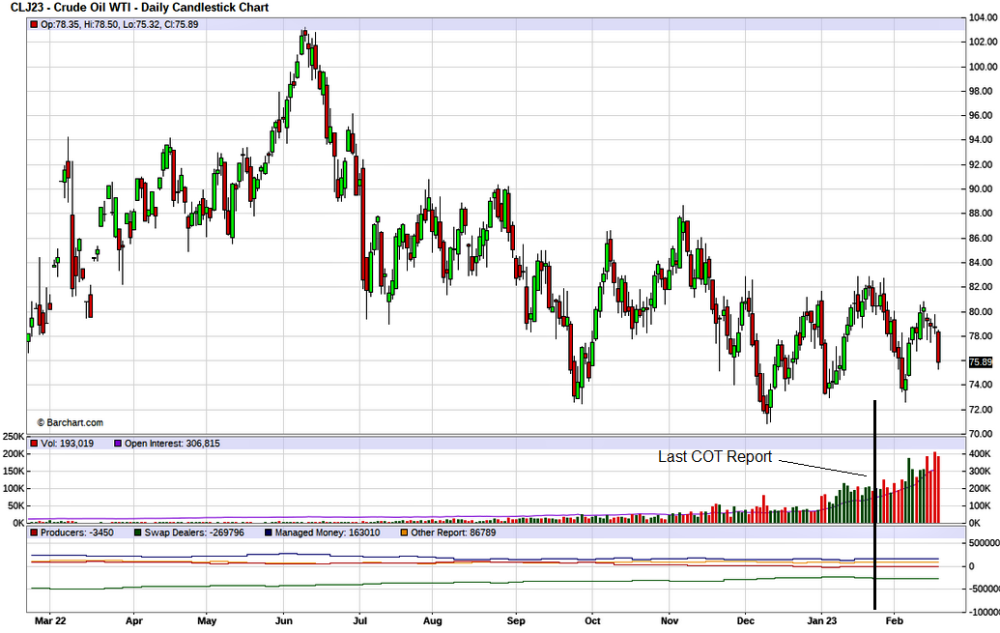
No doubt the reaction in energy markets from the Ukraine war and blowing up Nord Stream must have been well thought out with a plan to counter high prices. The Biden Administration released a huge amount of oil from the strategic petroleum reserves (SPR) to counter high prices and also an attempt to damage Russia’s strong energy revenues. If you have any doubt this is mainly about hurting Russia, just look at recent news. Russia announced they will cut oil exports by 500,000 barrels and a few days later Biden announced a 23 million barrel release from the SPR, which just happens to work out to about 400,000 barrels per day. Supposedly it was approved by congress years ago, but the timing is awfully suspicious.
It also stands to reason the Biden Administration would also manipulate the natural gas price down. We got lucky with a record-mild winter in North America and Europe. I don’t think governments can control the weather yet, they are not very good at predicting it other than continuous propaganda on climate change. However natural gas prices plunging to lows only seen at the onslaught of Covid-19 look way oversold and the volume of trading has been very high.
What is more bizarre we don’t have a clue who is doing the trading because the firm (Ion Markets) that produces the Commitment of Traders report was apparently hacked and is broken. The last update on COT was January 24th, it is supposed to be weekly. If you look at my chart you can see the weekly updates as trader positions are reported up or down, but it is a flat line since January 24th, the COT patient is dead. We are missing three weeks of reports and today will be four weeks.
I confirmed this with natural gas, oil, gold, and silver. I am sure it is with all commodities as the CFTC said.
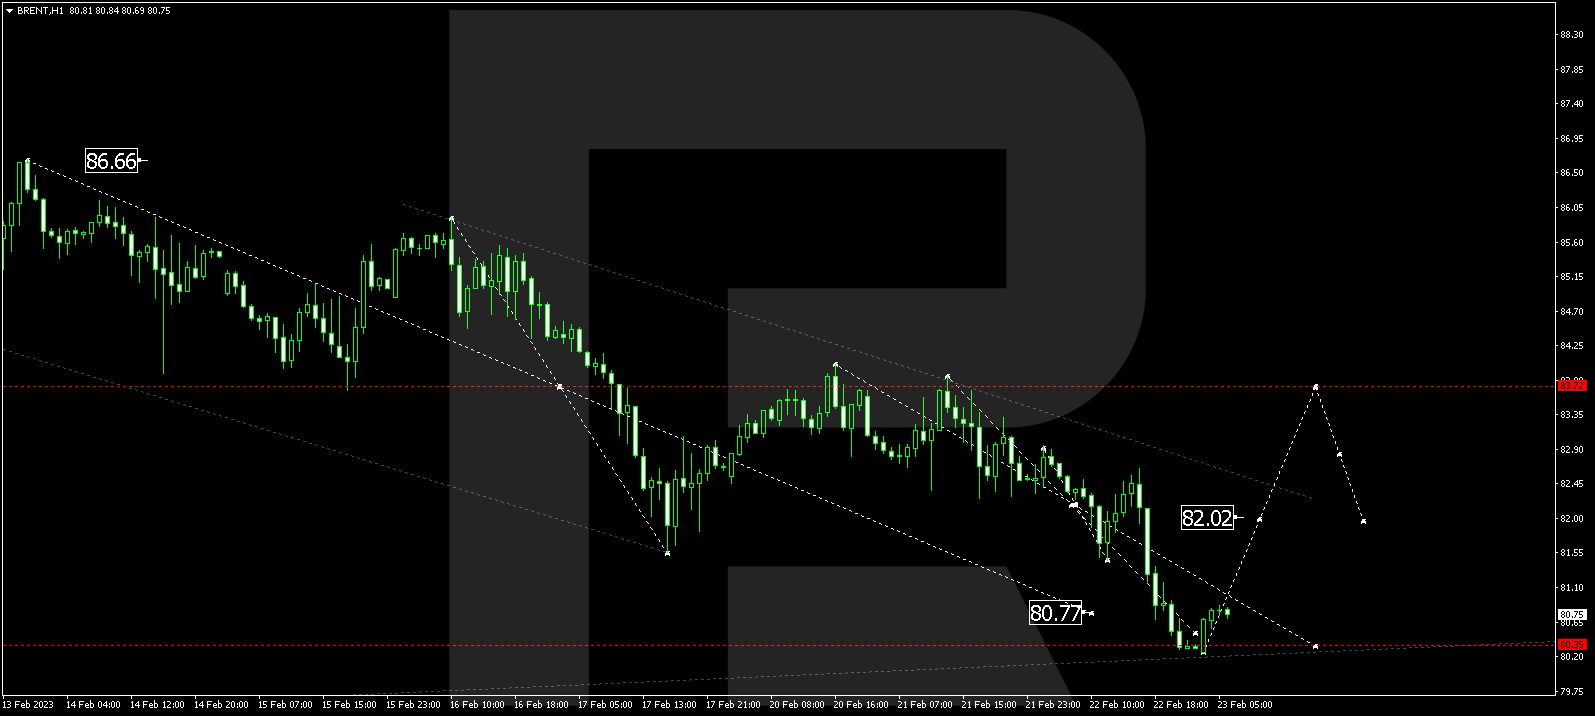
Oil and Gas
What is really suspicious is the strange trading activity with a high volume of natural gas and high open interest, high volume in oil. During this time frame is when gold and silver were whacked lower.
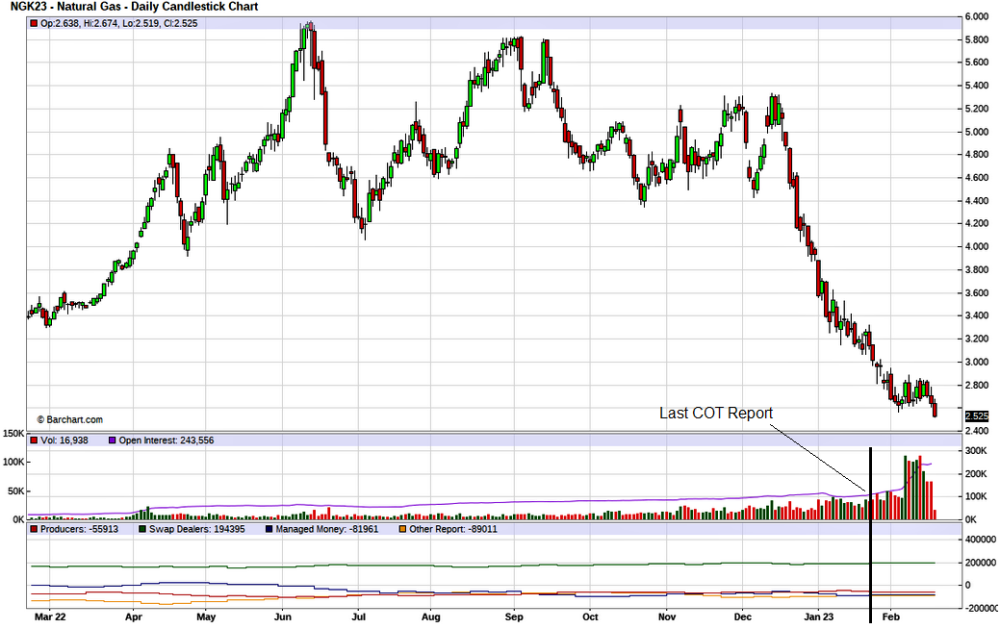
Natural Gas closed last Friday at US$2.50 and the last time it was lower than this was the onslaught of Covid-19 in 2020 when most everything got locked down. I can see no good reason for the market to be almost as bearish as it was at the start of the pandemic.
Biden said he will refill the SPR when oil prices drop below US$72, but I doubt that will ever happen even if prices dip that low. China is reopening, wars are escalating so demand is rising again, at a time when supply is being restrained with a push for green energy. I believe draining the SPR during a time when the risk of war escalation is rising is a bad idea.
The U.S. and NATO are depleting their war inventories supplying Ukraine, and I would bet China is just watching and waiting to time an invasion of Taiwan. While NATO is weakening, China continues to build its war machine. It will be extremely difficult for NATO to take on Russia and China at the same time. Basically, it would be WW3 and with that energy prices would soar.
The EIA forecast highlights a tight market. Global liquids fuel consumption in the forecast increases from an average of 99.4 million barrels per day (b/d) in 2022 to 102.3 million b/d in 2024, driven primarily by growth in China and other non-OECD countries. Global liquid fuels production averaged about 100.0 million b/d in 2022, and EIA forecasts it will increase by an average of 1.1 million b/d in 2023 and 1.5 million b/d in 2024.
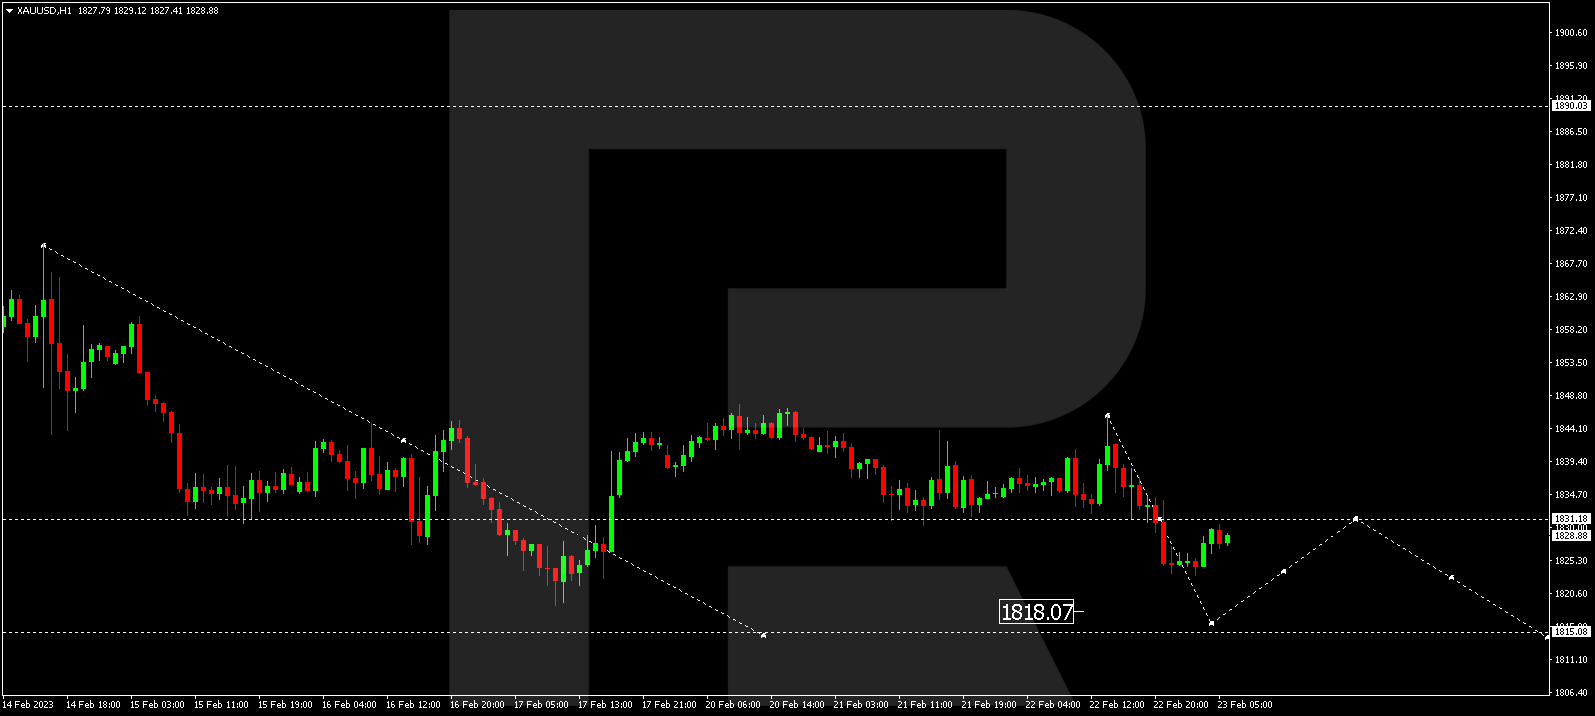
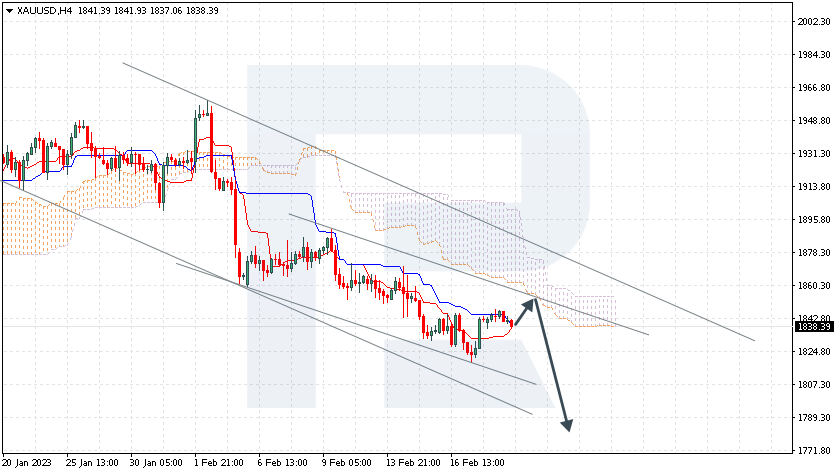
Gold
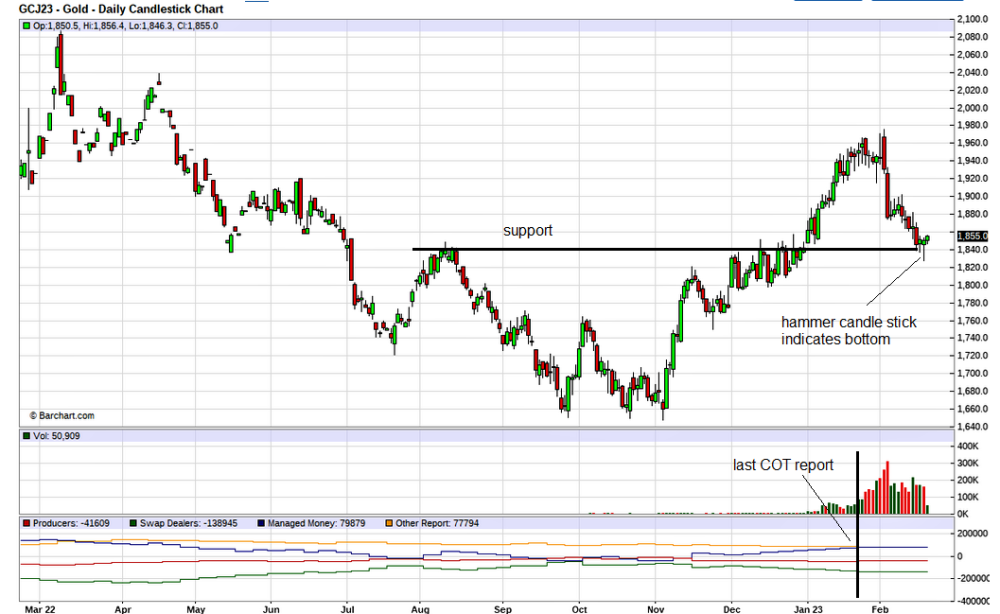
Gold markets are also affected by no COT reports. Prices declined in this period and we have no idea who is buying and selling. However, unlike oil and gas, the volume and open interest in Comex gold has been falling.
Gold dropped down to my expected support area and punched out a hammer bottom last Friday. Normally I would suggest this is a buying opportunity, but I don’t trust these markets that have been hacked, with no COT data along with abnormal volume and price action. I would bet that it ends up they can not retrieve the COT data and we just resume data from a new starting point. If so, this would look more suspicious.
Global physically backed gold ETFs kicked off 2023 with net outflows of US$1.6 billion in January and a 0.8% decline (26 tonnes) in total holdings to 3,446 tonnes, the World Gold Council (WGC) says in its latest monthly update. While the gold price witnessed its strongest January in a decade, registering a 6.1% gain, gold ETF outflows in Europe and Asia dwarfed positive demand in North America and other regions.
I have been harping that inflation has become entrenched and stronger numbers in last week’s January data are pointing that way. January Headline CPI (including energy prices) was 6.4% with the street expecting 6.2%. January Y/Y Core CPI was 5.6% and the street expected +5.5%. Housing contributed the most to the monthly increase.
I believe inflation will continue to ease because year over year will be compared to higher year-ago numbers in the months ahead. However, I doubt inflation will get under 5% and it might struggle to get under 6%.
Retail Sales
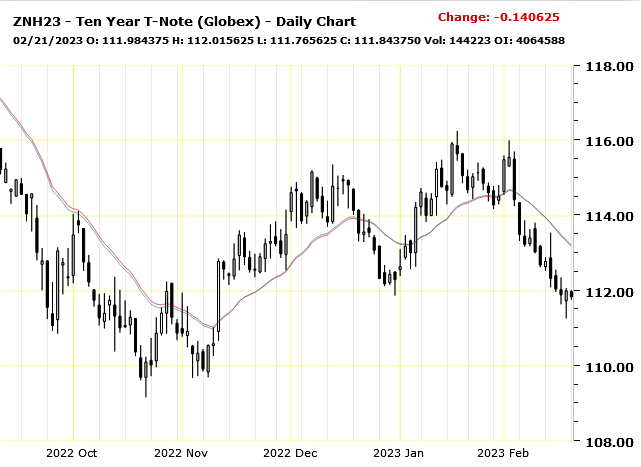
Retail sales came in strong last week at +3.0% vs the 1.9% estimate. With that and the inflation data, markets saw it as inflationary, and bonds sold off (rates rose). If you remember my comment that there was a huge short position on U.S. treasuries. At this point looks like those shorts are right. And remember on retail sales that those numbers are not adjusted for inflation of +6.4% so real retail sales declined -by 3.4%
Financial markets have upped their bets on additional rate hikes from the Bank of Canada and the U.S. Federal Reserve after blowout employment reports in both countries and higher-than-expected inflation data from the United States. Interest rate swaps, which capture market expectations about future rate decisions, have gone from pricing in two rate cuts by the Bank of Canada before the end of the year, to pricing in another rate hike in July and no rate cuts until 2024. That would bring the bank’s benchmark rate to 4.75%. In the U.S., markets now see the Fed increasing its benchmark interest rate to 5.25% by July, a quarter-point higher than expected two weeks ago.
The 10-year Treasury has declined a fair bit in February and looks to test the November 2022 lows.
Zonte Metals
I did a zoom interview with CEO Terry Christopher, you can watch it here on youtube.
We covered plans for drilling Cross Hills and all that has been learned that greatly improve the odds of making a discovery this year. Discussed the importance of Victoria Gold exploring up to Zonte Metals Inc.’s (ZON:TSX.V) border at McConnells Jest in the Yukon.
Zonte did have a surface sample there that ran around 100 grams gold and plans to go back there in 2023. Terry gave a synopsis of the Colombia court proceedings. Zonte won in the first two levels of court so it went to the third and final level.
Here B2Gold Corp. (BTG:NYSE; BTO:TSX; B2G:NSX)/AngloGold Ashanti Ltd. (AU:NYSE; ANG:JSE; AGG:ASX; AGD:LSE) presented numerous submissions to try and win the case, but Zonte defeated/defended them all so is batting 100% thus far.
Just before Covid-19, it was supposed to go to trial but everything got shut down.
Things are getting back to normal so I believe we could hear about a trial in 2023.
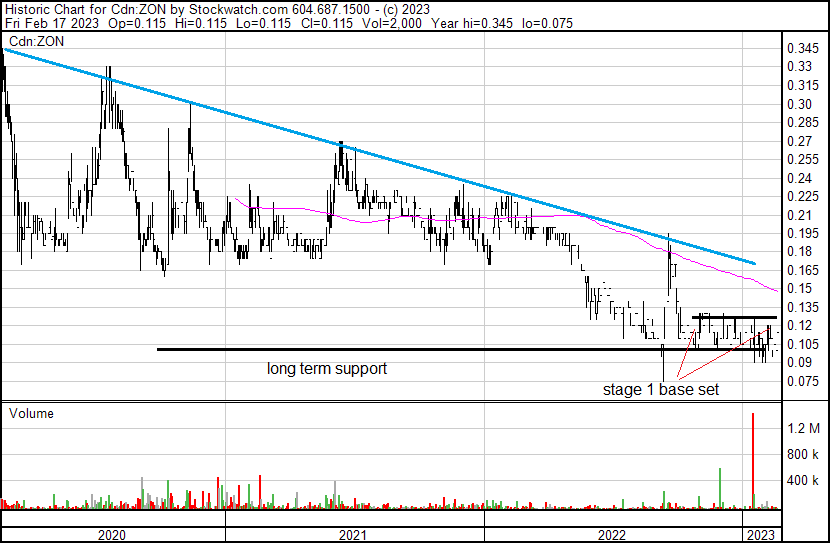
The technicals on the chart look very good with a long-term wedge pattern in play.
There is long-term support of around CA$0.10 going back about seven years.
A nice stage one base has been built between CA$0.09 and CA$0.125 over the last five months. I think the stock is ready to take off higher ahead of drilling. The key will be a break over the downtrend which is now around CA$0.15 to CA$0.16.
There is not much resistance around the CA$0.21 area, so that looks like a reasonable target at this time.
And for some humor, the one balloon that the U.S. shot down over Canada using two US$400k missiles was a US$12 to US$200 hobby balloon flown by the Northern Illinois Bottlecap Balloon Brigade. Yes, folks, that is correct, let a Chinese spy balloon fly across the U.S., but shoot down a hobby balloon right away. Talk about incompetence or just plain funny. Maybe we should buy defense stocks at this rate of missile consumption.
Struthers Stock Report Disclaimers:
All forecasts and recommendations are based on opinion. Markets change direction with consensus beliefs, which may change at any time and without notice. The author/publisher of this publication has taken every precaution to provide the most accurate information possible. The information & data were obtained from sources believed to be reliable, but because the information & data source are beyond the author’s control, no representation or guarantee is made that it is complete or accurate.
The reader accepts information on the condition that errors or omissions shall not be made the basis for any claim, demand or cause for action. Because of the ever-changing nature of information & statistics the author/publisher strongly encourages the reader to communicate directly with the company and/or with their personal investment adviser to obtain up to date information.
Past results are not necessarily indicative of future results. Any statements non-factual in nature constitute only current opinions, which are subject to change. The author/publisher may or may not have a position in the securities and/or options relating thereto, & may make purchases and/or sales of these securities relating thereto from time to time in the open market or otherwise. Neither the information, nor opinions expressed, shall be construed as a solicitation to buy or sell any stock, futures or options contract mentioned herein. The author/publisher of this letter is not a qualified financial adviser & is not acting as such in this publication.
Disclosures:
Charts provided by the author.
1) Ron Struthers: I, or members of my immediate household or family, own shares of the following companies mentioned in this article: Zonte Metals. I personally am, or members of my immediate household or family are, paid by the following companies mentioned in this article: None. My company currently has a financial relationship with the following companies mentioned in this article: Greenbriar Capital. I determined which companies would be included in this article based on my research and understanding of the sector.
2) The following companies mentioned in this article are billboard sponsors of Streetwise Reports: None. Click here for important disclosures about sponsor fees. The information provided above is for informational purposes only and is not a recommendation to buy or sell any security.
3) Statements and opinions expressed are the opinions of the author and not of Streetwise Reports or its officers. The author is wholly responsible for the validity of the statements. The author was not paid by Streetwise Reports for this article. Streetwise Reports was not paid by the author to publish or syndicate this article. Streetwise Reports requires contributing authors to disclose any shareholdings in, or economic relationships with, companies that they write about. Streetwise Reports relies upon the authors to accurately provide this information and Streetwise Reports has no means of verifying its accuracy.
4) This article does not constitute investment advice. Each reader is encouraged to consult with his or her individual financial professional and any action a reader takes as a result of information presented here is his or her own responsibility. By opening this page, each reader accepts and agrees to Streetwise Reports’ terms of use and full legal disclaimer. This article is not a solicitation for investment. Streetwise Reports does not render general or specific investment advice and the information on Streetwise Reports should not be considered a recommendation to buy or sell any security. Streetwise Reports does not endorse or recommend the business, products, services, or securities of any company mentioned on Streetwise Reports.
5) From time to time, Streetwise Reports LLC and its directors, officers, employees, or members of their families, as well as persons interviewed for articles and interviews on the site, may have a long or short position in the securities mentioned. Directors, officers, employees, or members of their immediate families are prohibited from making purchases and/or sales of those securities in the open market or otherwise from the time of the decision to publish an article until three business days after the publication of the article. The foregoing prohibition does not apply to articles that in substance only restate previously published company releases.