By InvestMacro | COT | Data Tables | COT Leaders | Downloads | COT Newsletter
Here are the latest charts and statistics for the Commitment of Traders (COT) data published by the Commodities Futures Trading Commission (CFTC).
The latest COT data is updated through Tuesday March 29th and shows a quick view of how large traders (for-profit speculators and commercial entities) were positioned in the futures markets.
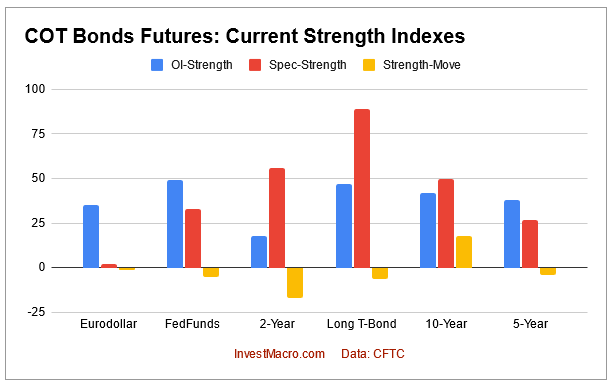
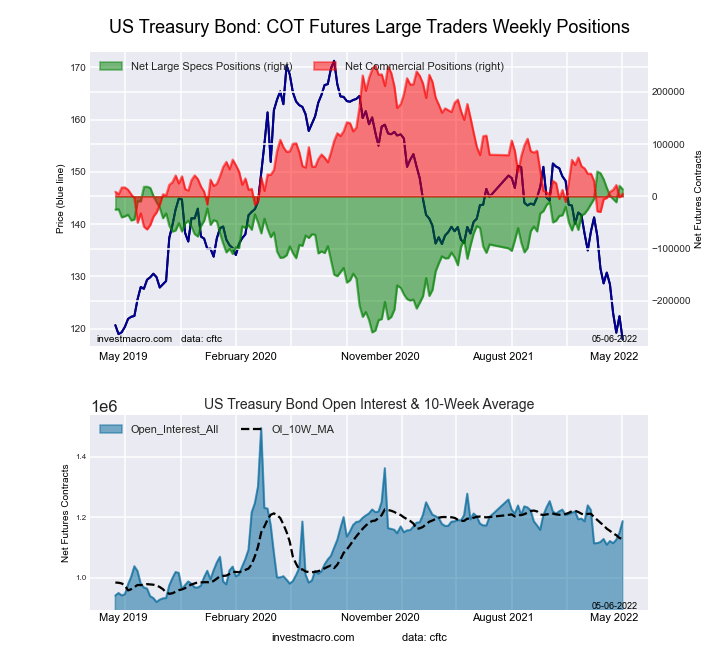
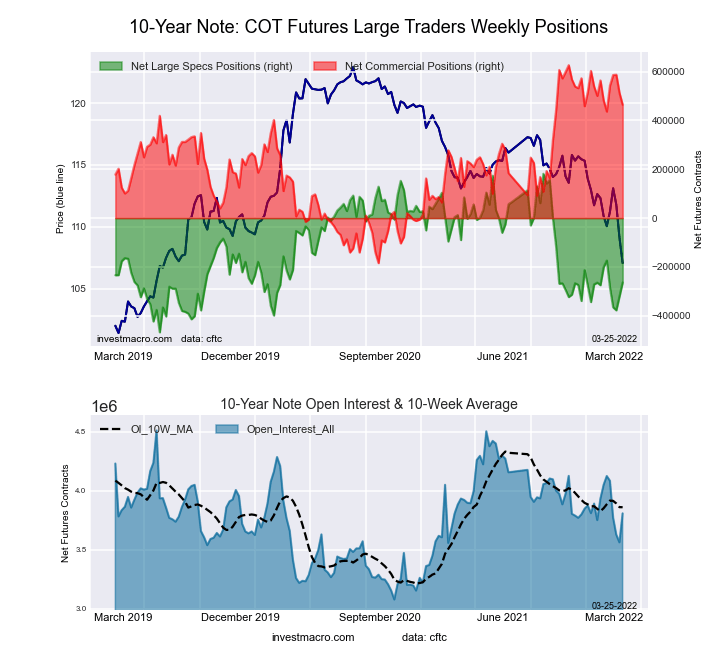
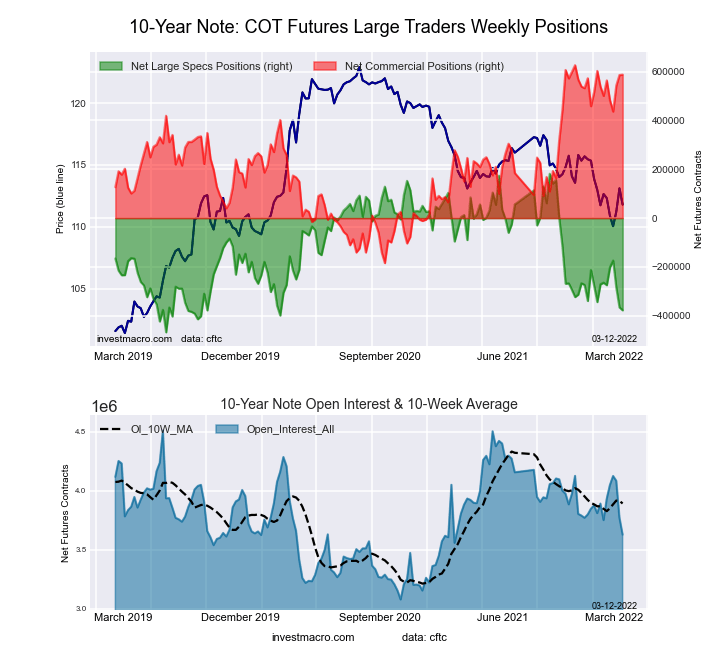
Highlighting the COT bonds data is the surge in the 10-Year Bond bets this week. The speculative position in the 10-Year Bond saw a sharp jump in bearish bets this week (by -212,723 contracts) that marked the largest one-week bearish gain in the past two hundred and seventy-eight weeks, dating all the way back to November 29th of 2016. The 10-Year had shed bearish bets in the previous two weeks but has now seen higher bearish bets in four out of the past six weeks. This rising bearish sentiment has pushed the current net speculator standing (total of -476,557 contracts) to the most bearish level in the past one-hundred and seventy-seven weeks, dating back to November 6th of 2018 when positions were over -500,000 contracts. The 10-Year Bond price has also been dropping sharply and the 10-Year Bond yield rose to the highest level since April of 2019 above the 2.50 percent level this week (interest rates rise as bond prices fall). The outlook for Central Bank interest rate increases likely signals that there is much more weakness ahead for bonds (and gains in bond yields) and speculator sentiment will likely become more bearish.
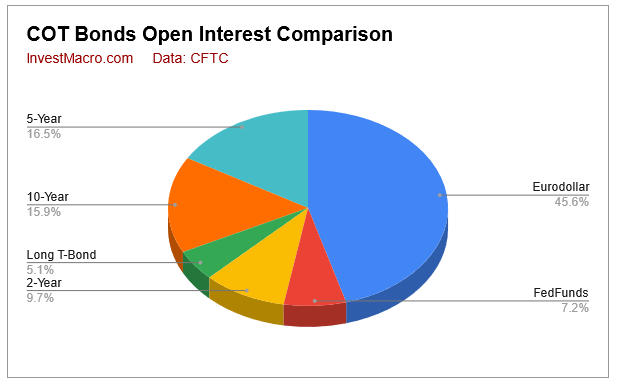
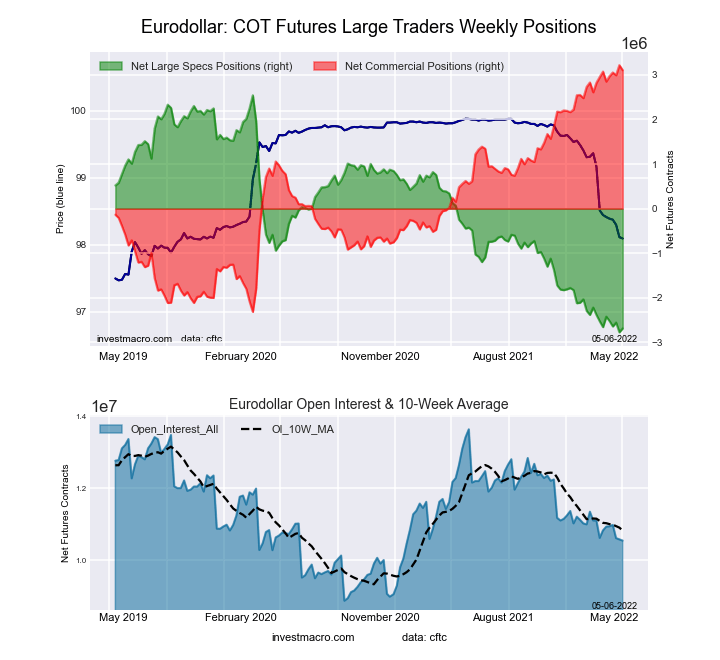
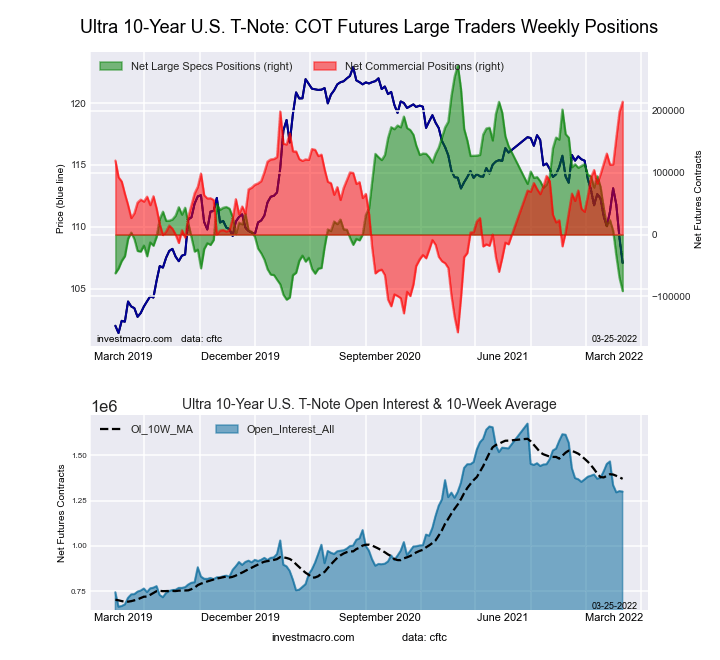
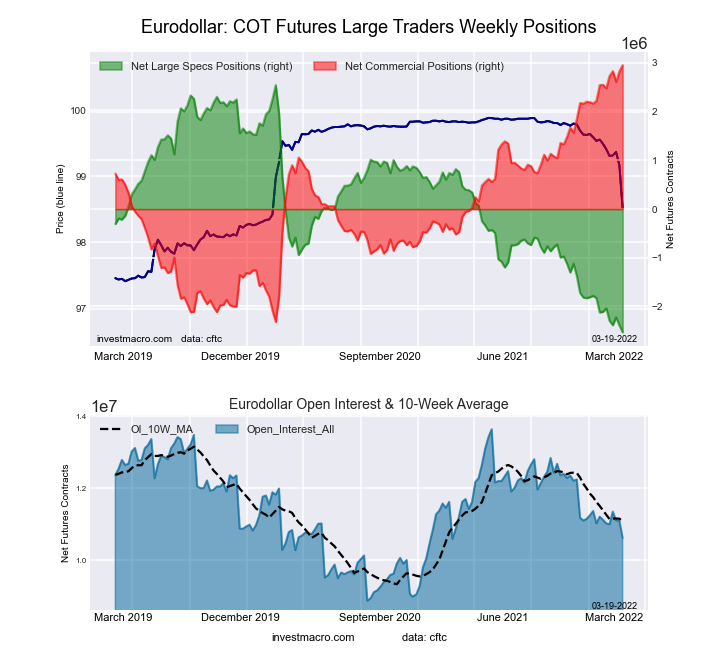
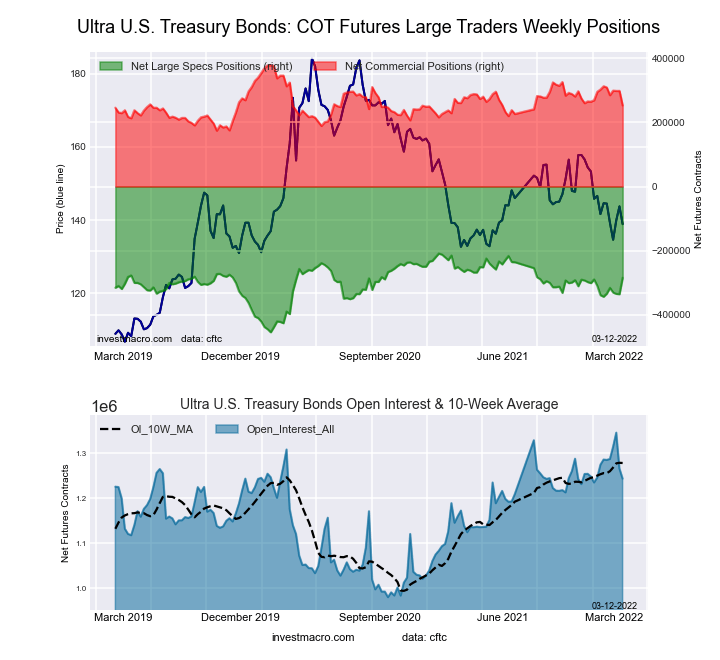
The bonds markets that saw higher speculator bets this week were Eurodollar (233,321 contracts) and the Ultra 10-Year (17,885 contracts).
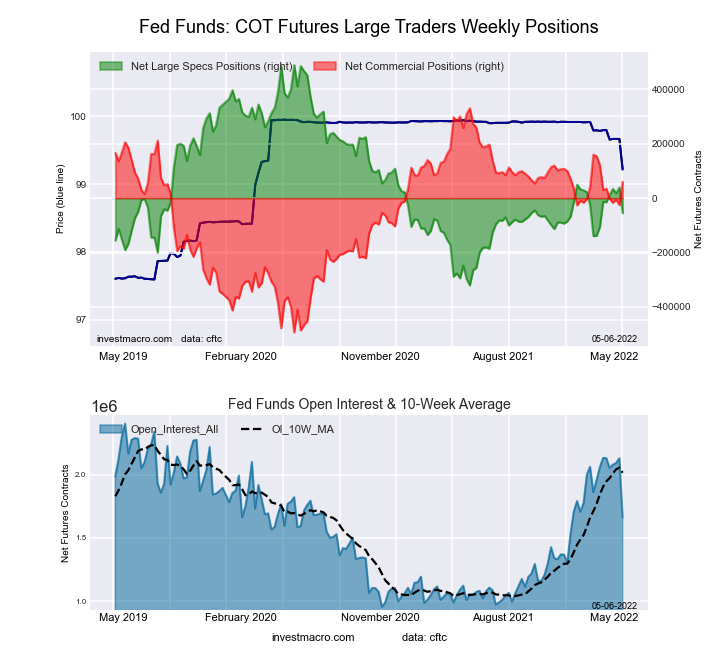
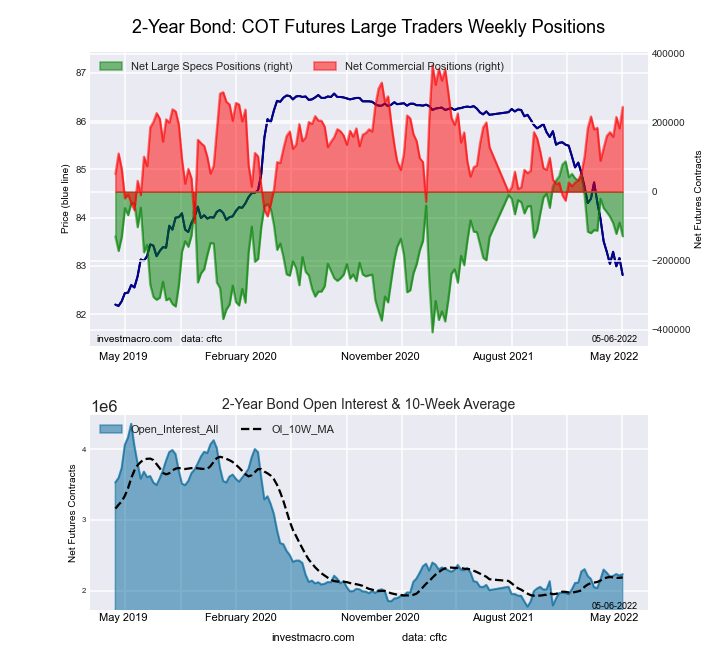
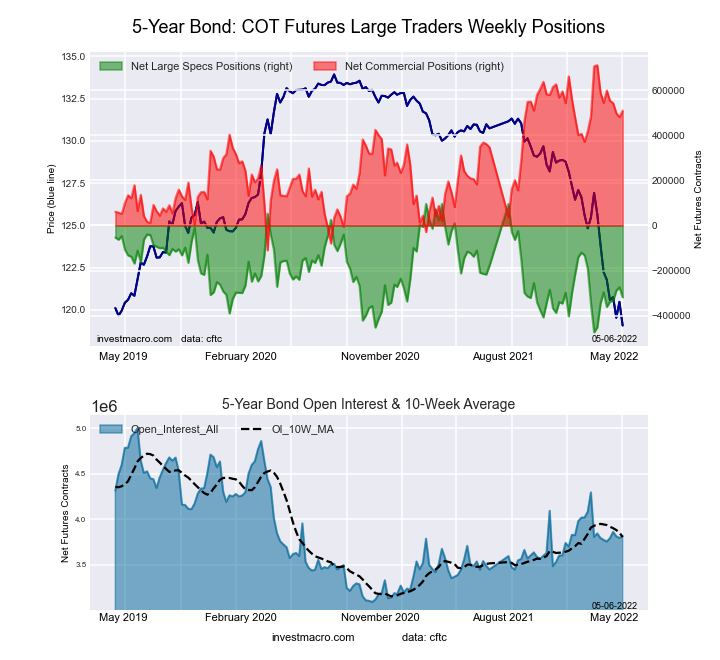
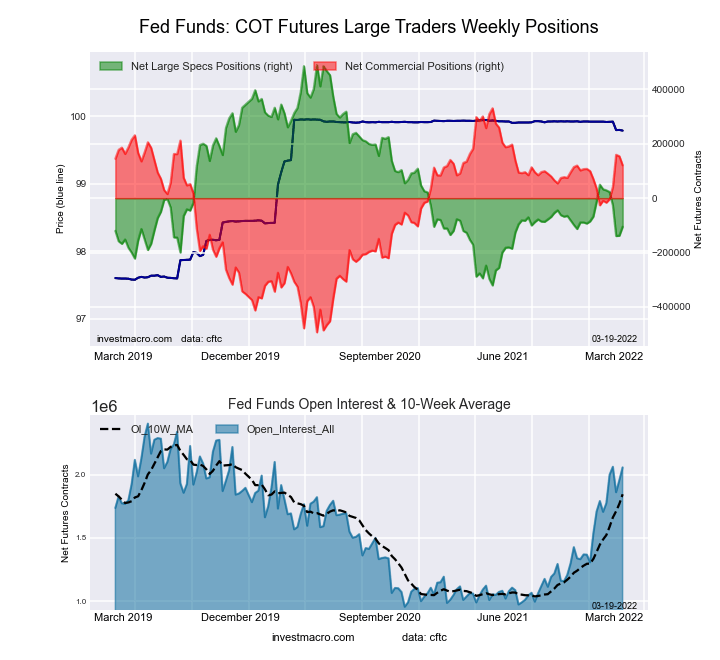
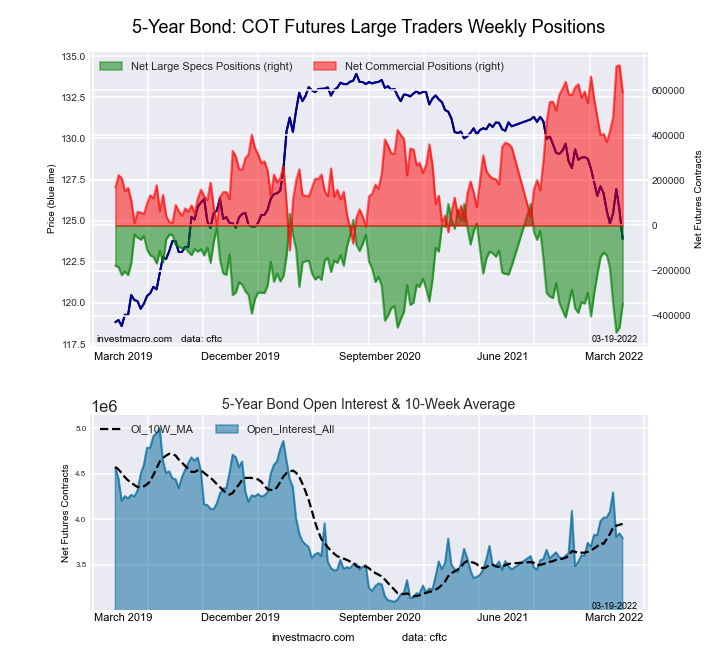
The bonds markets that saw lower speculator bets this week were 2-Year Bond (-11,754 contracts), 10-Year Bond (-212,723 contracts), Long US Bond (-16,550 contracts), Fed Funds (-1,024 contracts), 5-Year Bond (-65,052 contracts) and the Ultra US Bond (-25,035 contracts).
| Mar-29-2022 | OI | OI-Index | Spec-Net | Spec-Index | Com-Net | COM-Index | Smalls-Net | Smalls-Index |
|---|
| Eurodollar | 10,936,414 | 43 | -2,423,401 | 4 | 2,851,684 | 96 | -428,283 | 10 |
| FedFunds | 2,130,653 | 81 | -14,406 | 38 | 35,287 | 64 | -20,881 | 7 |
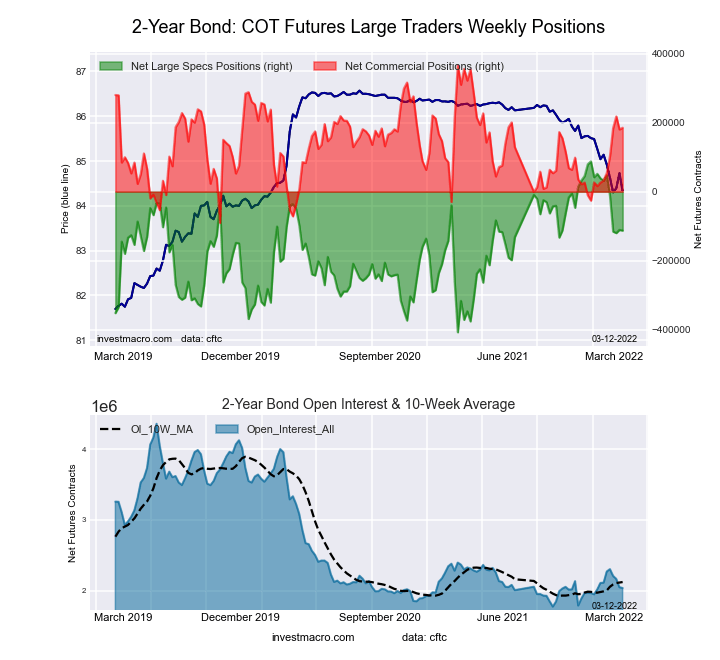
| 2-Year | 2,251,100 | 18 | -59,202 | 70 | 161,882 | 55 | -102,680 | 0 |
| Long T-Bond | 1,109,506 | 33 | 16,001 | 90 | -3,123 | 19 | -12,878 | 42 |
| 10-Year | 3,669,449 | 41 | -476,557 | 0 | 657,549 | 100 | -180,992 | 36 |
| 5-Year | 3,756,307 | 35 | -361,390 | 20 | 598,864 | 86 | -237,474 | 16 |
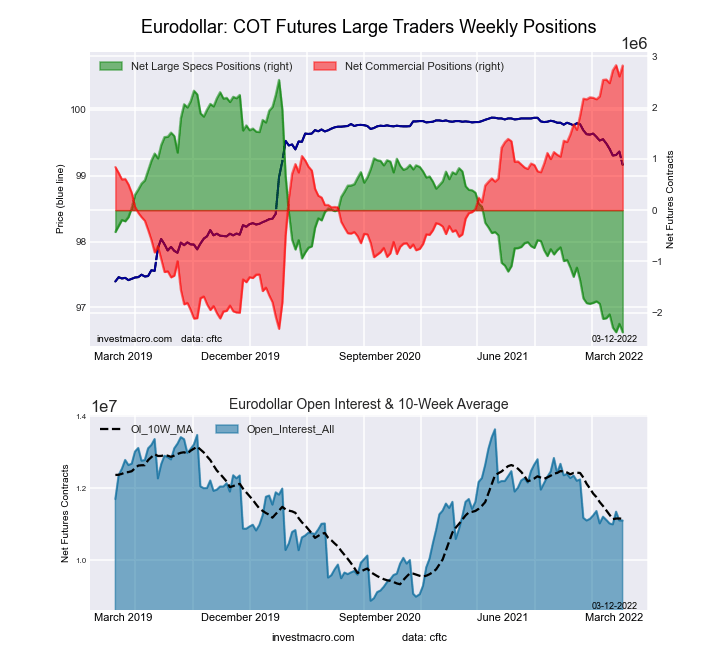
3-Month Eurodollars Futures:
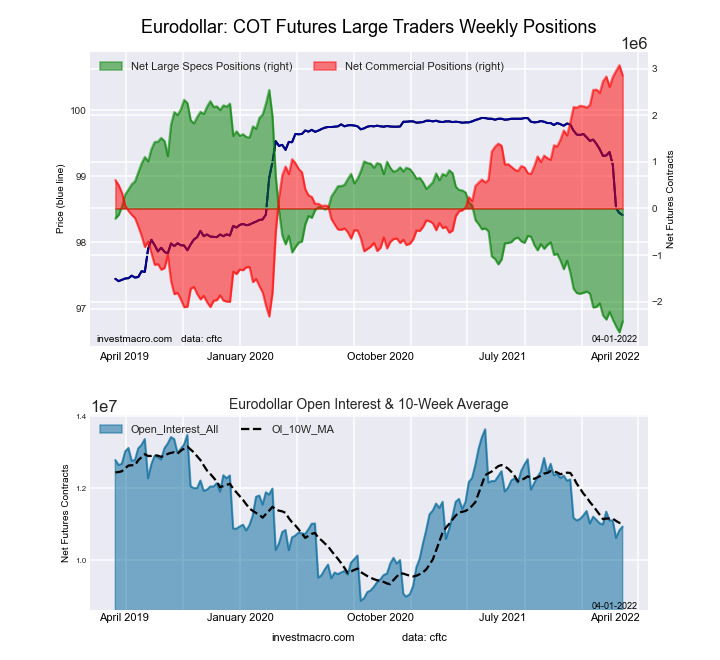 The 3-Month Eurodollars large speculator standing this week totaled a net position of -2,423,401 contracts in the data reported through Tuesday. This was a weekly increase of 233,321 contracts from the previous week which had a total of -2,656,722 net contracts.
This week’s current strength score (the trader positioning range over the past three years, measured from 0 to 100) shows the speculators are currently Bearish-Extreme with a score of 4.5 percent. The commercials are Bullish-Extreme with a score of 95.9 percent and the small traders (not shown in chart) are Bearish-Extreme with a score of 10.2 percent.
| 3-Month Eurodollars Statistics | SPECULATORS | COMMERCIALS | SMALL TRADERS |
| – Percent of Open Interest Longs: | 4.1 | 74.7 | 3.9 |
| – Percent of Open Interest Shorts: | 26.2 | 48.6 | 7.9 |
| – Net Position: | -2,423,401 | 2,851,684 | -428,283 |
| – Gross Longs: | 447,292 | 8,166,593 | 431,468 |
| – Gross Shorts: | 2,870,693 | 5,314,909 | 859,751 |
| – Long to Short Ratio: | 0.2 to 1 | 1.5 to 1 | 0.5 to 1 |
| NET POSITION TREND: | | | |
| – Strength Index Score (3 Year Range Pct): | 4.5 | 95.9 | 10.2 |
| – Strength Index Reading (3 Year Range): | Bearish-Extreme | Bullish-Extreme | Bearish-Extreme |
| NET POSITION MOVEMENT INDEX: | | | |
| – 6-Week Change in Strength Index: | -2.5 | 2.2 | 2.2 |
30-Day Federal Funds Futures:
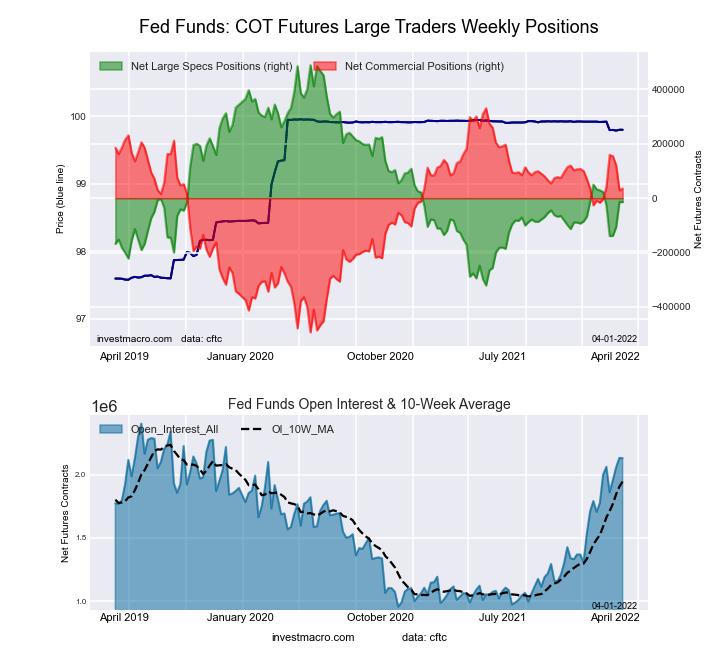 The 30-Day Federal Funds large speculator standing this week totaled a net position of -14,406 contracts in the data reported through Tuesday. This was a weekly decline of -1,024 contracts from the previous week which had a total of -13,382 net contracts.
This week’s current strength score (the trader positioning range over the past three years, measured from 0 to 100) shows the speculators are currently Bearish with a score of 37.8 percent. The commercials are Bullish with a score of 64.2 percent and the small traders (not shown in chart) are Bearish-Extreme with a score of 6.6 percent.
| 30-Day Federal Funds Statistics | SPECULATORS | COMMERCIALS | SMALL TRADERS |
| – Percent of Open Interest Longs: | 8.1 | 77.1 | 1.3 |
| – Percent of Open Interest Shorts: | 8.8 | 75.4 | 2.3 |
| – Net Position: | -14,406 | 35,287 | -20,881 |
| – Gross Longs: | 172,450 | 1,642,231 | 27,817 |
| – Gross Shorts: | 186,856 | 1,606,944 | 48,698 |
| – Long to Short Ratio: | 0.9 to 1 | 1.0 to 1 | 0.6 to 1 |
| NET POSITION TREND: | | | |
| – Strength Index Score (3 Year Range Pct): | 37.8 | 64.2 | 6.6 |
| – Strength Index Reading (3 Year Range): | Bearish | Bullish | Bearish-Extreme |
| NET POSITION MOVEMENT INDEX: | | | |
| – 6-Week Change in Strength Index: | -4.6 | 4.7 | -4.0 |
2-Year Treasury Note Futures:
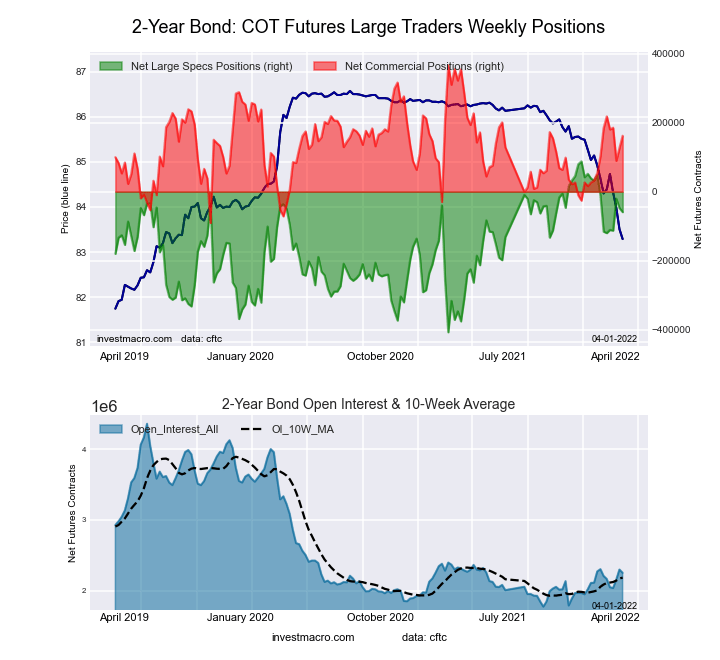 The 2-Year Treasury Note large speculator standing this week totaled a net position of -59,202 contracts in the data reported through Tuesday. This was a weekly reduction of -11,754 contracts from the previous week which had a total of -47,448 net contracts.
This week’s current strength score (the trader positioning range over the past three years, measured from 0 to 100) shows the speculators are currently Bullish with a score of 70.3 percent. The commercials are Bullish with a score of 55.2 percent and the small traders (not shown in chart) are Bearish-Extreme with a score of 0.0 percent.
| 2-Year Treasury Note Statistics | SPECULATORS | COMMERCIALS | SMALL TRADERS |
| – Percent of Open Interest Longs: | 14.0 | 76.4 | 6.2 |
| – Percent of Open Interest Shorts: | 16.6 | 69.2 | 10.8 |
| – Net Position: | -59,202 | 161,882 | -102,680 |
| – Gross Longs: | 314,664 | 1,719,719 | 140,420 |
| – Gross Shorts: | 373,866 | 1,557,837 | 243,100 |
| – Long to Short Ratio: | 0.8 to 1 | 1.1 to 1 | 0.6 to 1 |
| NET POSITION TREND: | | | |
| – Strength Index Score (3 Year Range Pct): | 70.3 | 55.2 | 0.0 |
| – Strength Index Reading (3 Year Range): | Bullish | Bullish | Bearish-Extreme |
| NET POSITION MOVEMENT INDEX: | | | |
| – 6-Week Change in Strength Index: | 11.4 | -4.9 | -15.1 |
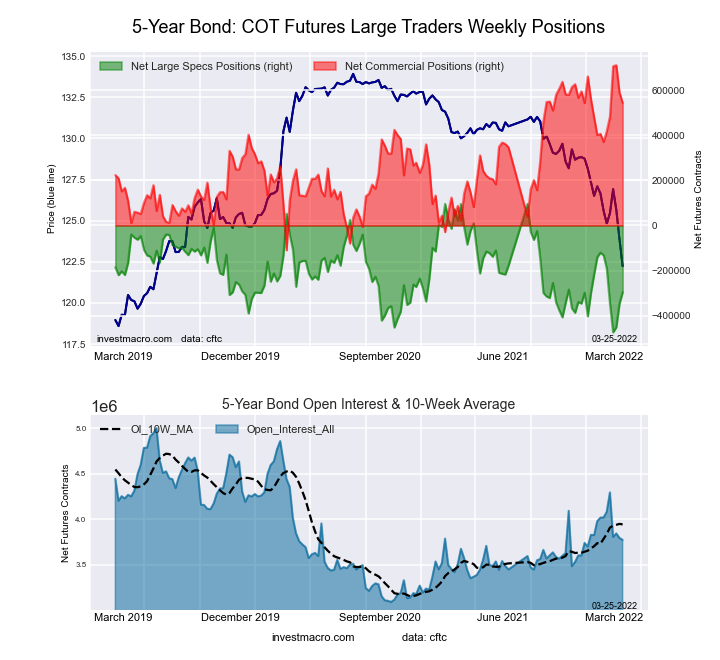
5-Year Treasury Note Futures:
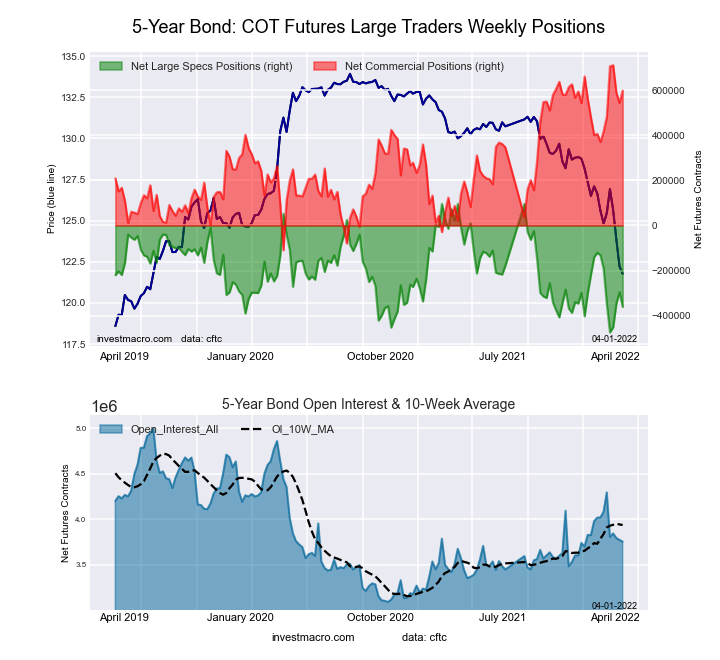 The 5-Year Treasury Note large speculator standing this week totaled a net position of -361,390 contracts in the data reported through Tuesday. This was a weekly fall of -65,052 contracts from the previous week which had a total of -296,338 net contracts.
This week’s current strength score (the trader positioning range over the past three years, measured from 0 to 100) shows the speculators are currently Bearish-Extreme with a score of 19.8 percent. The commercials are Bullish-Extreme with a score of 86.3 percent and the small traders (not shown in chart) are Bearish-Extreme with a score of 15.8 percent.
| 5-Year Treasury Note Statistics | SPECULATORS | COMMERCIALS | SMALL TRADERS |
| – Percent of Open Interest Longs: | 8.2 | 82.6 | 7.2 |
| – Percent of Open Interest Shorts: | 17.9 | 66.6 | 13.5 |
| – Net Position: | -361,390 | 598,864 | -237,474 |
| – Gross Longs: | 309,236 | 3,101,800 | 270,067 |
| – Gross Shorts: | 670,626 | 2,502,936 | 507,541 |
| – Long to Short Ratio: | 0.5 to 1 | 1.2 to 1 | 0.5 to 1 |
| NET POSITION TREND: | | | |
| – Strength Index Score (3 Year Range Pct): | 19.8 | 86.3 | 15.8 |
| – Strength Index Reading (3 Year Range): | Bearish-Extreme | Bullish-Extreme | Bearish-Extreme |
| NET POSITION MOVEMENT INDEX: | | | |
| – 6-Week Change in Strength Index: | -29.8 | 21.9 | -2.7 |
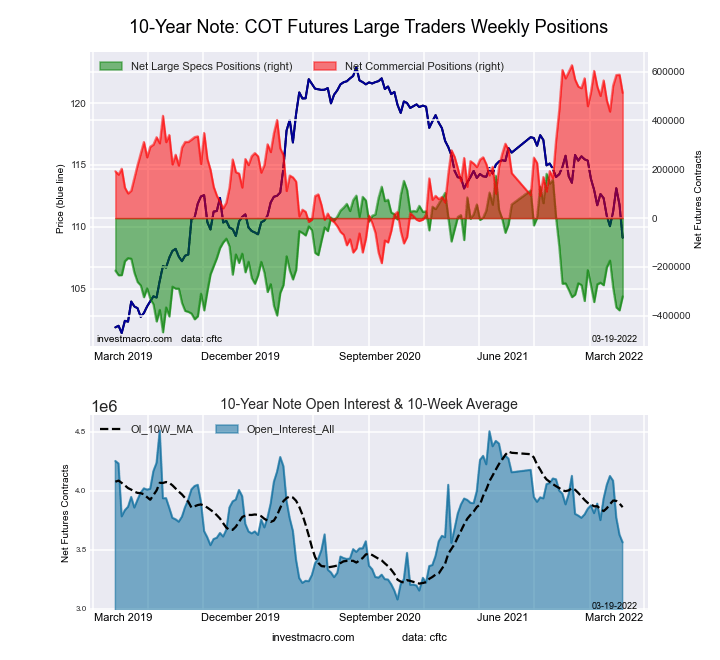
10-Year Treasury Note Futures:
 The 10-Year Treasury Note large speculator standing this week totaled a net position of -476,557 contracts in the data reported through Tuesday. This was a weekly decrease of -212,723 contracts from the previous week which had a total of -263,834 net contracts.
This week’s current strength score (the trader positioning range over the past three years, measured from 0 to 100) shows the speculators are currently Bearish-Extreme with a score of 0.0 percent. The commercials are Bullish-Extreme with a score of 100.0 percent and the small traders (not shown in chart) are Bearish with a score of 36.5 percent.
| 10-Year Treasury Note Statistics | SPECULATORS | COMMERCIALS | SMALL TRADERS |
| – Percent of Open Interest Longs: | 7.5 | 80.2 | 9.0 |
| – Percent of Open Interest Shorts: | 20.5 | 62.2 | 13.9 |
| – Net Position: | -476,557 | 657,549 | -180,992 |
| – Gross Longs: | 276,588 | 2,941,177 | 328,695 |
| – Gross Shorts: | 753,145 | 2,283,628 | 509,687 |
| – Long to Short Ratio: | 0.4 to 1 | 1.3 to 1 | 0.6 to 1 |
| NET POSITION TREND: | | | |
| – Strength Index Score (3 Year Range Pct): | 0.0 | 100.0 | 36.5 |
| – Strength Index Reading (3 Year Range): | Bearish-Extreme | Bullish-Extreme | Bearish |
| NET POSITION MOVEMENT INDEX: | | | |
| – 6-Week Change in Strength Index: | -46.0 | 26.3 | 18.9 |
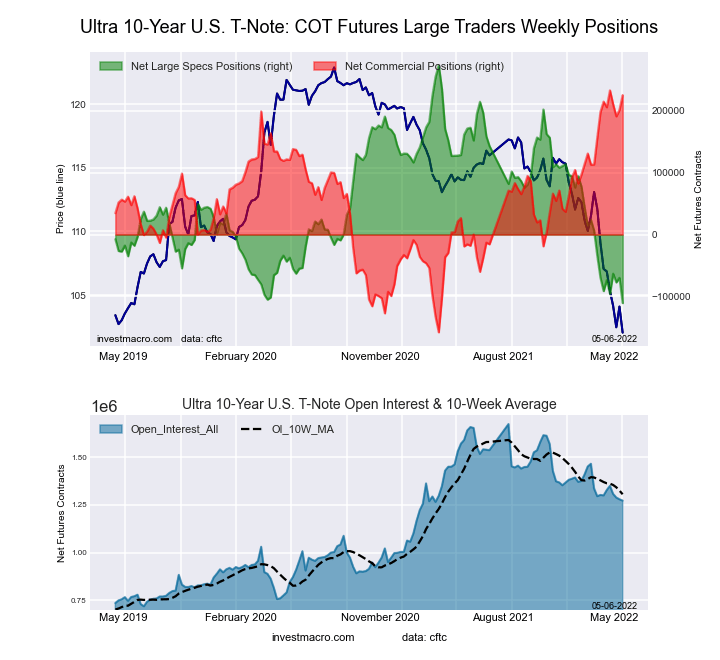
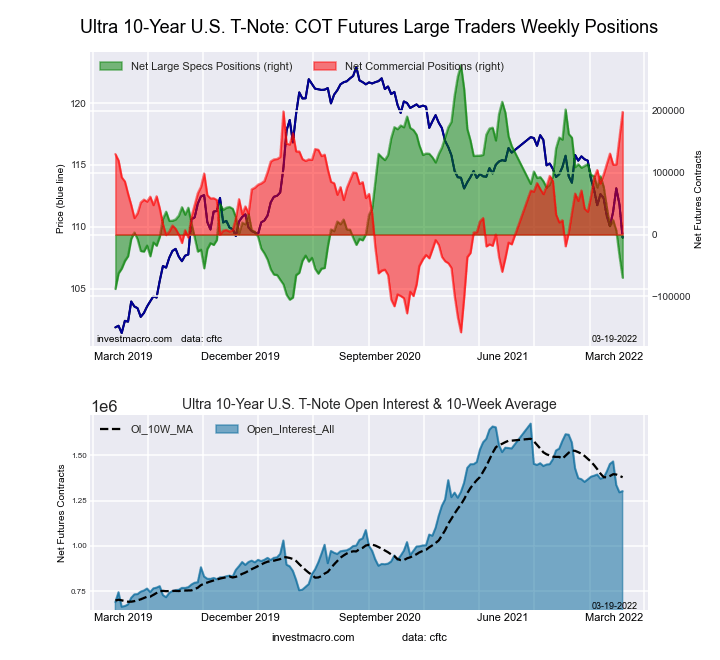
Ultra 10-Year Notes Futures:
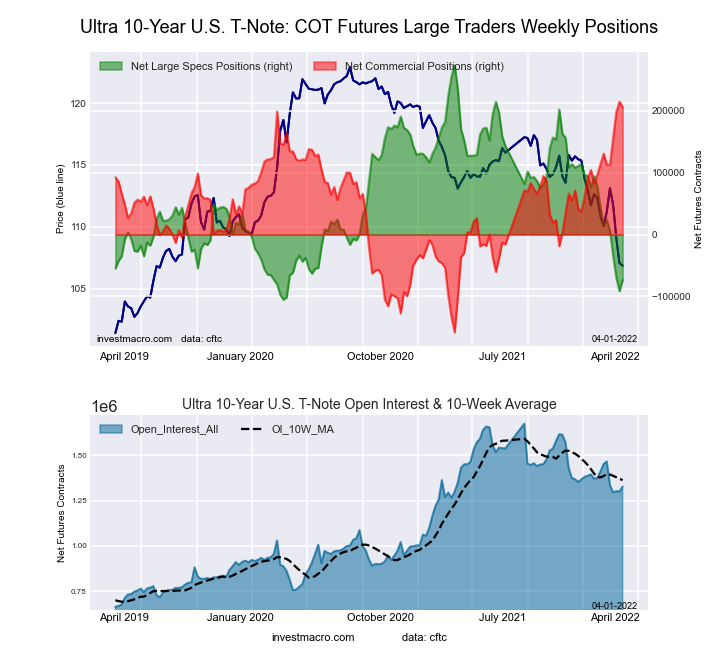 The Ultra 10-Year Notes large speculator standing this week totaled a net position of -73,436 contracts in the data reported through Tuesday. This was a weekly boost of 17,885 contracts from the previous week which had a total of -91,321 net contracts.
This week’s current strength score (the trader positioning range over the past three years, measured from 0 to 100) shows the speculators are currently Bearish-Extreme with a score of 8.4 percent. The commercials are Bullish-Extreme with a score of 97.6 percent and the small traders (not shown in chart) are Bearish with a score of 35.8 percent.
| Ultra 10-Year Notes Statistics | SPECULATORS | COMMERCIALS | SMALL TRADERS |
| – Percent of Open Interest Longs: | 9.7 | 80.7 | 9.0 |
| – Percent of Open Interest Shorts: | 15.2 | 65.2 | 18.9 |
| – Net Position: | -73,436 | 205,679 | -132,243 |
| – Gross Longs: | 128,735 | 1,071,757 | 119,198 |
| – Gross Shorts: | 202,171 | 866,078 | 251,441 |
| – Long to Short Ratio: | 0.6 to 1 | 1.2 to 1 | 0.5 to 1 |
| NET POSITION TREND: | | | |
| – Strength Index Score (3 Year Range Pct): | 8.4 | 97.6 | 35.8 |
| – Strength Index Reading (3 Year Range): | Bearish-Extreme | Bullish-Extreme | Bearish |
| NET POSITION MOVEMENT INDEX: | | | |
| – 6-Week Change in Strength Index: | -23.1 | 20.1 | 7.5 |
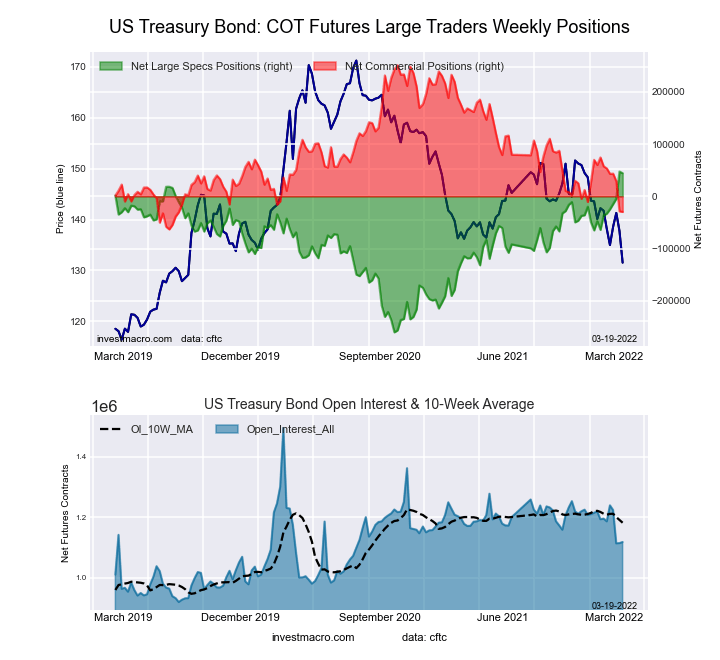
US Treasury Bonds Futures:
 The US Treasury Bonds large speculator standing this week totaled a net position of 16,001 contracts in the data reported through Tuesday. This was a weekly lowering of -16,550 contracts from the previous week which had a total of 32,551 net contracts.
This week’s current strength score (the trader positioning range over the past three years, measured from 0 to 100) shows the speculators are currently Bullish-Extreme with a score of 89.8 percent. The commercials are Bearish-Extreme with a score of 19.1 percent and the small traders (not shown in chart) are Bearish with a score of 42.4 percent.
| US Treasury Bonds Statistics | SPECULATORS | COMMERCIALS | SMALL TRADERS |
| – Percent of Open Interest Longs: | 9.1 | 73.1 | 14.6 |
| – Percent of Open Interest Shorts: | 7.7 | 73.4 | 15.7 |
| – Net Position: | 16,001 | -3,123 | -12,878 |
| – Gross Longs: | 100,986 | 810,834 | 161,498 |
| – Gross Shorts: | 84,985 | 813,957 | 174,376 |
| – Long to Short Ratio: | 1.2 to 1 | 1.0 to 1 | 0.9 to 1 |
| NET POSITION TREND: | | | |
| – Strength Index Score (3 Year Range Pct): | 89.8 | 19.1 | 42.4 |
| – Strength Index Reading (3 Year Range): | Bullish-Extreme | Bearish-Extreme | Bearish |
| NET POSITION MOVEMENT INDEX: | | | |
| – 6-Week Change in Strength Index: | 13.3 | -14.7 | 4.1 |
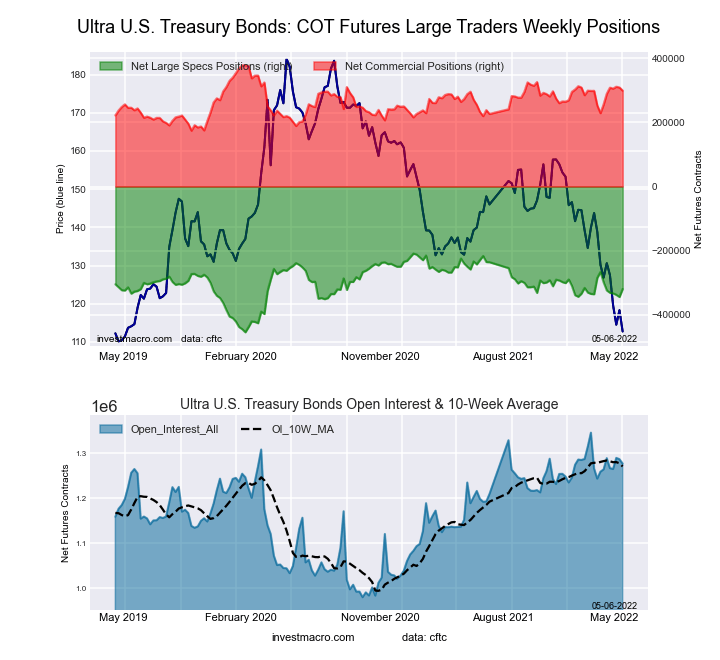
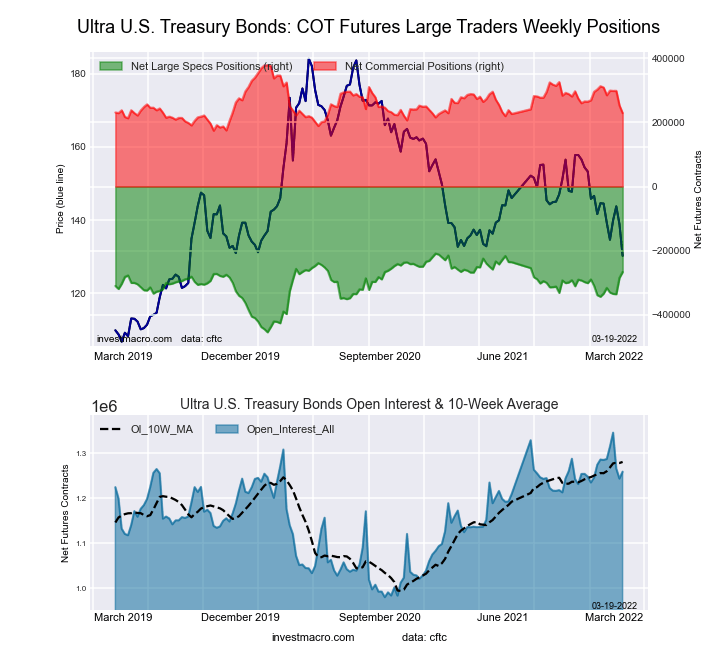
Ultra US Treasury Bonds Futures:
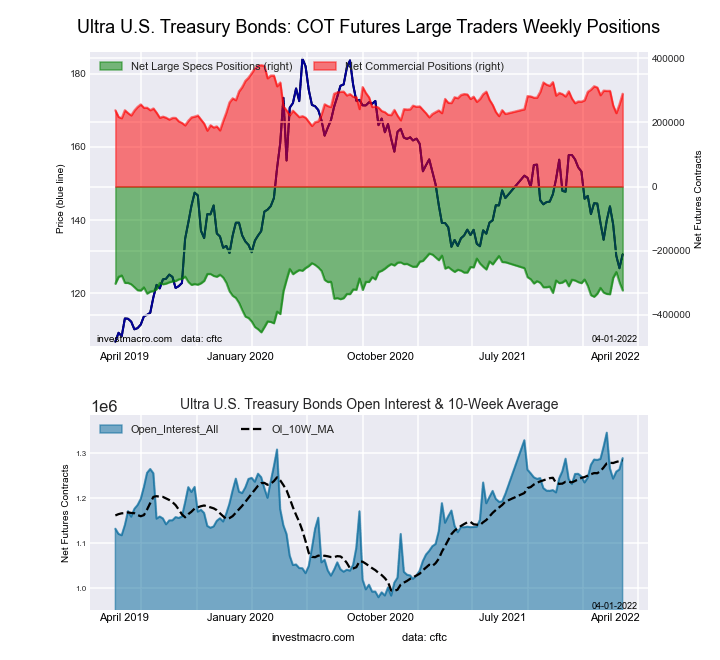 The Ultra US Treasury Bonds large speculator standing this week totaled a net position of -323,558 contracts in the data reported through Tuesday. This was a weekly decline of -25,035 contracts from the previous week which had a total of -298,523 net contracts.
This week’s current strength score (the trader positioning range over the past three years, measured from 0 to 100) shows the speculators are currently Bullish with a score of 53.2 percent. The commercials are Bullish with a score of 56.4 percent and the small traders (not shown in chart) are Bullish with a score of 53.1 percent.
| Ultra US Treasury Bonds Statistics | SPECULATORS | COMMERCIALS | SMALL TRADERS |
| – Percent of Open Interest Longs: | 5.3 | 82.2 | 11.9 |
| – Percent of Open Interest Shorts: | 30.4 | 59.8 | 9.2 |
| – Net Position: | -323,558 | 288,970 | 34,588 |
| – Gross Longs: | 68,282 | 1,059,413 | 152,895 |
| – Gross Shorts: | 391,840 | 770,443 | 118,307 |
| – Long to Short Ratio: | 0.2 to 1 | 1.4 to 1 | 1.3 to 1 |
| NET POSITION TREND: | | | |
| – Strength Index Score (3 Year Range Pct): | 53.2 | 56.4 | 53.1 |
| – Strength Index Reading (3 Year Range): | Bullish | Bullish | Bullish |
| NET POSITION MOVEMENT INDEX: | | | |
| – 6-Week Change in Strength Index: | 2.7 | -4.7 | 2.2 |
Article By InvestMacro – Receive our weekly COT Reports by Email
*COT Report: The COT data, released weekly to the public each Friday, is updated through the most recent Tuesday (data is 3 days old) and shows a quick view of how large speculators or non-commercials (for-profit traders) were positioned in the futures markets.
The CFTC categorizes trader positions according to commercial hedgers (traders who use futures contracts for hedging as part of the business), non-commercials (large traders who speculate to realize trading profits) and nonreportable traders (usually small traders/speculators) as well as their open interest (contracts open in the market at time of reporting).See CFTC criteria here.


