
By InvestMacro | COT | Data Tables | COT Leaders | Downloads | COT Newsletter
Here are the latest charts and statistics for the Commitment of Traders (COT) data published by the Commodities Futures Trading Commission (CFTC).
The latest COT data is updated through Tuesday March 15th and shows a quick view of how large traders (for-profit speculators and commercial entities) were positioned in the futures markets.
Highlighting the COT bonds data is the steady rise in the Eurodollar bearish bets. Eurodollar futures speculator bets fell for a second consecutive week and for the fourth time in the past five weeks. This has brought the current net position to the most bearish standing of the past one hundred and seventy weeks, dating back to December of 2018. The Eurodollar futures are the largest futures market as open interest in these contracts usually numbers over 10 million contracts (sometimes three times more than the second highest market) and are used to wager or hedge on short-term interest rates (3-month Libor). A declining Eurodollar futures contract shows a rise in (deposit) interest rates while a gaining Eurodollar futures contract shows the opposite. In times of financial upheaval or strong risk-off situations such as the Great Financial Crisis or the recent Covid Crisis, Eurodollar futures have seen strong trends higher and in times of normalization and rising interest rates, Eurodollar futures typically trend downward. The current path to normal interest rates (off the near-zero floor for the Fed Funds) is happening at the moment and the Eurodollar speculator positions are reflecting that with their multi-year lows.
The bond markets with higher speculator bets this week were the 2-Year Bond (92,313 contracts), 10-Year Bond (56,723 contracts), Fed Funds (32,857 contracts), 5-Year (104,839 contracts) and the Ultra US Bond (18,174 contracts).
The bond markets with lower speculator bets this week were the Eurodollar (-143,781 contracts), Ultra 10-Year (-35,370 contracts) and the Long US Bond (-3,130 contracts).
Free Reports:
 Get our Weekly Commitment of Traders Reports - See where the biggest traders (Hedge Funds and Commercial Hedgers) are positioned in the futures markets on a weekly basis.
 Sign Up for Our Stock Market Newsletter – Get updated on News, Charts & Rankings of Public Companies when you join our Stocks Newsletter
| Mar-15-2022 | OI | OI-Index | Spec-Net | Spec-Index | Com-Net | COM-Index | Smalls-Net | Smalls-Index |
|---|---|---|---|---|---|---|---|---|
| Eurodollar | 10,624,293 | 37 | -2,528,477 | 0 | 2,952,797 | 100 | -424,320 | 11 |
| FedFunds | 2,057,322 | 76 | -105,281 | 27 | 120,855 | 75 | -15,574 | 20 |
| 2-Year | 2,155,448 | 15 | -20,433 | 78 | 89,684 | 39 | -69,251 | 14 |
| Long T-Bond | 1,118,301 | 35 | 44,238 | 99 | -29,752 | 11 | -14,486 | 41 |
| 10-Year | 3,561,445 | 34 | -320,997 | 23 | 512,812 | 86 | -191,815 | 34 |
| 5-Year | 3,796,317 | 37 | -347,302 | 22 | 590,098 | 85 | -242,796 | 14 |
3-Month Eurodollars Futures:
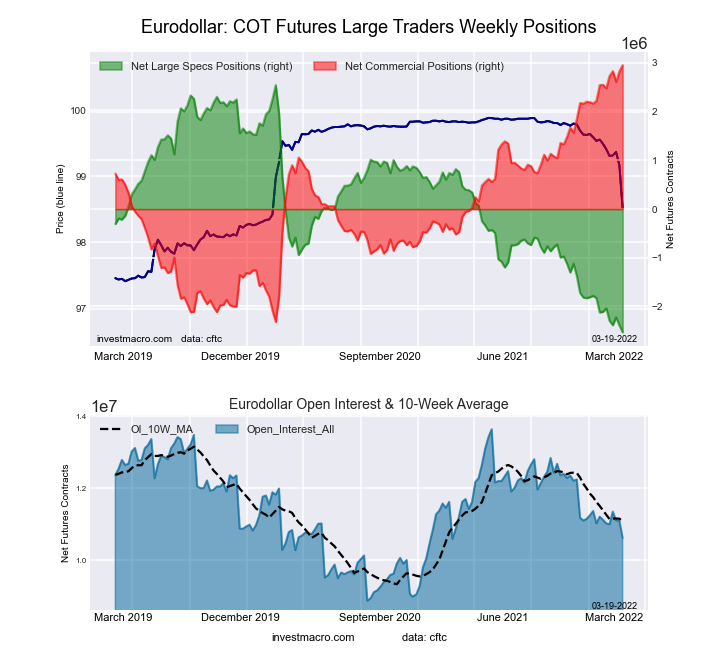 The 3-Month Eurodollars large speculator standing this week recorded a net position of -2,528,477 contracts in the data reported through Tuesday. This was a weekly lowering of -143,781 contracts from the previous week which had a total of -2,384,696 net contracts.
This week’s current strength score (the trader positioning range over the past three years, measured from 0 to 100) shows the speculators are currently Bearish-Extreme with a score of 0.0 percent. The commercials are Bullish-Extreme with a score of 100.0 percent and the small traders (not shown in chart) are Bearish-Extreme with a score of 11.1 percent.
| 3-Month Eurodollars Statistics | SPECULATORS | COMMERCIALS | SMALL TRADERS |
| – Percent of Open Interest Longs: | 4.0 | 76.6 | 3.6 |
| – Percent of Open Interest Shorts: | 27.8 | 48.8 | 7.6 |
| – Net Position: | -2,528,477 | 2,952,797 | -424,320 |
| – Gross Longs: | 421,782 | 8,135,944 | 386,903 |
| – Gross Shorts: | 2,950,259 | 5,183,147 | 811,223 |
| – Long to Short Ratio: | 0.1 to 1 | 1.6 to 1 | 0.5 to 1 |
| NET POSITION TREND: | |||
| – Strength Index Score (3 Year Range Pct): | 0.0 | 100.0 | 11.1 |
| – Strength Index Reading (3 Year Range): | Bearish-Extreme | Bullish-Extreme | Bearish-Extreme |
| NET POSITION MOVEMENT INDEX: | |||
| – 6-Week Change in Strength Index: | -8.3 | 7.6 | 3.6 |
30-Day Federal Funds Futures:
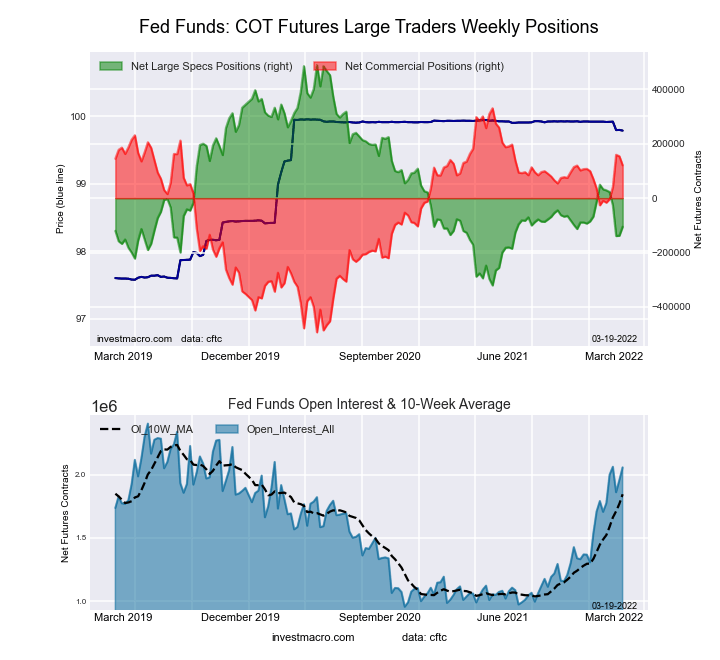 The 30-Day Federal Funds large speculator standing this week recorded a net position of -105,281 contracts in the data reported through Tuesday. This was a weekly advance of 32,857 contracts from the previous week which had a total of -138,138 net contracts.
This week’s current strength score (the trader positioning range over the past three years, measured from 0 to 100) shows the speculators are currently Bearish with a score of 26.6 percent. The commercials are Bullish with a score of 74.6 percent and the small traders (not shown in chart) are Bearish with a score of 20.1 percent.
| 30-Day Federal Funds Statistics | SPECULATORS | COMMERCIALS | SMALL TRADERS |
| – Percent of Open Interest Longs: | 3.4 | 78.3 | 1.5 |
| – Percent of Open Interest Shorts: | 8.5 | 72.4 | 2.2 |
| – Net Position: | -105,281 | 120,855 | -15,574 |
| – Gross Longs: | 70,601 | 1,610,540 | 30,462 |
| – Gross Shorts: | 175,882 | 1,489,685 | 46,036 |
| – Long to Short Ratio: | 0.4 to 1 | 1.1 to 1 | 0.7 to 1 |
| NET POSITION TREND: | |||
| – Strength Index Score (3 Year Range Pct): | 26.6 | 74.6 | 20.1 |
| – Strength Index Reading (3 Year Range): | Bearish | Bullish | Bearish |
| NET POSITION MOVEMENT INDEX: | |||
| – 6-Week Change in Strength Index: | -17.0 | 15.8 | 19.9 |
2-Year Treasury Note Futures:
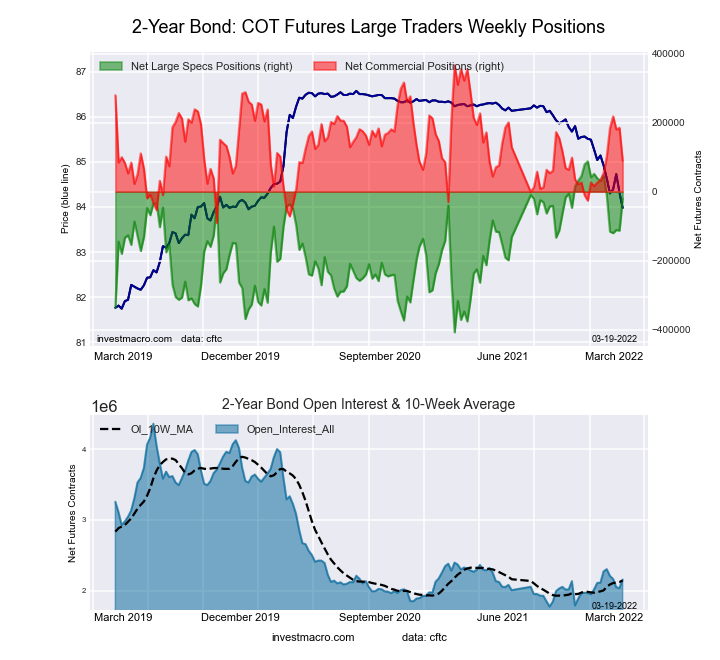 The 2-Year Treasury Note large speculator standing this week recorded a net position of -20,433 contracts in the data reported through Tuesday. This was a weekly advance of 92,313 contracts from the previous week which had a total of -112,746 net contracts.
This week’s current strength score (the trader positioning range over the past three years, measured from 0 to 100) shows the speculators are currently Bullish with a score of 78.1 percent. The commercials are Bearish with a score of 39.4 percent and the small traders (not shown in chart) are Bearish-Extreme with a score of 14.3 percent.
| 2-Year Treasury Note Statistics | SPECULATORS | COMMERCIALS | SMALL TRADERS |
| – Percent of Open Interest Longs: | 14.5 | 76.3 | 6.4 |
| – Percent of Open Interest Shorts: | 15.4 | 72.1 | 9.6 |
| – Net Position: | -20,433 | 89,684 | -69,251 |
| – Gross Longs: | 312,101 | 1,644,077 | 138,269 |
| – Gross Shorts: | 332,534 | 1,554,393 | 207,520 |
| – Long to Short Ratio: | 0.9 to 1 | 1.1 to 1 | 0.7 to 1 |
| NET POSITION TREND: | |||
| – Strength Index Score (3 Year Range Pct): | 78.1 | 39.4 | 14.3 |
| – Strength Index Reading (3 Year Range): | Bullish | Bearish | Bearish-Extreme |
| NET POSITION MOVEMENT INDEX: | |||
| – 6-Week Change in Strength Index: | -13.7 | 7.8 | 14.3 |
5-Year Treasury Note Futures:
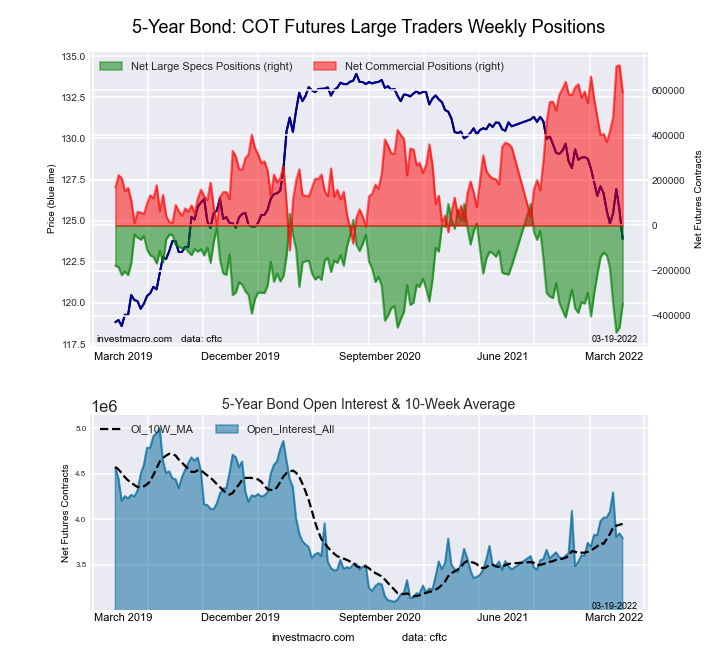 The 5-Year Treasury Note large speculator standing this week recorded a net position of -347,302 contracts in the data reported through Tuesday. This was a weekly rise of 104,839 contracts from the previous week which had a total of -452,141 net contracts.
This week’s current strength score (the trader positioning range over the past three years, measured from 0 to 100) shows the speculators are currently Bearish with a score of 22.3 percent. The commercials are Bullish-Extreme with a score of 85.2 percent and the small traders (not shown in chart) are Bearish-Extreme with a score of 14.4 percent.
| 5-Year Treasury Note Statistics | SPECULATORS | COMMERCIALS | SMALL TRADERS |
| – Percent of Open Interest Longs: | 8.8 | 82.3 | 6.6 |
| – Percent of Open Interest Shorts: | 18.0 | 66.8 | 13.0 |
| – Net Position: | -347,302 | 590,098 | -242,796 |
| – Gross Longs: | 335,536 | 3,125,740 | 251,950 |
| – Gross Shorts: | 682,838 | 2,535,642 | 494,746 |
| – Long to Short Ratio: | 0.5 to 1 | 1.2 to 1 | 0.5 to 1 |
| NET POSITION TREND: | |||
| – Strength Index Score (3 Year Range Pct): | 22.3 | 85.2 | 14.4 |
| – Strength Index Reading (3 Year Range): | Bearish | Bullish-Extreme | Bearish-Extreme |
| NET POSITION MOVEMENT INDEX: | |||
| – 6-Week Change in Strength Index: | -39.8 | 22.3 | 11.9 |
10-Year Treasury Note Futures:
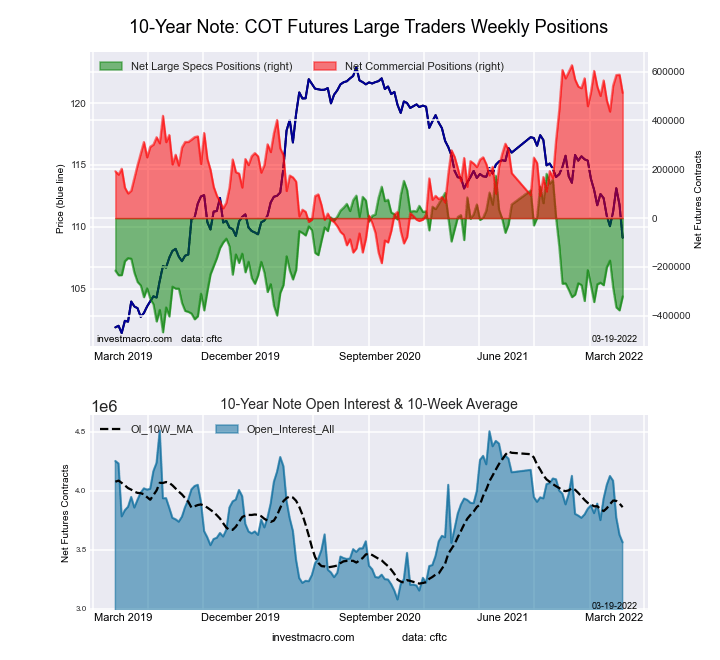 The 10-Year Treasury Note large speculator standing this week recorded a net position of -320,997 contracts in the data reported through Tuesday. This was a weekly increase of 56,723 contracts from the previous week which had a total of -377,720 net contracts.
This week’s current strength score (the trader positioning range over the past three years, measured from 0 to 100) shows the speculators are currently Bearish with a score of 22.6 percent. The commercials are Bullish-Extreme with a score of 86.0 percent and the small traders (not shown in chart) are Bearish with a score of 34.0 percent.
| 10-Year Treasury Note Statistics | SPECULATORS | COMMERCIALS | SMALL TRADERS |
| – Percent of Open Interest Longs: | 8.2 | 79.8 | 8.7 |
| – Percent of Open Interest Shorts: | 17.2 | 65.5 | 14.1 |
| – Net Position: | -320,997 | 512,812 | -191,815 |
| – Gross Longs: | 293,043 | 2,843,812 | 311,433 |
| – Gross Shorts: | 614,040 | 2,331,000 | 503,248 |
| – Long to Short Ratio: | 0.5 to 1 | 1.2 to 1 | 0.6 to 1 |
| NET POSITION TREND: | |||
| – Strength Index Score (3 Year Range Pct): | 22.6 | 86.0 | 34.0 |
| – Strength Index Reading (3 Year Range): | Bearish | Bullish-Extreme | Bearish |
| NET POSITION MOVEMENT INDEX: | |||
| – 6-Week Change in Strength Index: | -7.1 | -6.3 | 22.6 |
Ultra 10-Year Notes Futures:
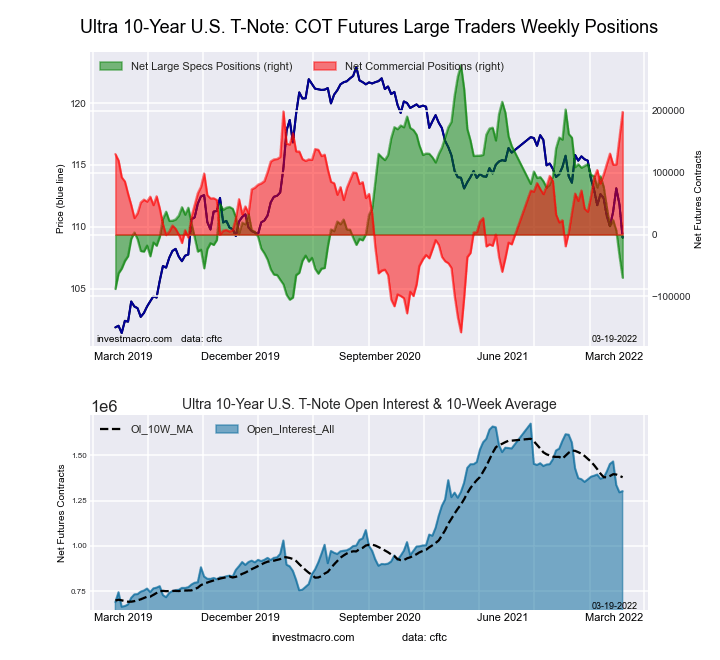 The Ultra 10-Year Notes large speculator standing this week recorded a net position of -69,750 contracts in the data reported through Tuesday. This was a weekly fall of -35,370 contracts from the previous week which had a total of -34,380 net contracts.
This week’s current strength score (the trader positioning range over the past three years, measured from 0 to 100) shows the speculators are currently Bearish-Extreme with a score of 9.3 percent. The commercials are Bullish-Extreme with a score of 99.8 percent and the small traders (not shown in chart) are Bearish with a score of 38.2 percent.
| Ultra 10-Year Notes Statistics | SPECULATORS | COMMERCIALS | SMALL TRADERS |
| – Percent of Open Interest Longs: | 10.5 | 79.7 | 8.9 |
| – Percent of Open Interest Shorts: | 15.9 | 64.5 | 18.8 |
| – Net Position: | -69,750 | 198,122 | -128,372 |
| – Gross Longs: | 137,331 | 1,038,528 | 116,422 |
| – Gross Shorts: | 207,081 | 840,406 | 244,794 |
| – Long to Short Ratio: | 0.7 to 1 | 1.2 to 1 | 0.5 to 1 |
| NET POSITION TREND: | |||
| – Strength Index Score (3 Year Range Pct): | 9.3 | 99.8 | 38.2 |
| – Strength Index Reading (3 Year Range): | Bearish-Extreme | Bullish-Extreme | Bearish |
| NET POSITION MOVEMENT INDEX: | |||
| – 6-Week Change in Strength Index: | -38.9 | 28.3 | 27.7 |
US Treasury Bonds Futures:
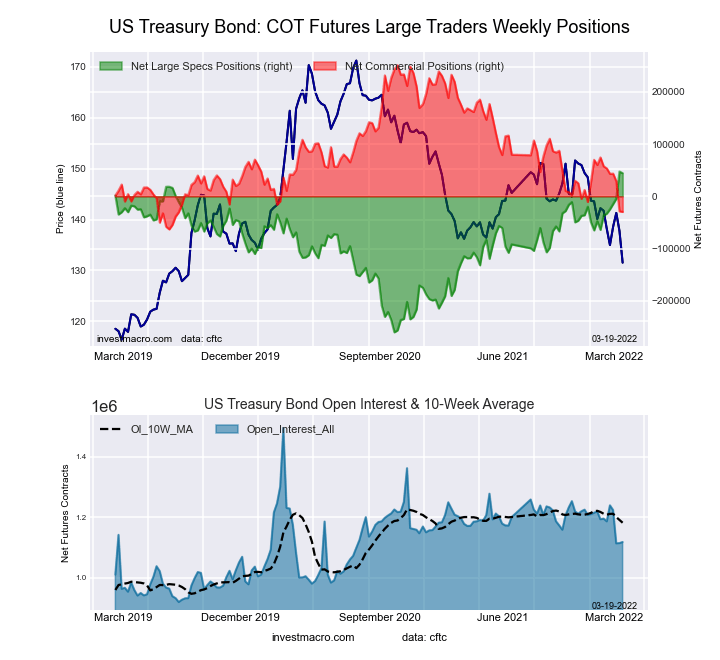 The US Treasury Bonds large speculator standing this week recorded a net position of 44,238 contracts in the data reported through Tuesday. This was a weekly decrease of -3,130 contracts from the previous week which had a total of 47,368 net contracts.
This week’s current strength score (the trader positioning range over the past three years, measured from 0 to 100) shows the speculators are currently Bullish-Extreme with a score of 99.0 percent. The commercials are Bearish-Extreme with a score of 10.7 percent and the small traders (not shown in chart) are Bearish with a score of 41.1 percent.
| US Treasury Bonds Statistics | SPECULATORS | COMMERCIALS | SMALL TRADERS |
| – Percent of Open Interest Longs: | 11.2 | 72.1 | 14.0 |
| – Percent of Open Interest Shorts: | 7.3 | 74.7 | 15.3 |
| – Net Position: | 44,238 | -29,752 | -14,486 |
| – Gross Longs: | 125,767 | 805,967 | 156,315 |
| – Gross Shorts: | 81,529 | 835,719 | 170,801 |
| – Long to Short Ratio: | 1.5 to 1 | 1.0 to 1 | 0.9 to 1 |
| NET POSITION TREND: | |||
| – Strength Index Score (3 Year Range Pct): | 99.0 | 10.7 | 41.1 |
| – Strength Index Reading (3 Year Range): | Bullish-Extreme | Bearish-Extreme | Bearish |
| NET POSITION MOVEMENT INDEX: | |||
| – 6-Week Change in Strength Index: | 26.3 | -27.8 | 5.1 |
Ultra US Treasury Bonds Futures:
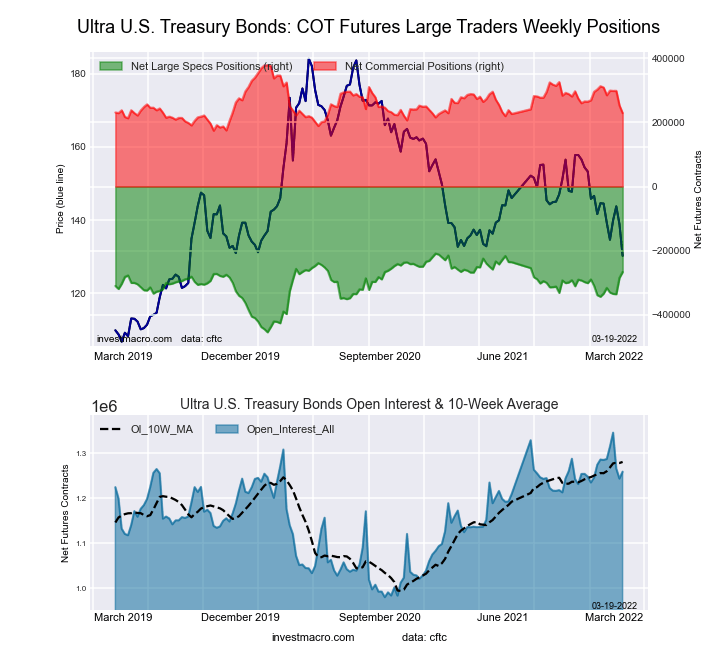 The Ultra US Treasury Bonds large speculator standing this week recorded a net position of -266,244 contracts in the data reported through Tuesday. This was a weekly gain of 18,174 contracts from the previous week which had a total of -284,418 net contracts.
This week’s current strength score (the trader positioning range over the past three years, measured from 0 to 100) shows the speculators are currently Bullish with a score of 76.6 percent. The commercials are Bearish with a score of 26.8 percent and the small traders (not shown in chart) are Bullish with a score of 55.2 percent.
| Ultra US Treasury Bonds Statistics | SPECULATORS | COMMERCIALS | SMALL TRADERS |
| – Percent of Open Interest Longs: | 7.0 | 80.1 | 12.3 |
| – Percent of Open Interest Shorts: | 28.1 | 61.9 | 9.3 |
| – Net Position: | -266,244 | 228,742 | 37,502 |
| – Gross Longs: | 87,587 | 1,008,627 | 154,454 |
| – Gross Shorts: | 353,831 | 779,885 | 116,952 |
| – Long to Short Ratio: | 0.2 to 1 | 1.3 to 1 | 1.3 to 1 |
| NET POSITION TREND: | |||
| – Strength Index Score (3 Year Range Pct): | 76.6 | 26.8 | 55.2 |
| – Strength Index Reading (3 Year Range): | Bullish | Bearish | Bullish |
| NET POSITION MOVEMENT INDEX: | |||
| – 6-Week Change in Strength Index: | 27.5 | -39.2 | 9.0 |
Article By InvestMacro – Receive our weekly COT Reports by Email
*COT Report: The COT data, released weekly to the public each Friday, is updated through the most recent Tuesday (data is 3 days old) and shows a quick view of how large speculators or non-commercials (for-profit traders) were positioned in the futures markets.
The CFTC categorizes trader positions according to commercial hedgers (traders who use futures contracts for hedging as part of the business), non-commercials (large traders who speculate to realize trading profits) and nonreportable traders (usually small traders/speculators) as well as their open interest (contracts open in the market at time of reporting).See CFTC criteria here.

- Bitcoin rose to $66,000. The New Zealand dollar continues to strengthen Jul 22, 2026
- Inflationary pressure is easing in Canada. In New Zealand, on the contrary, inflation is rising Jul 21, 2026
- GBP/USD Falls After Cabinet Changes Jul 21, 2026
- Geopolitical and macroeconomic conditions continue to pressure market sentiment Jul 20, 2026
- USD/JPY Poised to Continue Gains as Expensive Oil and Lack of Support Weigh on Yen Jul 20, 2026
- COT Metals Charts: Weekly Speculator Bets led by Copper & Steel Jul 18, 2026
- COT Bonds Charts: Weekly Speculator Bets led by 2-Year, SOFR 3M & 5-Year Bonds Jul 18, 2026
- COT Energy Charts: Weekly Speculator Bets led by Brent Oil & Heating Oil Jul 18, 2026
- COT Soft Commodities Charts: Weekly Speculator Bets led by Wheat, Corn & Soybean Meal Jul 18, 2026
- The Bank of Canada kept its interest rate unchanged. Platinum prices reached a three‑week high Jul 16, 2026