
By InvestMacro | COT | Data Tables | COT Leaders | Downloads | COT Newsletter
Here are the latest charts and statistics for the Commitment of Traders (COT) data published by the Commodities Futures Trading Commission (CFTC).
The latest COT data is updated through Tuesday February 22nd and shows a quick view of how large traders (for-profit speculators and commercial entities) were positioned in the futures markets.
Highlighting the COT bonds data was the large increase in bearish bets for the 10-Year Bonds. The speculative bearish position in the 10-Year jumped this week by -111,029 contracts and marked the largest one-week rise in bearish positions since November 2nd, a span of sixteen weeks. This decline in sentiment has pushed the overall 10-Year spec positioning to the most bearish level of the past six weeks. Most of the bonds markets we cover saw an increase in their bearish bets this week as the Federal Reserve central bank is widely expected to raise their benchmark interest rate in March.
Joining the 10-Year (-111,029 contracts) with speculator weakness this week were the Eurodollar (-89,630 contracts), 2-Year Bond (-4,201 contracts), Fed Funds (-49,473 contracts), 5-Year Bond (-155,821 contracts) and the Ultra US Bond (-4,242 contracts). The Ultra 10-Year (9,672 contracts) and Long US Bond (10,107 contracts) saw small improvement in their speculator contracts this week.
| Feb-22-2022 | OI | OI-Index | Spec-Net | Spec-Index | Com-Net | COM-Index | Smalls-Net | Smalls-Index |
|---|---|---|---|---|---|---|---|---|
| Eurodollar | 11,350,313 | 52 | -2,382,867 | 0 | 2,830,166 | 100 | -447,299 | 6 |
| FedFunds | 2,062,168 | 76 | -26,952 | 36 | 41,655 | 65 | -14,703 | 25 |
| 2-Year | 2,163,983 | 15 | -119,959 | 58 | 218,056 | 68 | -98,097 | 1 |
| Long T-Bond | 1,223,515 | 53 | -14,738 | 88 | 43,269 | 34 | -28,531 | 30 |
| 10-Year | 4,083,463 | 70 | -285,092 | 28 | 543,178 | 90 | -258,086 | 19 |
| 5-Year | 4,295,789 | 63 | -347,236 | 19 | 483,375 | 77 | -136,139 | 44 |
Free Reports:
 Get our Weekly Commitment of Traders Reports - See where the biggest traders (Hedge Funds and Commercial Hedgers) are positioned in the futures markets on a weekly basis.
 Download Our Metatrader 4 Indicators – Put Our Free MetaTrader 4 Custom Indicators on your charts when you join our Weekly Newsletter
3-Month Eurodollars Futures:
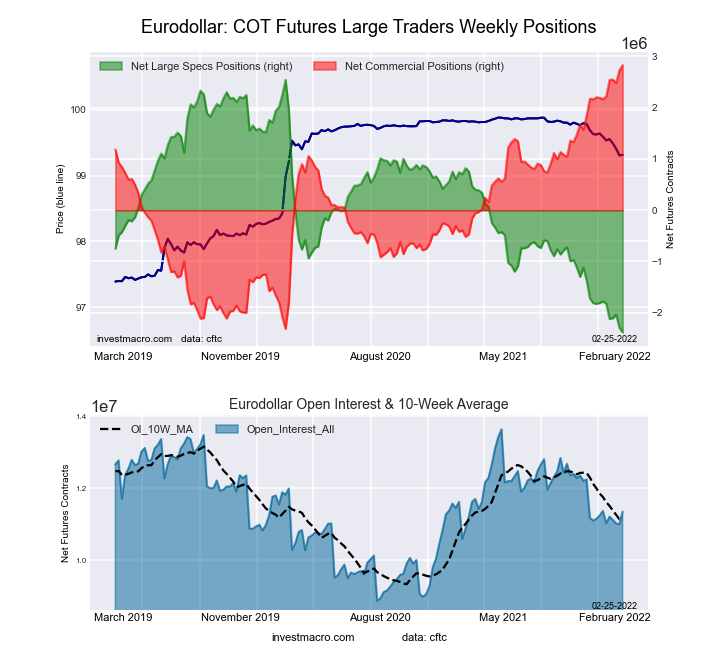 The 3-Month Eurodollars large speculator standing this week was a net position of -2,382,867 contracts in the data reported through Tuesday. This was a weekly lowering of -89,630 contracts from the previous week which had a total of -2,293,237 net contracts.
This week’s current strength score (the trader positioning range over the past three years, measured from 0 to 100) shows the speculators are currently Bearish-Extreme with a score of 0.0 percent. The commercials are Bullish-Extreme with a score of 100.0 percent and the small traders (not shown in chart) are Bearish-Extreme with a score of 6.0 percent.
| 3-Month Eurodollars Statistics | SPECULATORS | COMMERCIALS | SMALL TRADERS |
| – Percent of Open Interest Longs: | 4.7 | 74.1 | 4.6 |
| – Percent of Open Interest Shorts: | 25.7 | 49.1 | 8.5 |
| – Net Position: | -2,382,867 | 2,830,166 | -447,299 |
| – Gross Longs: | 536,990 | 8,405,647 | 522,154 |
| – Gross Shorts: | 2,919,857 | 5,575,481 | 969,453 |
| – Long to Short Ratio: | 0.2 to 1 | 1.5 to 1 | 0.5 to 1 |
| NET POSITION TREND: | |||
| – Strength Index Score (3 Year Range Pct): | 0.0 | 100.0 | 6.0 |
| – Strength Index Reading (3 Year Range): | Bearish-Extreme | Bullish-Extreme | Bearish-Extreme |
| NET POSITION MOVEMENT INDEX: | |||
| – 6-Week Change in Strength Index: | -12.2 | 12.9 | -13.5 |
30-Day Federal Funds Futures:
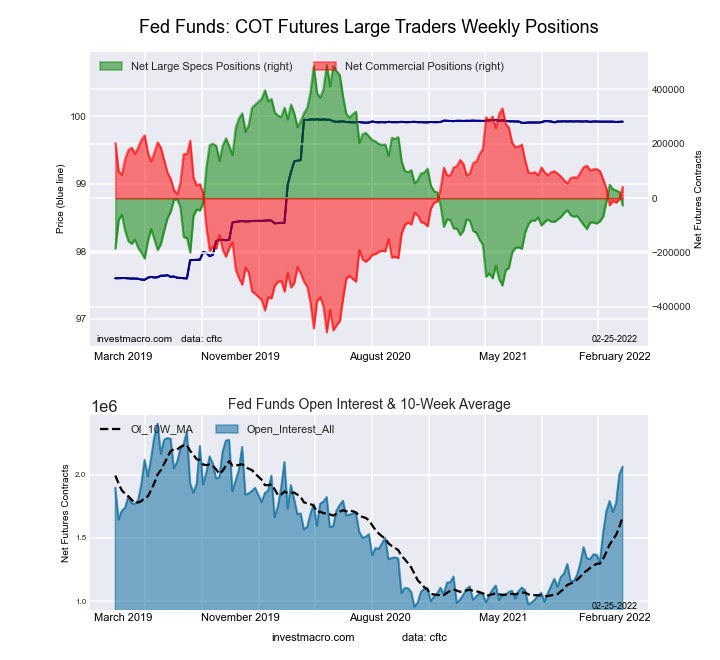 The 30-Day Federal Funds large speculator standing this week was a net position of -26,952 contracts in the data reported through Tuesday. This was a weekly decline of -49,473 contracts from the previous week which had a total of 22,521 net contracts.
This week’s current strength score (the trader positioning range over the past three years, measured from 0 to 100) shows the speculators are currently Bearish with a score of 36.3 percent. The commercials are Bullish with a score of 64.9 percent and the small traders (not shown in chart) are Bearish with a score of 25.2 percent.
| 30-Day Federal Funds Statistics | SPECULATORS | COMMERCIALS | SMALL TRADERS |
| – Percent of Open Interest Longs: | 7.8 | 75.1 | 2.5 |
| – Percent of Open Interest Shorts: | 9.1 | 73.1 | 3.2 |
| – Net Position: | -26,952 | 41,655 | -14,703 |
| – Gross Longs: | 161,357 | 1,549,551 | 50,750 |
| – Gross Shorts: | 188,309 | 1,507,896 | 65,453 |
| – Long to Short Ratio: | 0.9 to 1 | 1.0 to 1 | 0.8 to 1 |
| NET POSITION TREND: | |||
| – Strength Index Score (3 Year Range Pct): | 36.3 | 64.9 | 25.2 |
| – Strength Index Reading (3 Year Range): | Bearish | Bullish | Bearish |
| NET POSITION MOVEMENT INDEX: | |||
| – 6-Week Change in Strength Index: | 5.0 | -3.4 | -29.9 |
2-Year Treasury Note Futures:
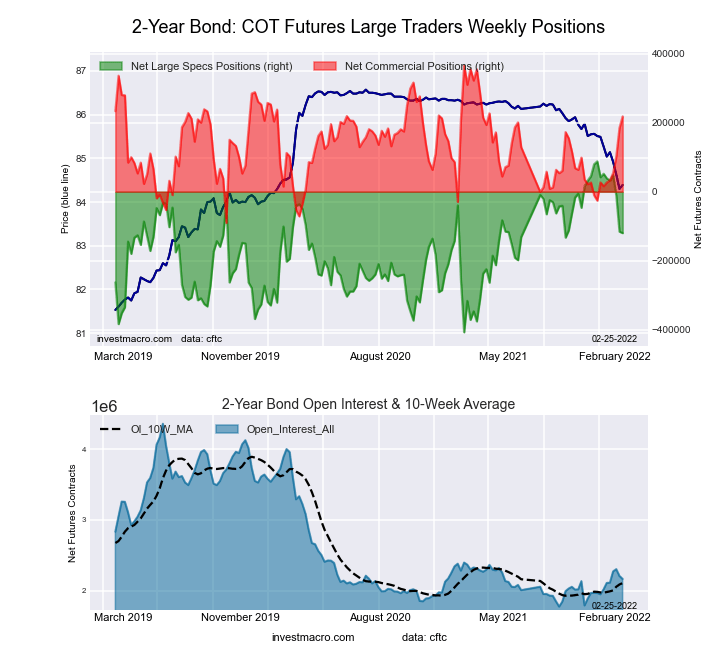 The 2-Year Treasury Note large speculator standing this week was a net position of -119,959 contracts in the data reported through Tuesday. This was a weekly reduction of -4,201 contracts from the previous week which had a total of -115,758 net contracts.
This week’s current strength score (the trader positioning range over the past three years, measured from 0 to 100) shows the speculators are currently Bullish with a score of 58.0 percent. The commercials are Bullish with a score of 67.5 percent and the small traders (not shown in chart) are Bearish-Extreme with a score of 1.5 percent.
| 2-Year Treasury Note Statistics | SPECULATORS | COMMERCIALS | SMALL TRADERS |
| – Percent of Open Interest Longs: | 12.1 | 76.5 | 7.0 |
| – Percent of Open Interest Shorts: | 17.6 | 66.4 | 11.5 |
| – Net Position: | -119,959 | 218,056 | -98,097 |
| – Gross Longs: | 261,710 | 1,655,912 | 150,668 |
| – Gross Shorts: | 381,669 | 1,437,856 | 248,765 |
| – Long to Short Ratio: | 0.7 to 1 | 1.2 to 1 | 0.6 to 1 |
| NET POSITION TREND: | |||
| – Strength Index Score (3 Year Range Pct): | 58.0 | 67.5 | 1.5 |
| – Strength Index Reading (3 Year Range): | Bullish | Bullish | Bearish-Extreme |
| NET POSITION MOVEMENT INDEX: | |||
| – 6-Week Change in Strength Index: | -34.7 | 44.2 | -13.4 |
5-Year Treasury Note Futures:
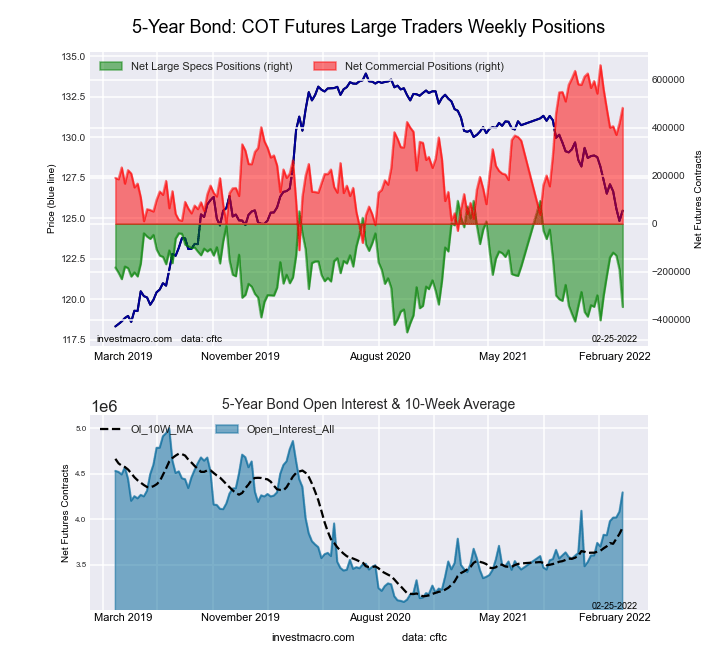 The 5-Year Treasury Note large speculator standing this week was a net position of -347,236 contracts in the data reported through Tuesday. This was a weekly decrease of -155,821 contracts from the previous week which had a total of -191,415 net contracts.
This week’s current strength score (the trader positioning range over the past three years, measured from 0 to 100) shows the speculators are currently Bearish-Extreme with a score of 19.3 percent. The commercials are Bullish with a score of 76.9 percent and the small traders (not shown in chart) are Bearish with a score of 43.6 percent.
| 5-Year Treasury Note Statistics | SPECULATORS | COMMERCIALS | SMALL TRADERS |
| – Percent of Open Interest Longs: | 7.3 | 78.2 | 9.5 |
| – Percent of Open Interest Shorts: | 15.4 | 67.0 | 12.7 |
| – Net Position: | -347,236 | 483,375 | -136,139 |
| – Gross Longs: | 314,612 | 3,360,252 | 409,662 |
| – Gross Shorts: | 661,848 | 2,876,877 | 545,801 |
| – Long to Short Ratio: | 0.5 to 1 | 1.2 to 1 | 0.8 to 1 |
| NET POSITION TREND: | |||
| – Strength Index Score (3 Year Range Pct): | 19.3 | 76.9 | 43.6 |
| – Strength Index Reading (3 Year Range): | Bearish-Extreme | Bullish | Bearish |
| NET POSITION MOVEMENT INDEX: | |||
| – 6-Week Change in Strength Index: | -8.7 | -10.0 | 34.1 |
10-Year Treasury Note Futures:
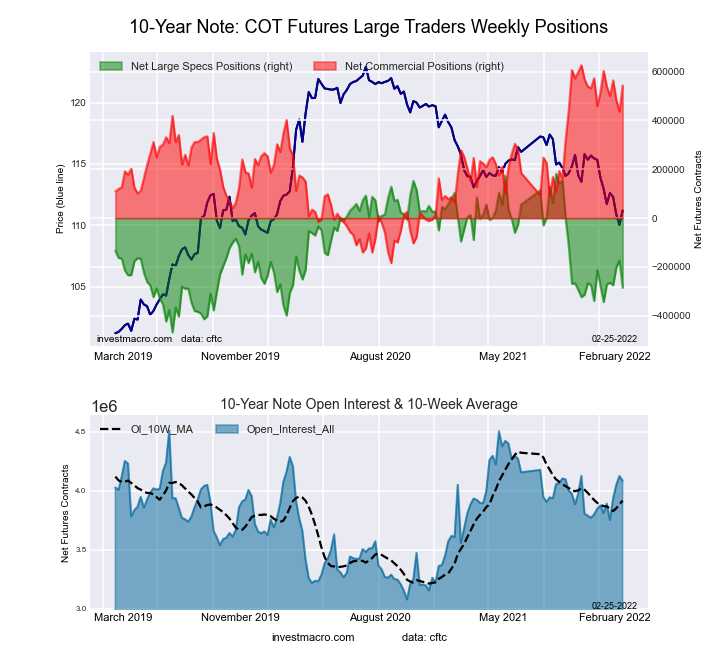 The 10-Year Treasury Note large speculator standing this week was a net position of -285,092 contracts in the data reported through Tuesday. This was a weekly decrease of -111,029 contracts from the previous week which had a total of -174,063 net contracts.
This week’s current strength score (the trader positioning range over the past three years, measured from 0 to 100) shows the speculators are currently Bearish with a score of 28.1 percent. The commercials are Bullish-Extreme with a score of 89.8 percent and the small traders (not shown in chart) are Bearish-Extreme with a score of 18.6 percent.
| 10-Year Treasury Note Statistics | SPECULATORS | COMMERCIALS | SMALL TRADERS |
| – Percent of Open Interest Longs: | 10.6 | 74.3 | 9.4 |
| – Percent of Open Interest Shorts: | 17.6 | 61.0 | 15.8 |
| – Net Position: | -285,092 | 543,178 | -258,086 |
| – Gross Longs: | 432,764 | 3,034,786 | 385,175 |
| – Gross Shorts: | 717,856 | 2,491,608 | 643,261 |
| – Long to Short Ratio: | 0.6 to 1 | 1.2 to 1 | 0.6 to 1 |
| NET POSITION TREND: | |||
| – Strength Index Score (3 Year Range Pct): | 28.1 | 89.8 | 18.6 |
| – Strength Index Reading (3 Year Range): | Bearish | Bullish-Extreme | Bearish-Extreme |
| NET POSITION MOVEMENT INDEX: | |||
| – 6-Week Change in Strength Index: | 9.1 | -7.3 | 0.2 |
Ultra 10-Year Notes Futures:
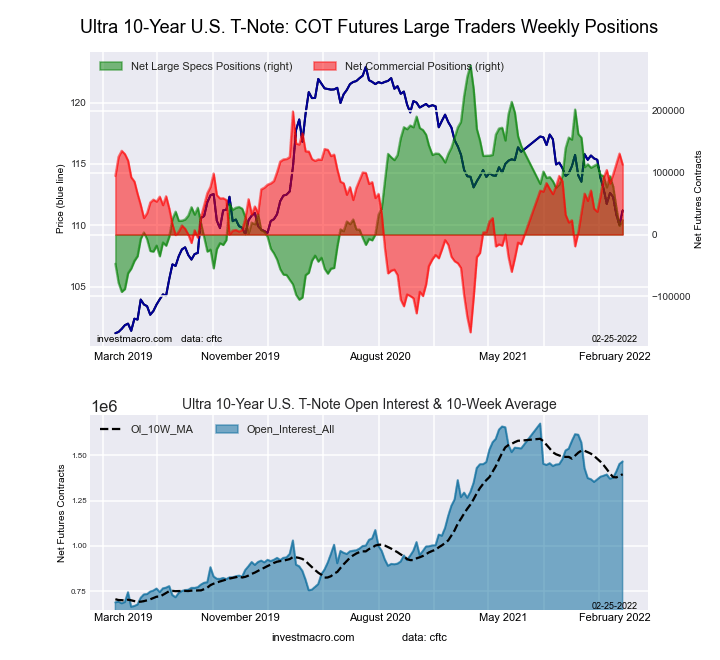 The Ultra 10-Year Notes large speculator standing this week was a net position of 23,543 contracts in the data reported through Tuesday. This was a weekly boost of 9,672 contracts from the previous week which had a total of 13,871 net contracts.
This week’s current strength score (the trader positioning range over the past three years, measured from 0 to 100) shows the speculators are currently Bearish with a score of 34.0 percent. The commercials are Bullish with a score of 75.9 percent and the small traders (not shown in chart) are Bearish with a score of 33.3 percent.
| Ultra 10-Year Notes Statistics | SPECULATORS | COMMERCIALS | SMALL TRADERS |
| – Percent of Open Interest Longs: | 15.5 | 71.3 | 9.6 |
| – Percent of Open Interest Shorts: | 13.9 | 63.6 | 18.9 |
| – Net Position: | 23,543 | 112,921 | -136,464 |
| – Gross Longs: | 226,775 | 1,045,206 | 140,723 |
| – Gross Shorts: | 203,232 | 932,285 | 277,187 |
| – Long to Short Ratio: | 1.1 to 1 | 1.1 to 1 | 0.5 to 1 |
| NET POSITION TREND: | |||
| – Strength Index Score (3 Year Range Pct): | 34.0 | 75.9 | 33.3 |
| – Strength Index Reading (3 Year Range): | Bearish | Bullish | Bearish |
| NET POSITION MOVEMENT INDEX: | |||
| – 6-Week Change in Strength Index: | -18.7 | 5.8 | 29.9 |
US Treasury Bonds Futures:
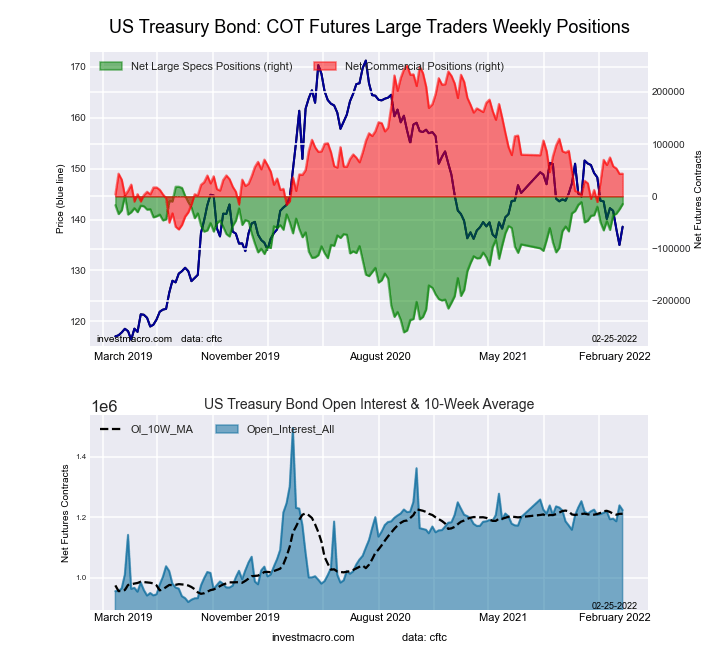 The US Treasury Bonds large speculator standing this week was a net position of -14,738 contracts in the data reported through Tuesday. This was a weekly lift of 10,107 contracts from the previous week which had a total of -24,845 net contracts.
This week’s current strength score (the trader positioning range over the past three years, measured from 0 to 100) shows the speculators are currently Bullish-Extreme with a score of 88.1 percent. The commercials are Bearish with a score of 33.9 percent and the small traders (not shown in chart) are Bearish with a score of 29.9 percent.
| US Treasury Bonds Statistics | SPECULATORS | COMMERCIALS | SMALL TRADERS |
| – Percent of Open Interest Longs: | 10.6 | 72.9 | 14.2 |
| – Percent of Open Interest Shorts: | 11.9 | 69.4 | 16.6 |
| – Net Position: | -14,738 | 43,269 | -28,531 |
| – Gross Longs: | 130,266 | 891,876 | 174,017 |
| – Gross Shorts: | 145,004 | 848,607 | 202,548 |
| – Long to Short Ratio: | 0.9 to 1 | 1.1 to 1 | 0.9 to 1 |
| NET POSITION TREND: | |||
| – Strength Index Score (3 Year Range Pct): | 88.1 | 33.9 | 29.9 |
| – Strength Index Reading (3 Year Range): | Bullish-Extreme | Bearish | Bearish |
| NET POSITION MOVEMENT INDEX: | |||
| – 6-Week Change in Strength Index: | 18.1 | -8.4 | -19.0 |
Ultra US Treasury Bonds Futures:
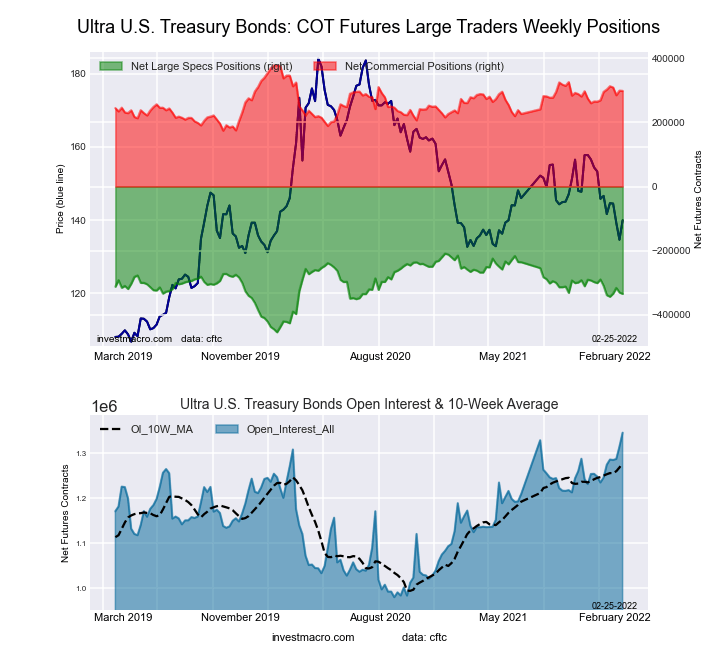 The Ultra US Treasury Bonds large speculator standing this week was a net position of -334,381 contracts in the data reported through Tuesday. This was a weekly lowering of -4,242 contracts from the previous week which had a total of -330,139 net contracts.
This week’s current strength score (the trader positioning range over the past three years, measured from 0 to 100) shows the speculators are currently Bearish with a score of 48.8 percent. The commercials are Bullish with a score of 60.7 percent and the small traders (not shown in chart) are Bullish with a score of 54.6 percent.
| Ultra US Treasury Bonds Statistics | SPECULATORS | COMMERCIALS | SMALL TRADERS |
| – Percent of Open Interest Longs: | 6.0 | 79.7 | 11.9 |
| – Percent of Open Interest Shorts: | 30.8 | 57.6 | 9.2 |
| – Net Position: | -334,381 | 297,783 | 36,598 |
| – Gross Longs: | 80,638 | 1,072,855 | 159,934 |
| – Gross Shorts: | 415,019 | 775,072 | 123,336 |
| – Long to Short Ratio: | 0.2 to 1 | 1.4 to 1 | 1.3 to 1 |
| NET POSITION TREND: | |||
| – Strength Index Score (3 Year Range Pct): | 48.8 | 60.7 | 54.6 |
| – Strength Index Reading (3 Year Range): | Bearish | Bullish | Bullish |
| NET POSITION MOVEMENT INDEX: | |||
| – 6-Week Change in Strength Index: | -10.1 | 1.4 | 15.8 |
Article By InvestMacro – Receive our weekly COT Reports by Email
*COT Report: The COT data, released weekly to the public each Friday, is updated through the most recent Tuesday (data is 3 days old) and shows a quick view of how large speculators or non-commercials (for-profit traders) were positioned in the futures markets.
The CFTC categorizes trader positions according to commercial hedgers (traders who use futures contracts for hedging as part of the business), non-commercials (large traders who speculate to realize trading profits) and nonreportable traders (usually small traders/speculators) as well as their open interest (contracts open in the market at time of reporting).See CFTC criteria here.

- Oil prices reached a 6‑week high. The AUD strengthened on the back of a strong labor‑market report Jul 23, 2026
- EUR/USD Recovers as Dollar Weakens Jul 23, 2026
- Bitcoin rose to $66,000. The New Zealand dollar continues to strengthen Jul 22, 2026
- Inflationary pressure is easing in Canada. In New Zealand, on the contrary, inflation is rising Jul 21, 2026
- GBP/USD Falls After Cabinet Changes Jul 21, 2026
- Geopolitical and macroeconomic conditions continue to pressure market sentiment Jul 20, 2026
- USD/JPY Poised to Continue Gains as Expensive Oil and Lack of Support Weigh on Yen Jul 20, 2026
- COT Metals Charts: Weekly Speculator Bets led by Copper & Steel Jul 18, 2026
- COT Bonds Charts: Weekly Speculator Bets led by 2-Year, SOFR 3M & 5-Year Bonds Jul 18, 2026
- COT Energy Charts: Weekly Speculator Bets led by Brent Oil & Heating Oil Jul 18, 2026