
By InvestMacro | COT | Data Tables | COT Leaders | Downloads | COT Newsletter
Here are the latest charts and statistics for the Commitment of Traders (COT) data published by the Commodities Futures Trading Commission (CFTC).
The latest COT data is updated through Tuesday March 8th and shows a quick view of how large traders (for-profit speculators and commercial entities) were positioned in the futures markets.
Highlighting the COT bonds data is the continued bearishness in the 10-Year Bond futures. The speculative position in the 10-Year has seen bearish bets increase for three straight weeks and by a total of -203,657 contracts over this period. This rising bearishness has pushed the 10-Year speculator standing to the most bearish level in the past one hundred and eight weeks, dating back to February 11th of 2020 when the speculator position totaled -398,919 net contracts. The current 10-Year speculator strength index score underscores the weak speculator sentiment and shows an extreme-bearish reading with a 13.9 percent score this week. (The speculator strength index measures the current speculator standing compared to past three years, where above 80 is extreme-bullish , below 20 is extreme-bearish).
The bond markets with higher speculator bets were Long US Bond (51,897 contracts), Fed Funds (1,134 contracts), 5-Year (21,898 contracts) and the Ultra US Bond (50,843 contracts).
The markets with lower speculator bets were the 2-Year Bond (-1,919 contracts), Eurodollar (-164,965 contracts), 10-Year Bond (-11,937 contracts) and the Ultra 10-Year (-40,563 contracts).
Free Reports:
 Download Our Metatrader 4 Indicators – Put Our Free MetaTrader 4 Custom Indicators on your charts when you join our Weekly Newsletter
 Get our Weekly Commitment of Traders Reports - See where the biggest traders (Hedge Funds and Commercial Hedgers) are positioned in the futures markets on a weekly basis.
| Mar-08-2022 | OI | OI-Index | Spec-Net | Spec-Index | Com-Net | COM-Index | Smalls-Net | Smalls-Index |
|---|---|---|---|---|---|---|---|---|
| Eurodollar | 11,104,557 | 47 | -2,384,696 | 0 | 2,824,449 | 100 | -439,753 | 8 |
| FedFunds | 1,956,224 | 69 | -138,138 | 23 | 154,041 | 79 | -15,903 | 21 |
| 2-Year | 2,035,833 | 10 | -112,746 | 59 | 185,172 | 60 | -72,426 | 13 |
| Long T-Bond | 1,114,679 | 34 | 47,368 | 100 | -28,607 | 11 | -18,761 | 38 |
| 10-Year | 3,627,534 | 38 | -377,720 | 14 | 587,471 | 95 | -209,751 | 30 |
| 5-Year | 3,845,499 | 39 | -452,141 | 4 | 711,489 | 100 | -259,348 | 10 |
3-Month Eurodollars Futures:
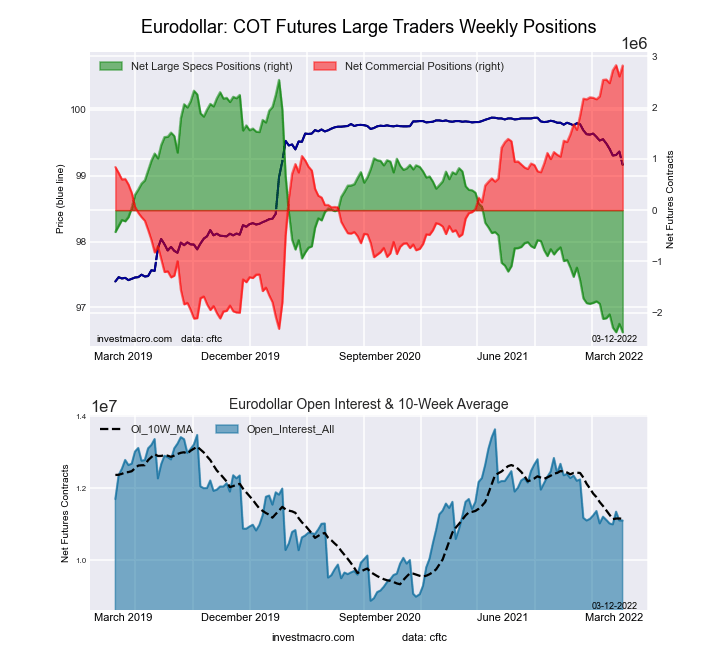 The 3-Month Eurodollars large speculator standing this week reached a net position of -2,384,696 contracts in the data reported through Tuesday. This was a weekly decline of -164,965 contracts from the previous week which had a total of -2,219,731 net contracts.
This week’s current strength score (the trader positioning range over the past three years, measured from 0 to 100) shows the speculators are currently Bearish-Extreme with a score of 0.0 percent. The commercials are Bullish-Extreme with a score of 99.9 percent and the small traders (not shown in chart) are Bearish-Extreme with a score of 7.7 percent.
| 3-Month Eurodollars Statistics | SPECULATORS | COMMERCIALS | SMALL TRADERS |
| – Percent of Open Interest Longs: | 4.6 | 75.8 | 3.7 |
| – Percent of Open Interest Shorts: | 26.1 | 50.3 | 7.6 |
| – Net Position: | -2,384,696 | 2,824,449 | -439,753 |
| – Gross Longs: | 514,260 | 8,413,589 | 405,813 |
| – Gross Shorts: | 2,898,956 | 5,589,140 | 845,566 |
| – Long to Short Ratio: | 0.2 to 1 | 1.5 to 1 | 0.5 to 1 |
| NET POSITION TREND: | |||
| – Strength Index Score (3 Year Range Pct): | 0.0 | 99.9 | 7.7 |
| – Strength Index Reading (3 Year Range): | Bearish-Extreme | Bullish-Extreme | Bearish-Extreme |
| NET POSITION MOVEMENT INDEX: | |||
| – 6-Week Change in Strength Index: | -5.3 | 5.5 | -4.0 |
30-Day Federal Funds Futures:
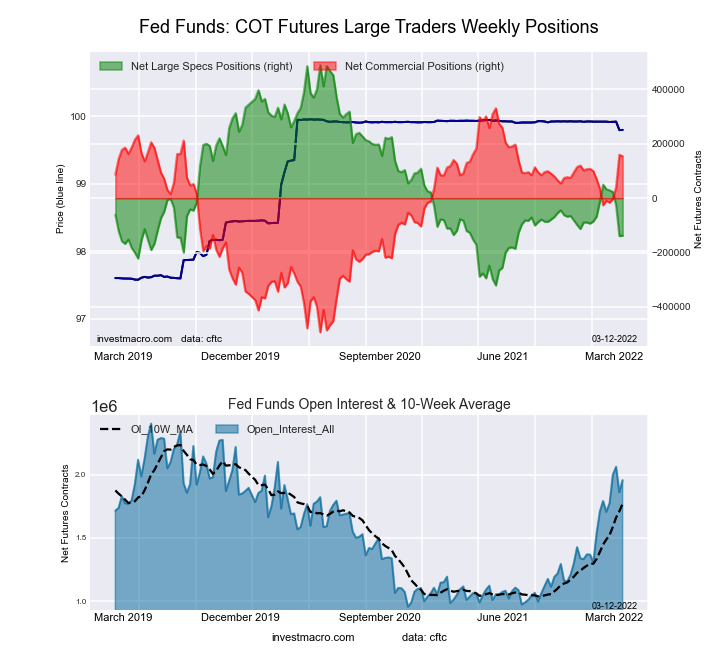 The 30-Day Federal Funds large speculator standing this week reached a net position of -138,138 contracts in the data reported through Tuesday. This was a weekly advance of 1,134 contracts from the previous week which had a total of -139,272 net contracts.
This week’s current strength score (the trader positioning range over the past three years, measured from 0 to 100) shows the speculators are currently Bearish with a score of 22.6 percent. The commercials are Bullish with a score of 78.6 percent and the small traders (not shown in chart) are Bearish with a score of 21.1 percent.
| 30-Day Federal Funds Statistics | SPECULATORS | COMMERCIALS | SMALL TRADERS |
| – Percent of Open Interest Longs: | 2.4 | 79.8 | 1.3 |
| – Percent of Open Interest Shorts: | 9.4 | 71.9 | 2.2 |
| – Net Position: | -138,138 | 154,041 | -15,903 |
| – Gross Longs: | 46,020 | 1,561,469 | 26,372 |
| – Gross Shorts: | 184,158 | 1,407,428 | 42,275 |
| – Long to Short Ratio: | 0.2 to 1 | 1.1 to 1 | 0.6 to 1 |
| NET POSITION TREND: | |||
| – Strength Index Score (3 Year Range Pct): | 22.6 | 78.6 | 21.1 |
| – Strength Index Reading (3 Year Range): | Bearish | Bullish | Bearish |
| NET POSITION MOVEMENT INDEX: | |||
| – 6-Week Change in Strength Index: | -23.2 | 21.9 | 18.3 |
2-Year Treasury Note Futures:
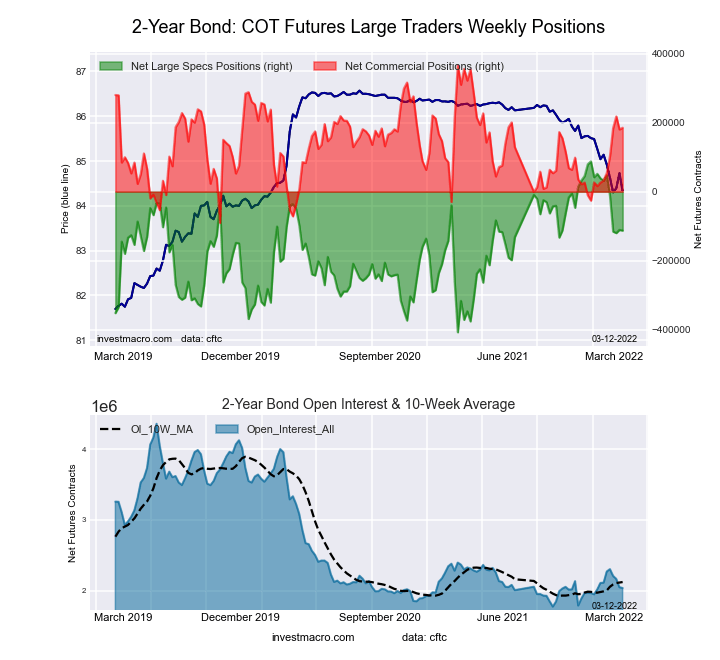 The 2-Year Treasury Note large speculator standing this week reached a net position of -112,746 contracts in the data reported through Tuesday. This was a weekly decrease of -1,919 contracts from the previous week which had a total of -110,827 net contracts.
This week’s current strength score (the trader positioning range over the past three years, measured from 0 to 100) shows the speculators are currently Bullish with a score of 59.5 percent. The commercials are Bullish with a score of 60.3 percent and the small traders (not shown in chart) are Bearish-Extreme with a score of 12.9 percent.
| 2-Year Treasury Note Statistics | SPECULATORS | COMMERCIALS | SMALL TRADERS |
| – Percent of Open Interest Longs: | 12.4 | 78.6 | 6.7 |
| – Percent of Open Interest Shorts: | 18.0 | 69.5 | 10.3 |
| – Net Position: | -112,746 | 185,172 | -72,426 |
| – Gross Longs: | 253,295 | 1,600,373 | 136,835 |
| – Gross Shorts: | 366,041 | 1,415,201 | 209,261 |
| – Long to Short Ratio: | 0.7 to 1 | 1.1 to 1 | 0.7 to 1 |
| NET POSITION TREND: | |||
| – Strength Index Score (3 Year Range Pct): | 59.5 | 60.3 | 12.9 |
| – Strength Index Reading (3 Year Range): | Bullish | Bullish | Bearish-Extreme |
| NET POSITION MOVEMENT INDEX: | |||
| – 6-Week Change in Strength Index: | -29.2 | 33.3 | -3.4 |
5-Year Treasury Note Futures:
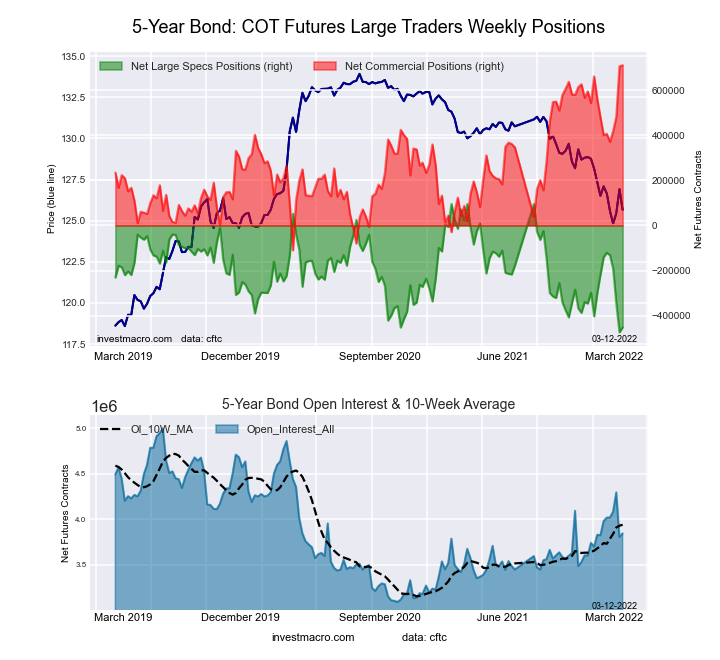 The 5-Year Treasury Note large speculator standing this week reached a net position of -452,141 contracts in the data reported through Tuesday. This was a weekly gain of 21,898 contracts from the previous week which had a total of -474,039 net contracts.
This week’s current strength score (the trader positioning range over the past three years, measured from 0 to 100) shows the speculators are currently Bearish-Extreme with a score of 3.8 percent. The commercials are Bullish-Extreme with a score of 100.0 percent and the small traders (not shown in chart) are Bearish-Extreme with a score of 9.9 percent.
| 5-Year Treasury Note Statistics | SPECULATORS | COMMERCIALS | SMALL TRADERS |
| – Percent of Open Interest Longs: | 8.0 | 83.1 | 6.8 |
| – Percent of Open Interest Shorts: | 19.8 | 64.6 | 13.6 |
| – Net Position: | -452,141 | 711,489 | -259,348 |
| – Gross Longs: | 308,793 | 3,194,985 | 261,858 |
| – Gross Shorts: | 760,934 | 2,483,496 | 521,206 |
| – Long to Short Ratio: | 0.4 to 1 | 1.3 to 1 | 0.5 to 1 |
| NET POSITION TREND: | |||
| – Strength Index Score (3 Year Range Pct): | 3.8 | 100.0 | 9.9 |
| – Strength Index Reading (3 Year Range): | Bearish-Extreme | Bullish-Extreme | Bearish-Extreme |
| NET POSITION MOVEMENT INDEX: | |||
| – 6-Week Change in Strength Index: | -54.7 | 37.7 | 0.4 |
10-Year Treasury Note Futures:
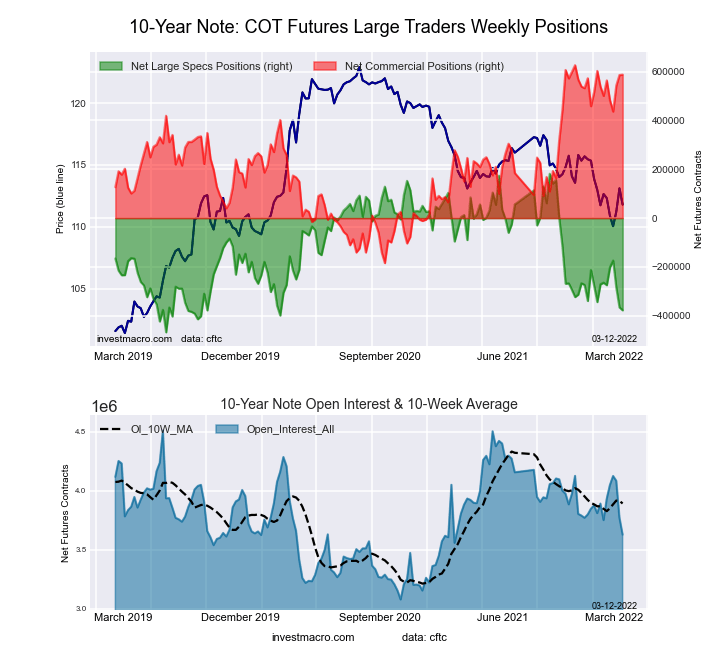 The 10-Year Treasury Note large speculator standing this week reached a net position of -377,720 contracts in the data reported through Tuesday. This was a weekly fall of -11,937 contracts from the previous week which had a total of -365,783 net contracts.
This week’s current strength score (the trader positioning range over the past three years, measured from 0 to 100) shows the speculators are currently Bearish-Extreme with a score of 13.9 percent. The commercials are Bullish-Extreme with a score of 95.2 percent and the small traders (not shown in chart) are Bearish with a score of 29.8 percent.
| 10-Year Treasury Note Statistics | SPECULATORS | COMMERCIALS | SMALL TRADERS |
| – Percent of Open Interest Longs: | 8.4 | 80.1 | 8.3 |
| – Percent of Open Interest Shorts: | 18.8 | 63.9 | 14.1 |
| – Net Position: | -377,720 | 587,471 | -209,751 |
| – Gross Longs: | 305,324 | 2,904,848 | 301,231 |
| – Gross Shorts: | 683,044 | 2,317,377 | 510,982 |
| – Long to Short Ratio: | 0.4 to 1 | 1.3 to 1 | 0.6 to 1 |
| NET POSITION TREND: | |||
| – Strength Index Score (3 Year Range Pct): | 13.9 | 95.2 | 29.8 |
| – Strength Index Reading (3 Year Range): | Bearish-Extreme | Bullish-Extreme | Bearish |
| NET POSITION MOVEMENT INDEX: | |||
| – 6-Week Change in Strength Index: | -17.4 | 10.7 | 6.1 |
Ultra 10-Year Notes Futures:
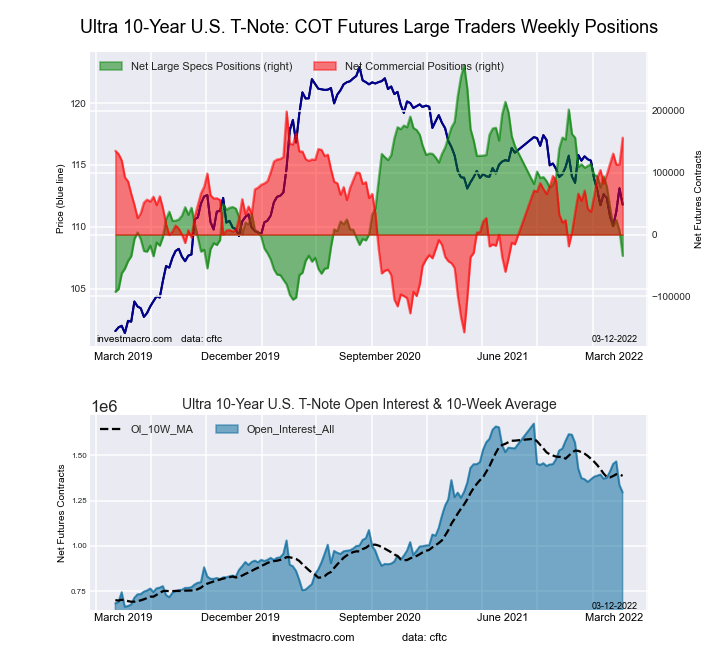 The Ultra 10-Year Notes large speculator standing this week reached a net position of -34,380 contracts in the data reported through Tuesday. This was a weekly fall of -40,563 contracts from the previous week which had a total of 6,183 net contracts.
This week’s current strength score (the trader positioning range over the past three years, measured from 0 to 100) shows the speculators are currently Bearish-Extreme with a score of 18.7 percent. The commercials are Bullish-Extreme with a score of 88.2 percent and the small traders (not shown in chart) are Bearish with a score of 41.9 percent.
| Ultra 10-Year Notes Statistics | SPECULATORS | COMMERCIALS | SMALL TRADERS |
| – Percent of Open Interest Longs: | 11.9 | 77.6 | 9.3 |
| – Percent of Open Interest Shorts: | 14.6 | 65.5 | 18.7 |
| – Net Position: | -34,380 | 156,564 | -122,184 |
| – Gross Longs: | 154,635 | 1,006,050 | 119,951 |
| – Gross Shorts: | 189,015 | 849,486 | 242,135 |
| – Long to Short Ratio: | 0.8 to 1 | 1.2 to 1 | 0.5 to 1 |
| NET POSITION TREND: | |||
| – Strength Index Score (3 Year Range Pct): | 18.7 | 88.2 | 41.9 |
| – Strength Index Reading (3 Year Range): | Bearish-Extreme | Bullish-Extreme | Bearish |
| NET POSITION MOVEMENT INDEX: | |||
| – 6-Week Change in Strength Index: | -34.0 | 20.8 | 32.7 |
US Treasury Bonds Futures:
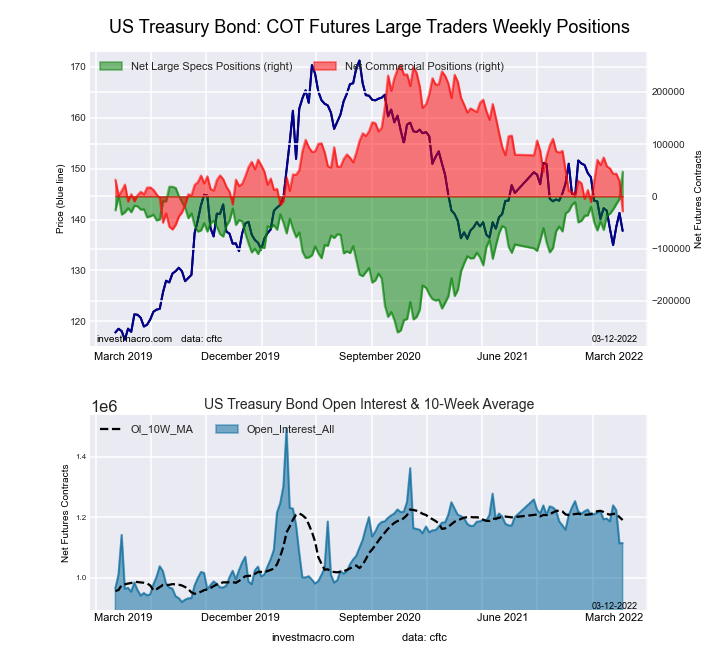 The US Treasury Bonds large speculator standing this week reached a net position of 47,368 contracts in the data reported through Tuesday. This was a weekly rise of 51,897 contracts from the previous week which had a total of -4,529 net contracts.
This week’s current strength score (the trader positioning range over the past three years, measured from 0 to 100) shows the speculators are currently Bullish-Extreme with a score of 100.0 percent. The commercials are Bearish-Extreme with a score of 11.0 percent and the small traders (not shown in chart) are Bearish with a score of 37.7 percent.
| US Treasury Bonds Statistics | SPECULATORS | COMMERCIALS | SMALL TRADERS |
| – Percent of Open Interest Longs: | 11.9 | 71.5 | 13.8 |
| – Percent of Open Interest Shorts: | 7.7 | 74.1 | 15.5 |
| – Net Position: | 47,368 | -28,607 | -18,761 |
| – Gross Longs: | 132,656 | 797,310 | 154,047 |
| – Gross Shorts: | 85,288 | 825,917 | 172,808 |
| – Long to Short Ratio: | 1.6 to 1 | 1.0 to 1 | 0.9 to 1 |
| NET POSITION TREND: | |||
| – Strength Index Score (3 Year Range Pct): | 100.0 | 11.0 | 37.7 |
| – Strength Index Reading (3 Year Range): | Bullish-Extreme | Bearish-Extreme | Bearish |
| NET POSITION MOVEMENT INDEX: | |||
| – 6-Week Change in Strength Index: | 36.3 | -32.8 | -6.8 |
Ultra US Treasury Bonds Futures:
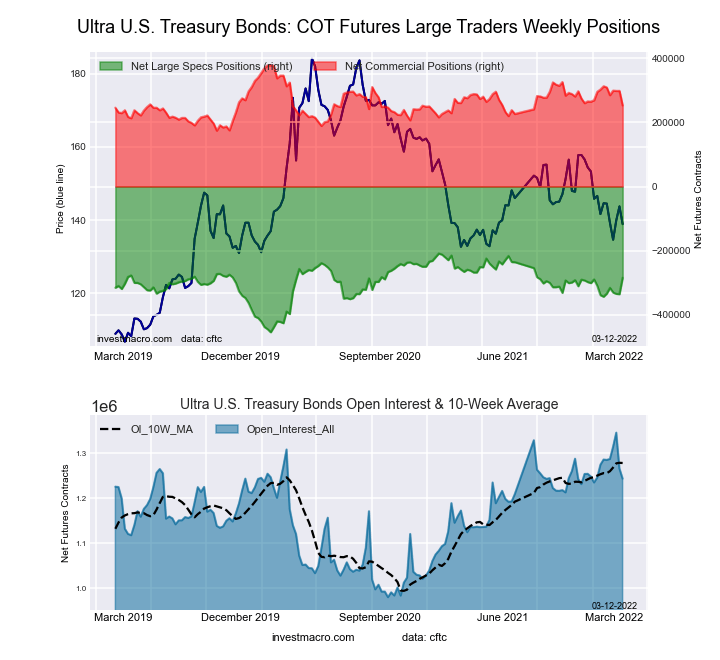 The Ultra US Treasury Bonds large speculator standing this week reached a net position of -284,418 contracts in the data reported through Tuesday. This was a weekly lift of 50,843 contracts from the previous week which had a total of -335,261 net contracts.
This week’s current strength score (the trader positioning range over the past three years, measured from 0 to 100) shows the speculators are currently Bullish with a score of 69.2 percent. The commercials are Bearish with a score of 38.5 percent and the small traders (not shown in chart) are Bullish with a score of 51.2 percent.
| Ultra US Treasury Bonds Statistics | SPECULATORS | COMMERCIALS | SMALL TRADERS |
| – Percent of Open Interest Longs: | 6.7 | 80.8 | 11.8 |
| – Percent of Open Interest Shorts: | 29.6 | 60.5 | 9.3 |
| – Net Position: | -284,418 | 252,520 | 31,898 |
| – Gross Longs: | 83,173 | 1,004,968 | 147,181 |
| – Gross Shorts: | 367,591 | 752,448 | 115,283 |
| – Long to Short Ratio: | 0.2 to 1 | 1.3 to 1 | 1.3 to 1 |
| NET POSITION TREND: | |||
| – Strength Index Score (3 Year Range Pct): | 69.2 | 38.5 | 51.2 |
| – Strength Index Reading (3 Year Range): | Bullish | Bearish | Bullish |
| NET POSITION MOVEMENT INDEX: | |||
| – 6-Week Change in Strength Index: | 24.0 | -29.3 | 0.7 |
Article By InvestMacro – Receive our weekly COT Reports by Email
*COT Report: The COT data, released weekly to the public each Friday, is updated through the most recent Tuesday (data is 3 days old) and shows a quick view of how large speculators or non-commercials (for-profit traders) were positioned in the futures markets.
The CFTC categorizes trader positions according to commercial hedgers (traders who use futures contracts for hedging as part of the business), non-commercials (large traders who speculate to realize trading profits) and nonreportable traders (usually small traders/speculators) as well as their open interest (contracts open in the market at time of reporting).See CFTC criteria here.

- The US introduces new import tariffs for 60 countries. Brent crude surpasses $100 per barrel Jul 24, 2026
- USD/JPY Breaks Records: Nothing Slows the Yen’s Decline Jul 24, 2026
- Oil prices reached a 6‑week high. The AUD strengthened on the back of a strong labor‑market report Jul 23, 2026
- EUR/USD Recovers as Dollar Weakens Jul 23, 2026
- Bitcoin rose to $66,000. The New Zealand dollar continues to strengthen Jul 22, 2026
- Inflationary pressure is easing in Canada. In New Zealand, on the contrary, inflation is rising Jul 21, 2026
- GBP/USD Falls After Cabinet Changes Jul 21, 2026
- Geopolitical and macroeconomic conditions continue to pressure market sentiment Jul 20, 2026
- USD/JPY Poised to Continue Gains as Expensive Oil and Lack of Support Weigh on Yen Jul 20, 2026
- COT Metals Charts: Weekly Speculator Bets led by Copper & Steel Jul 18, 2026