
By InvestMacro

Here are the latest charts and statistics for the Commitment of Traders (COT) reports data published by the Commodities Futures Trading Commission (CFTC).
The latest COT data is updated through Tuesday May 23rd and shows a quick view of how large traders (for-profit speculators and commercial hedgers) were positioned in the futures markets.
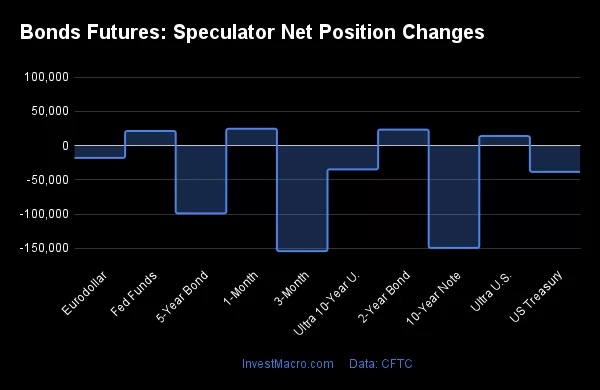
Weekly Speculator Changes led by SOFR 3-Months & Ultra 10-Year Bonds
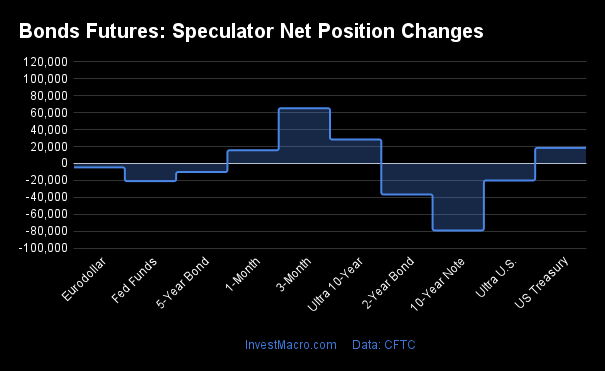
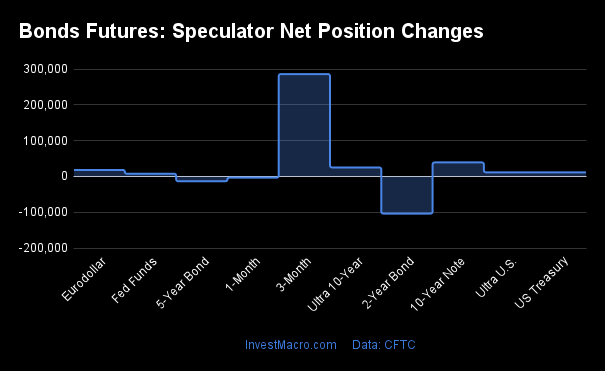
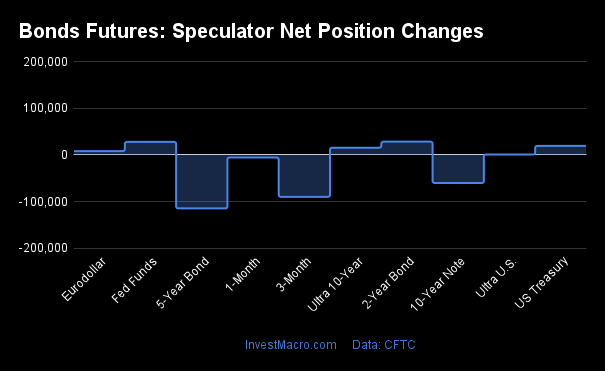
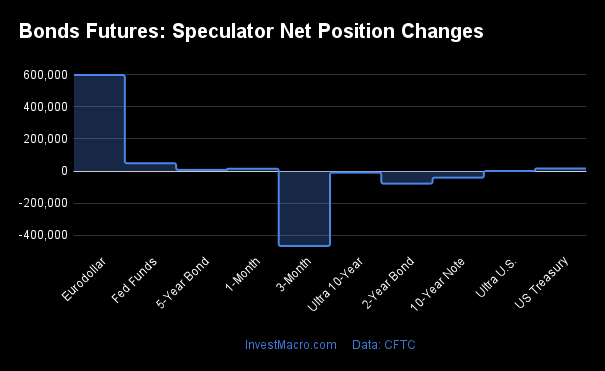
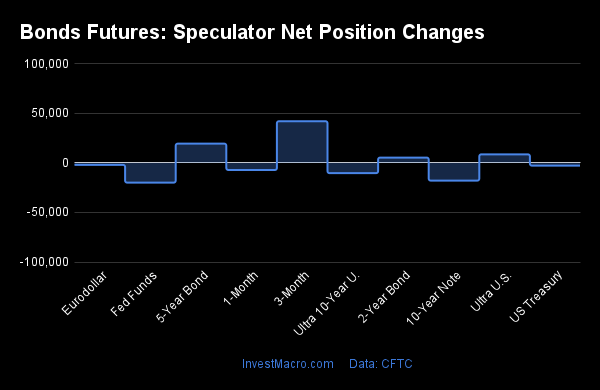
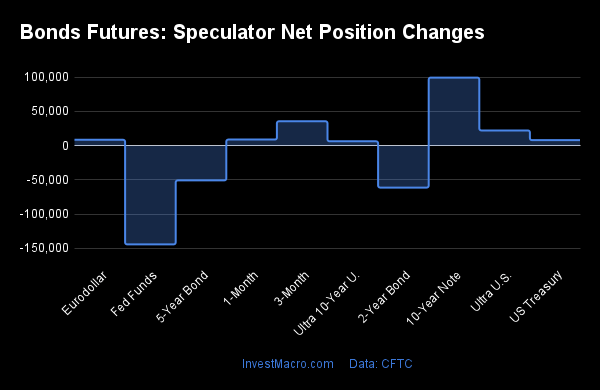
The COT bond market speculator bets were lower this week as three out of the nine bond markets we cover had higher positioning while the other six markets had lower speculator contracts.
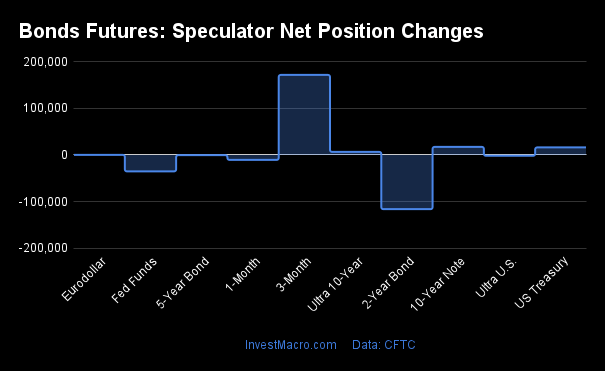
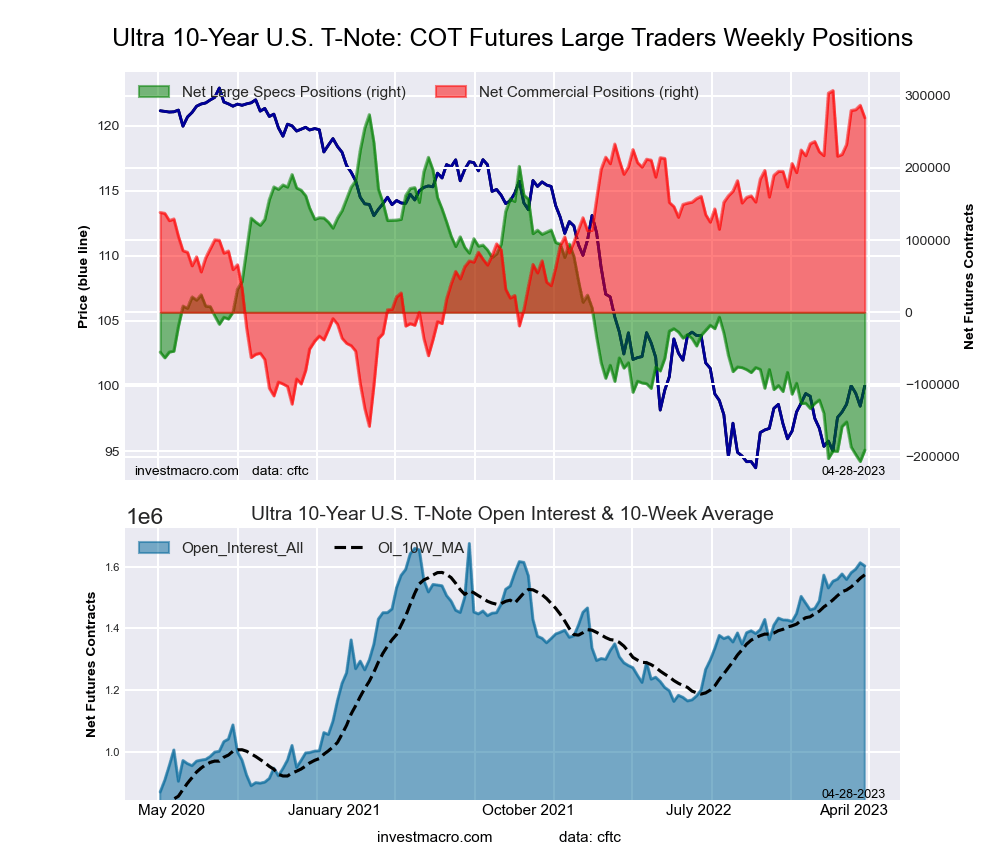
Leading the gains for the bond markets was the SOFR 3-Months (65,278 contracts) with the Ultra 10-Year Bonds (28,348 contracts) and the US Treasury Bonds (18,345 contracts) also showing positive weeks.
The bond markets with declines in speculator bets for the week were the 10-Year Bonds (-79,196 contracts), the 2-Year Bonds (-36,627 contracts), the Fed Funds (-20,924 contracts), the Ultra Treasury Bonds (-20,128 contracts), the 5-Year Bonds (-10,156 contracts) and the Eurodollar (-4,665 contracts) also registering lower bets on the week.
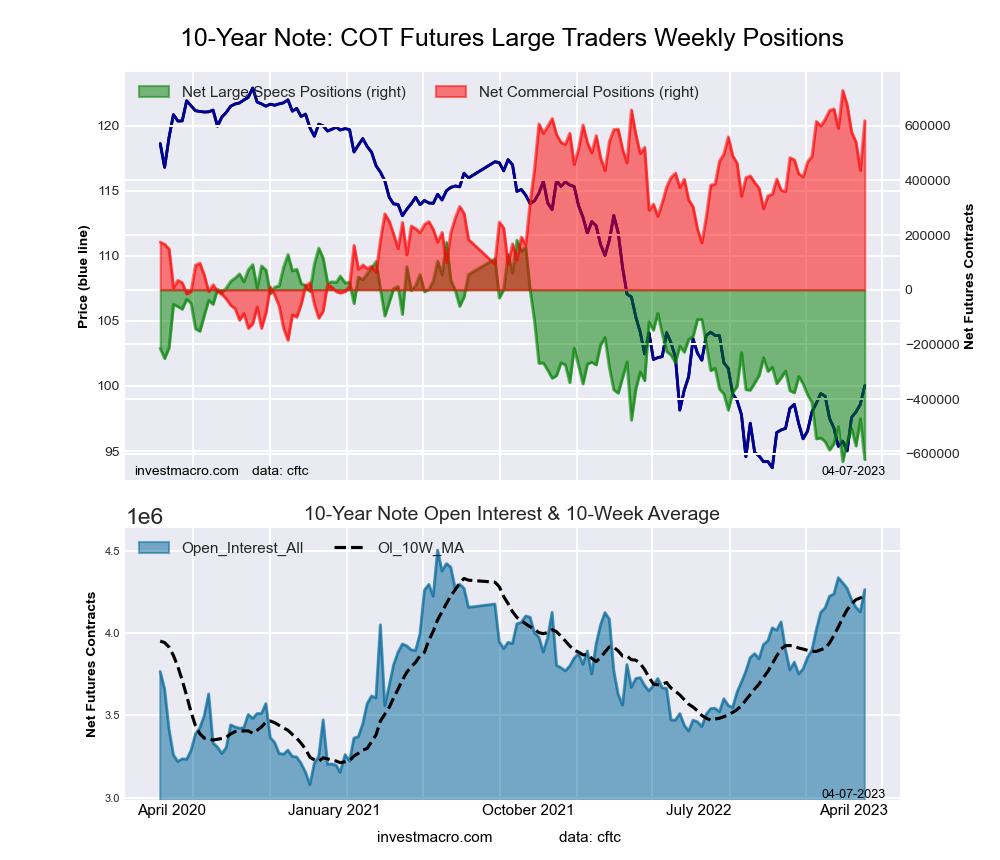
10-Year Bonds Speculator bets hit lowest level on record
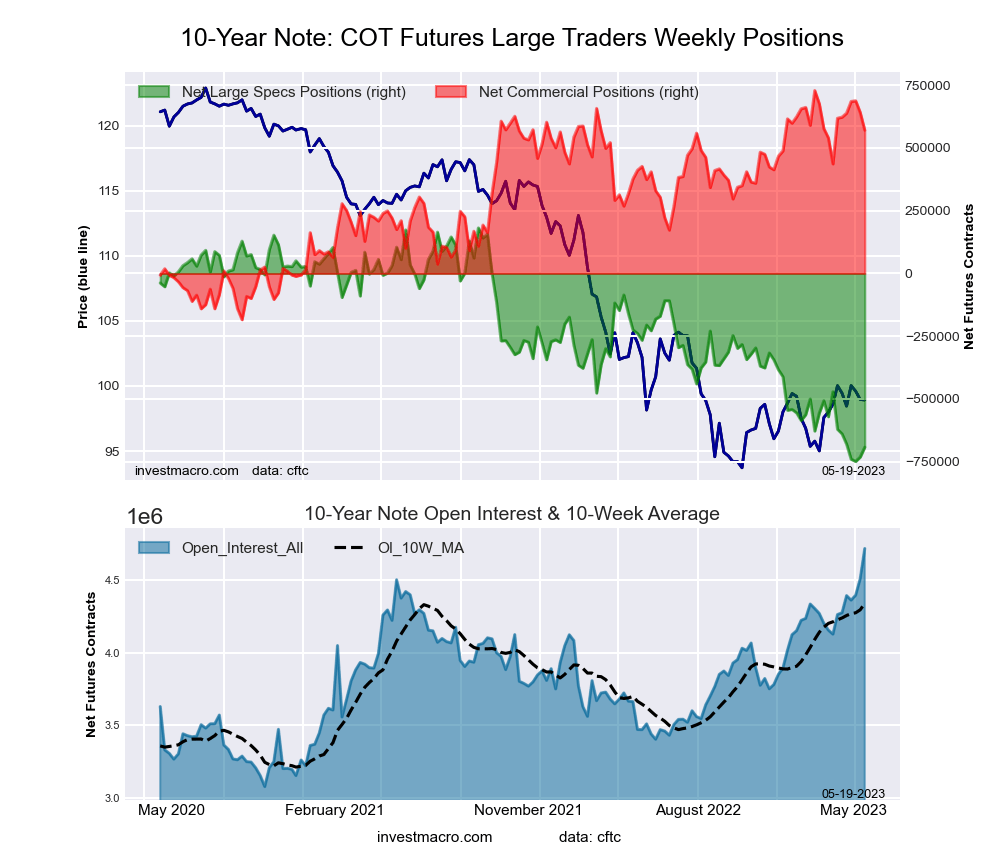
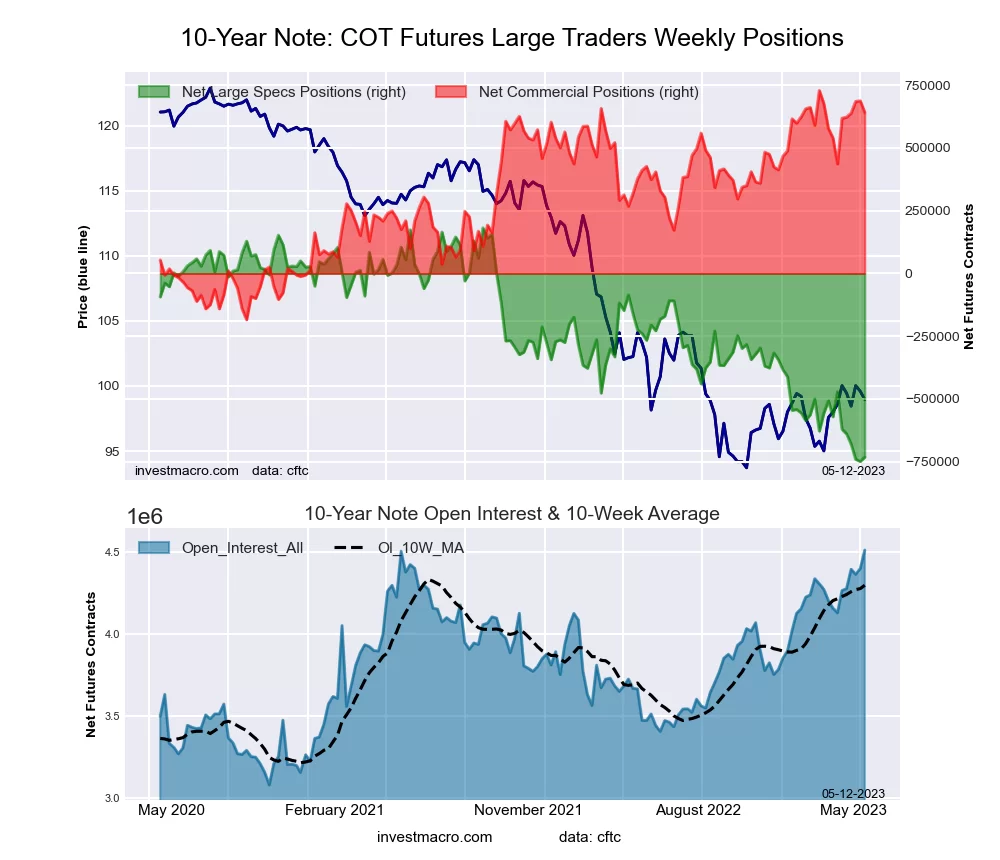
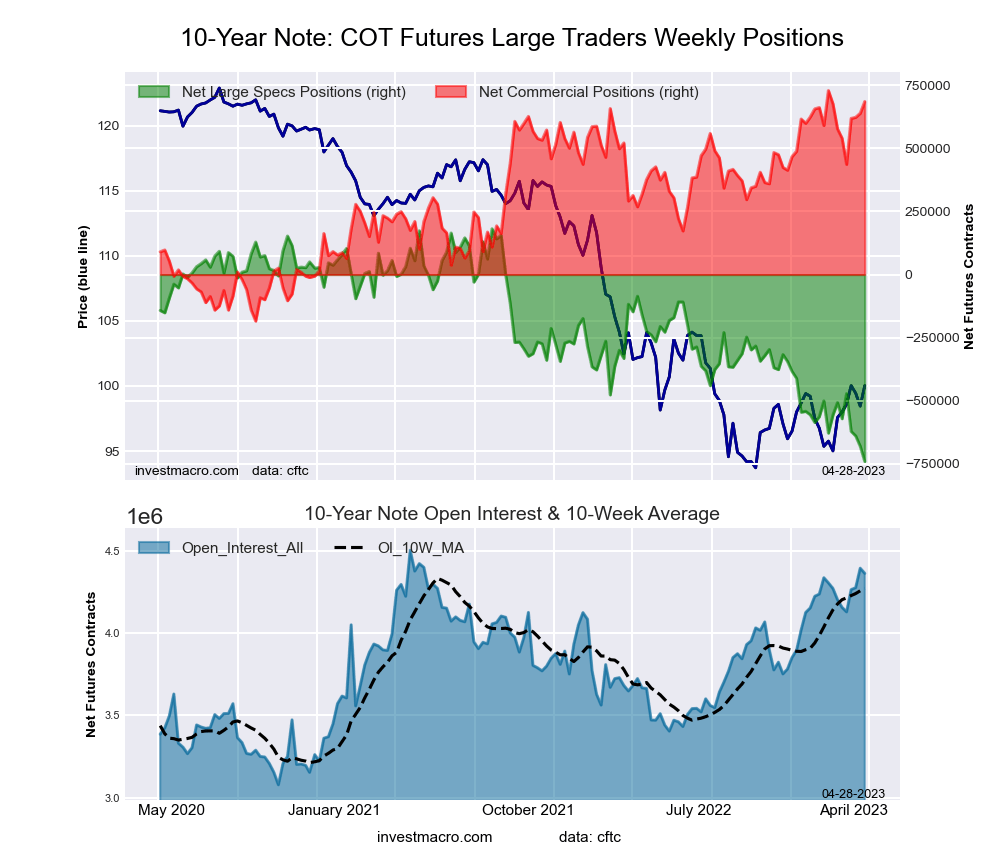
Highlighting the COT bond’s data this week is the record weakness in the 10-Year Treasury Bond contracts. The 10-Year Bond contract dropped this week by -79,196 contracts and fell for the sixth time out of the past eight weeks which has added a total of -300,060 contracts to the bearish level.
This weakness has pushed the 10-Year speculative positions to hit their most bearish level on record this week at a total of -771,638 contracts, according to CFTC data that stretches back to 1986. This eclipses the previous record of -756,316 contracts that was reached on September of 2018.
The 10-Year now joins both the 2-Year and 5-Year Treasury Bonds with current record low levels in speculator positions.
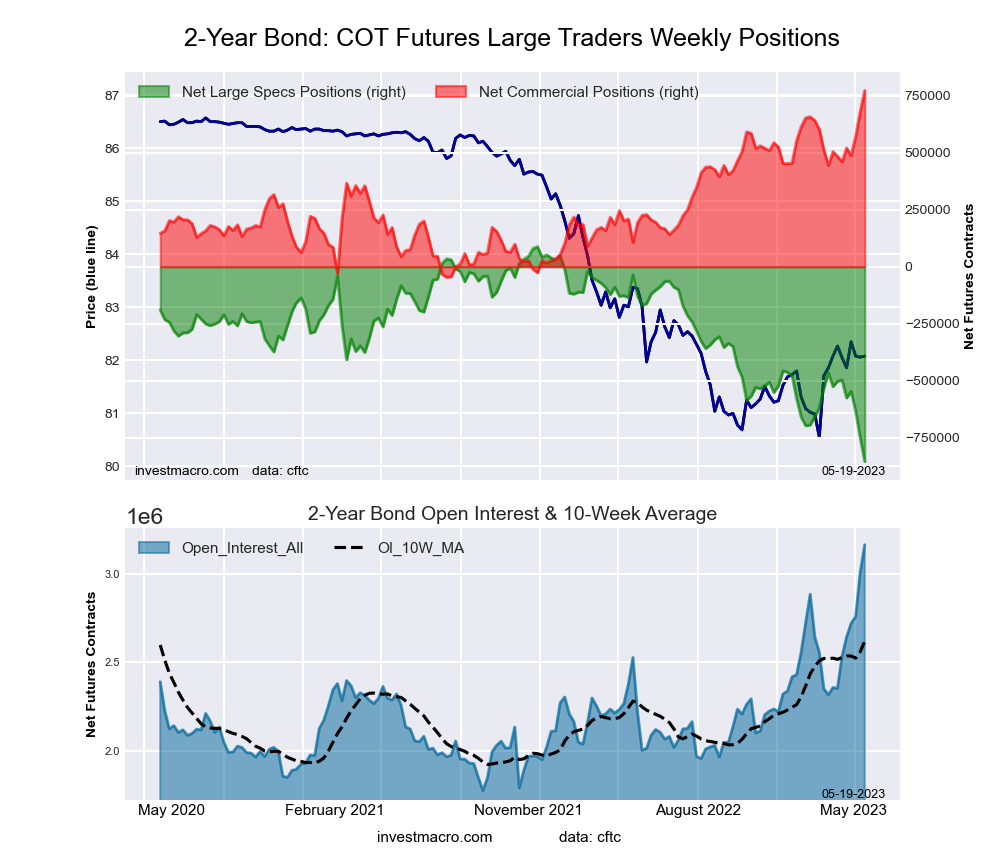
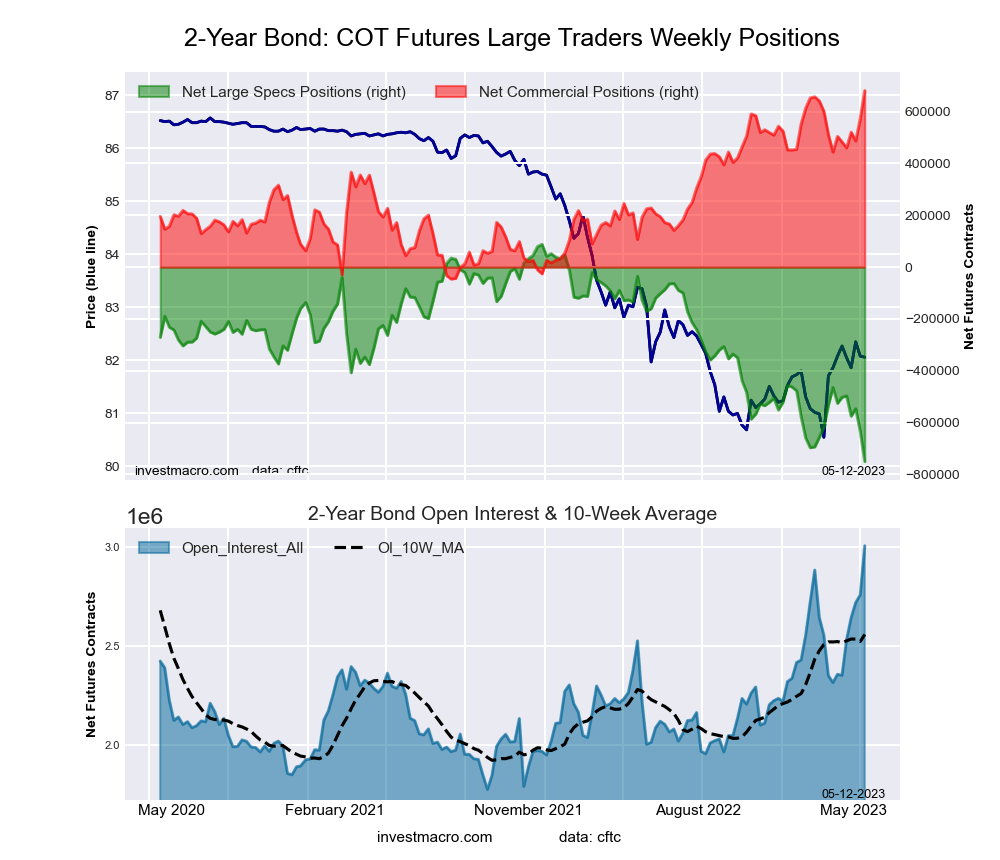
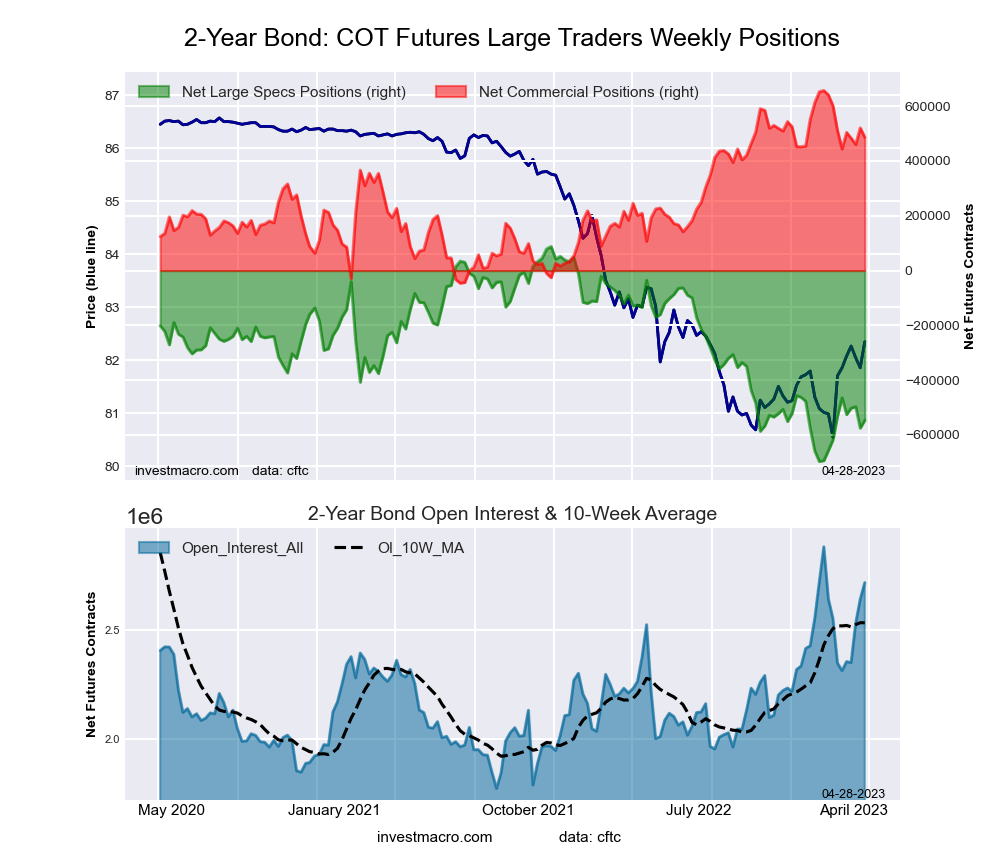
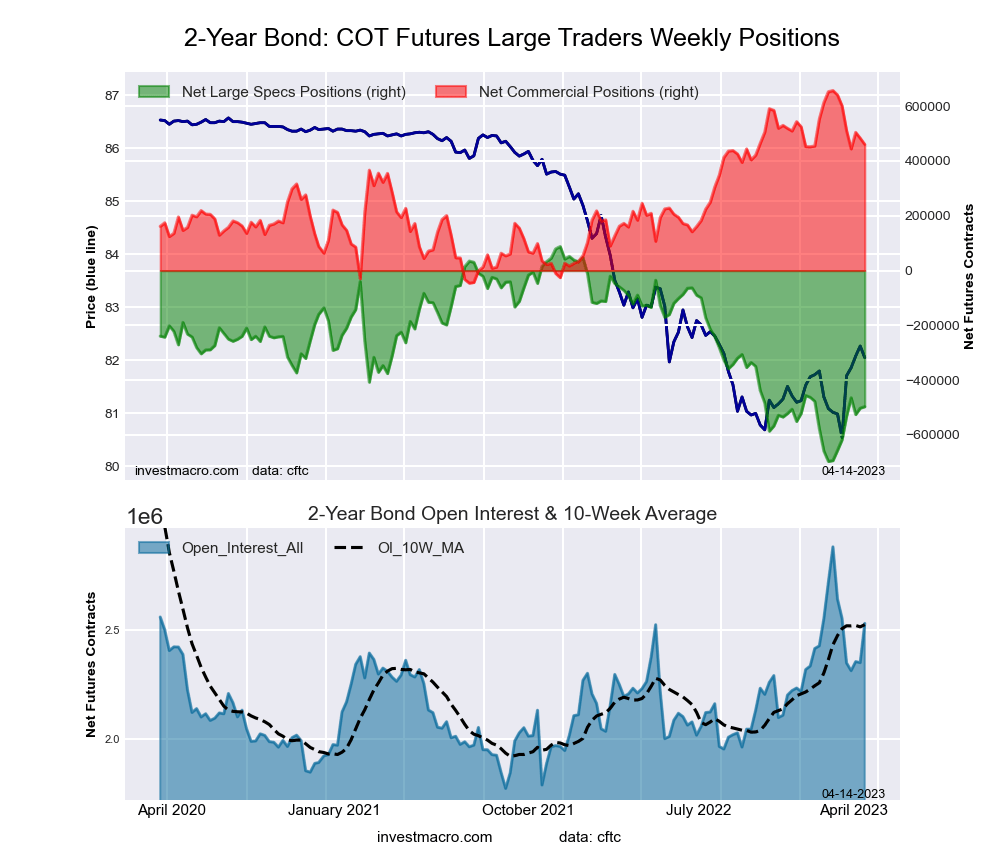
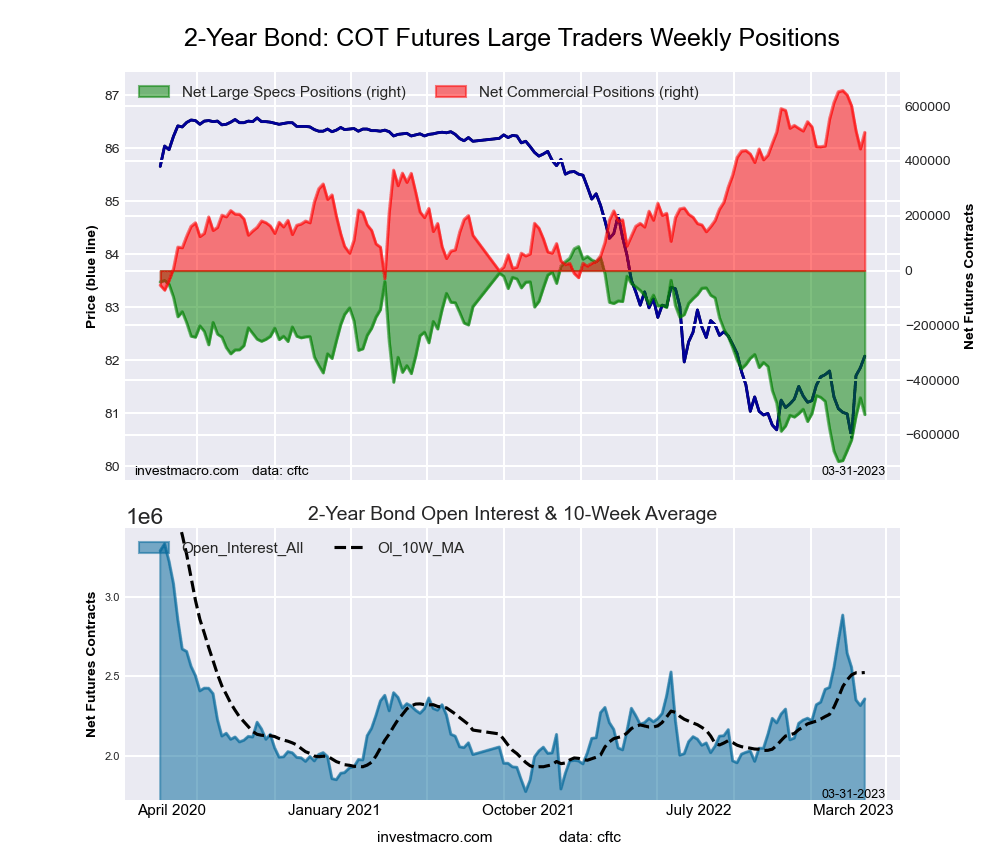
The 2-Year speculator positions fell again this week for the fourth straight week and has a new record low level position at -890,202 contracts. The 2-Year speculators have added a total of -343,895 contracts to the bearish standing in just the past four weeks.
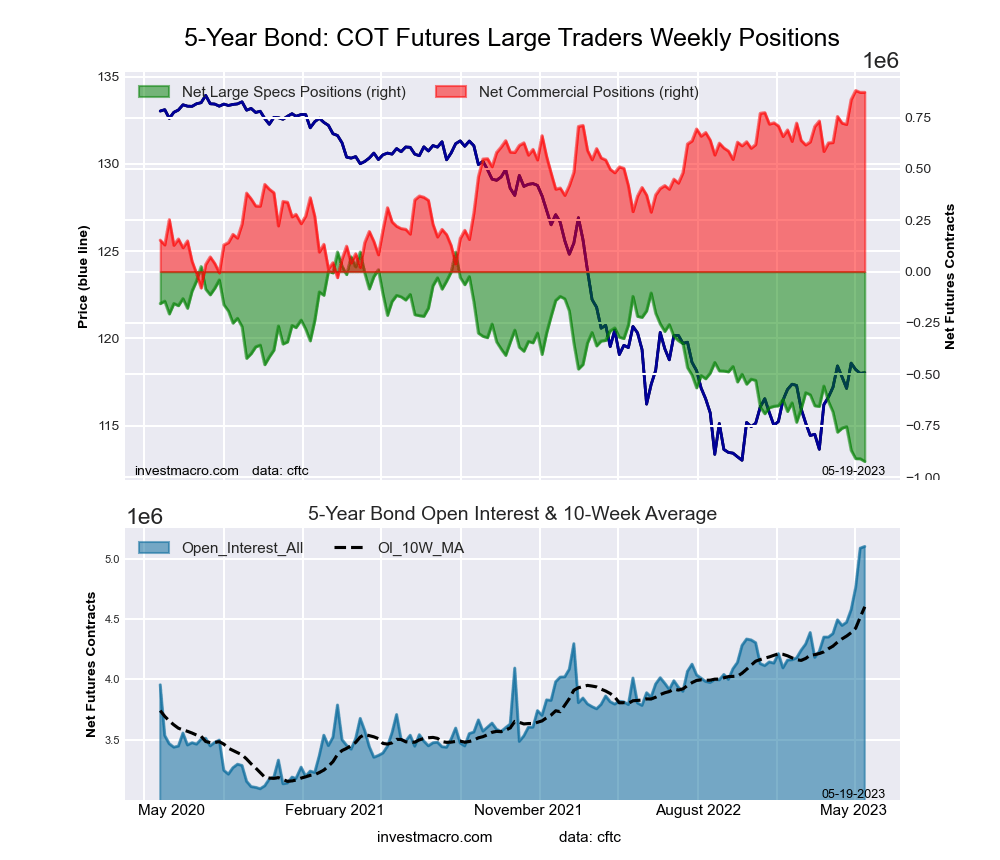
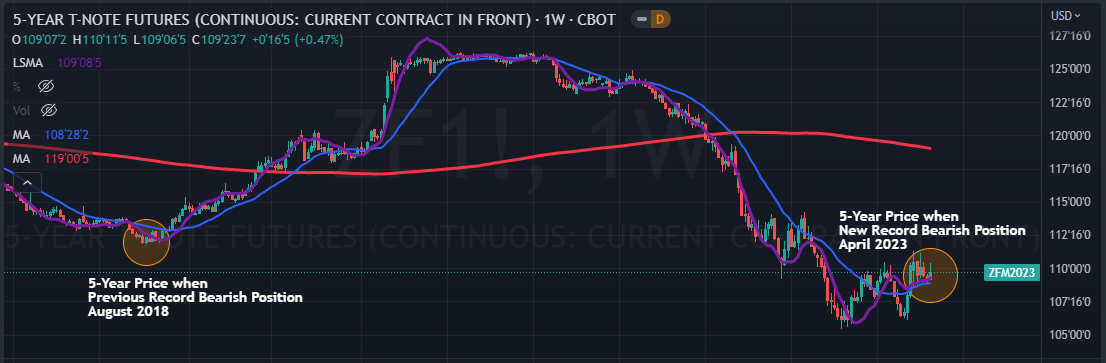
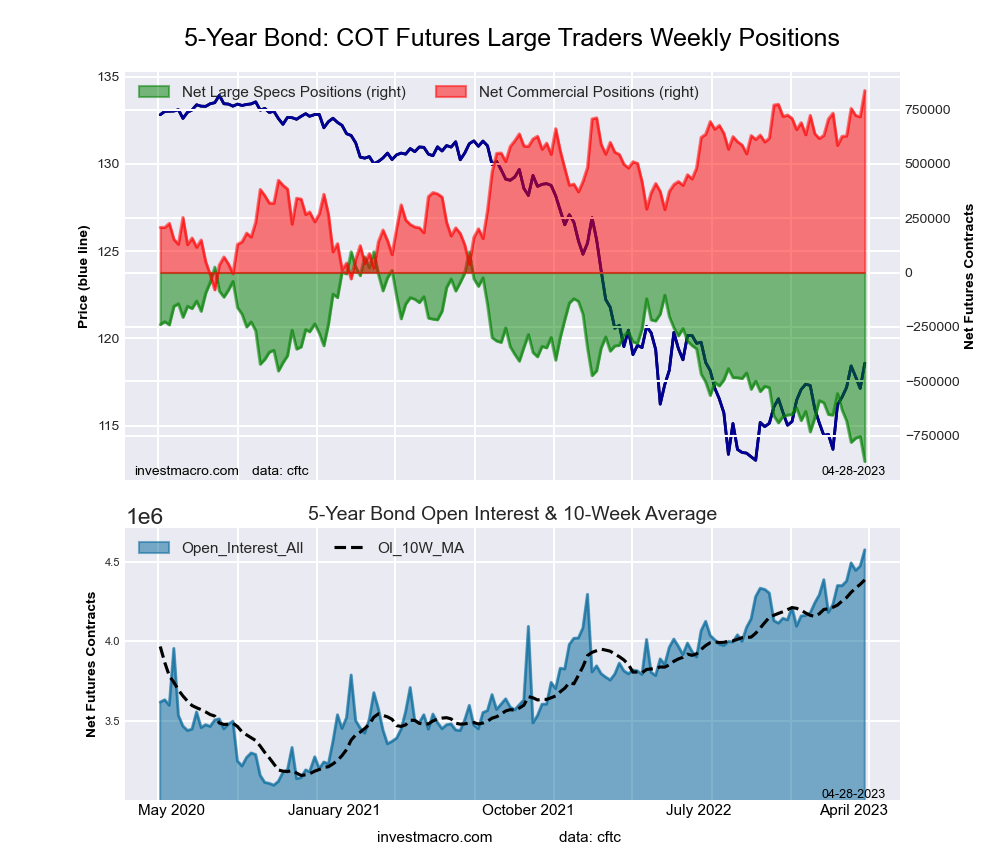
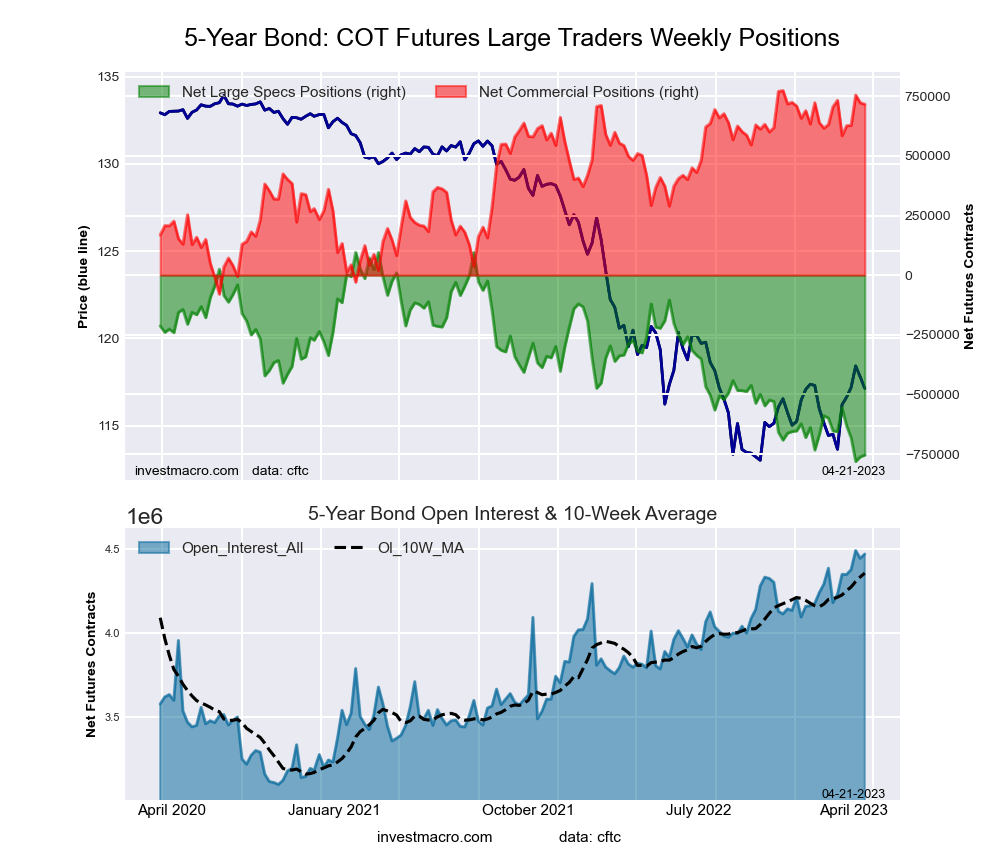
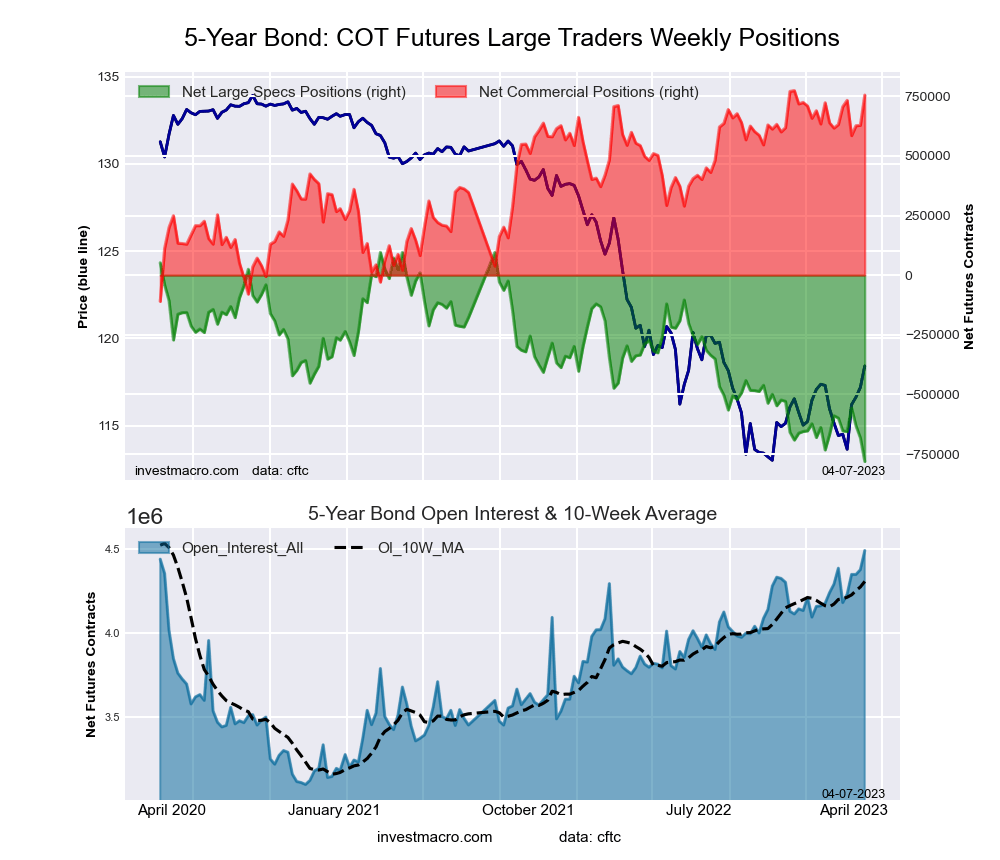
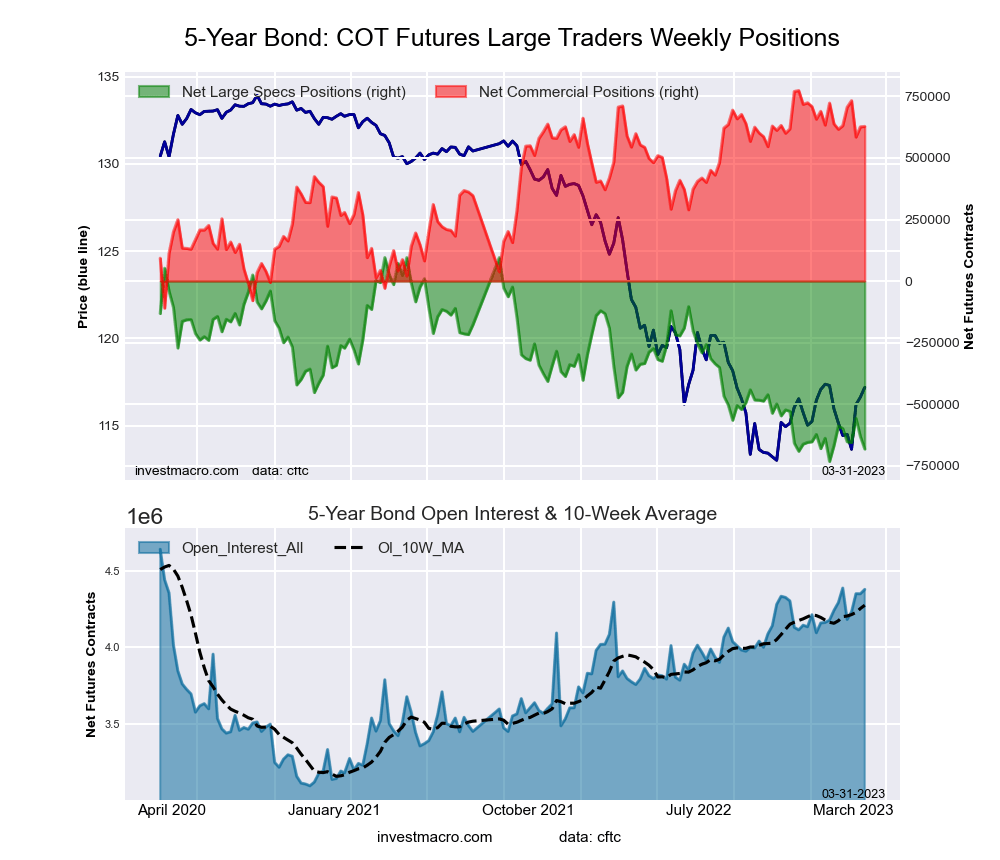
Meanwhile, the 5-Year speculator positioning dropped again for the fifth consecutive week and hit a new record bearish position of -934,069 contracts. A total of-179,567 contracts has been added to the bearish position in the past five weeks.
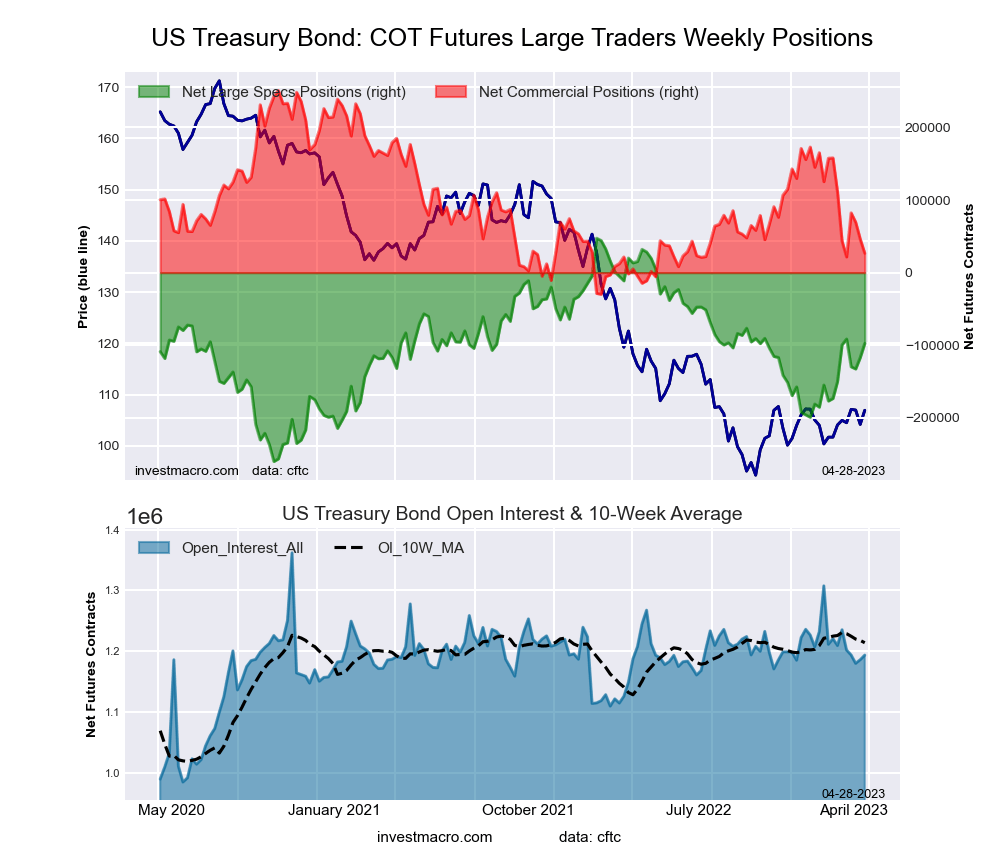
The 10-Year futures price is back on the downtrend over the past three weeks after rising to touch a 7-month high in March. The futures price closed this week at 112.13 which still remains about 3.30 percent above the most recent low-point (and approximately 15-year low) that was hit in October.
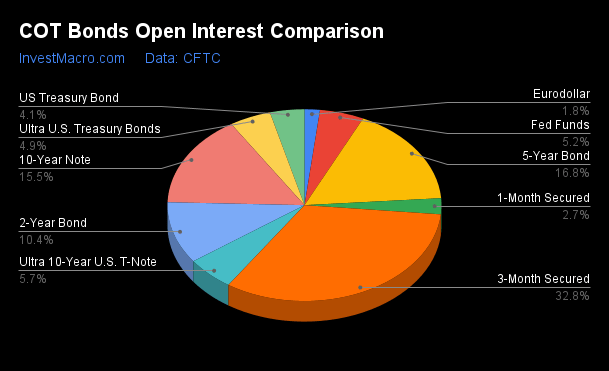
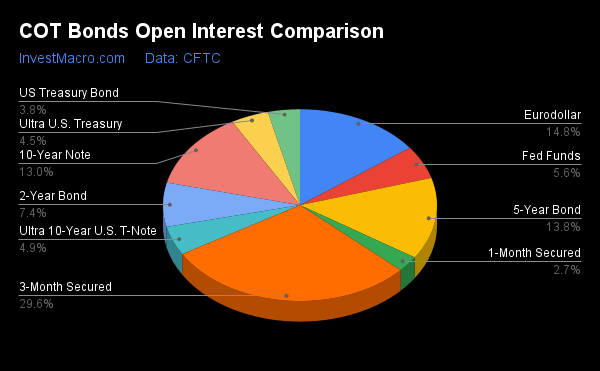
| May-23-2023 | OI | OI-Index | Spec-Net | Spec-Index | Com-Net | COM-Index | Smalls-Net | Smalls-Index |
|---|---|---|---|---|---|---|---|---|
| Eurodollar | 556,278 | 0 | -41,549 | 73 | 43,737 | 23 | -2,188 | 99 |
| FedFunds | 1,735,674 | 66 | -88,495 | 29 | 107,292 | 73 | -18,797 | 54 |
| 2-Year | 3,266,610 | 100 | -890,202 | 0 | 800,371 | 100 | 89,831 | 99 |
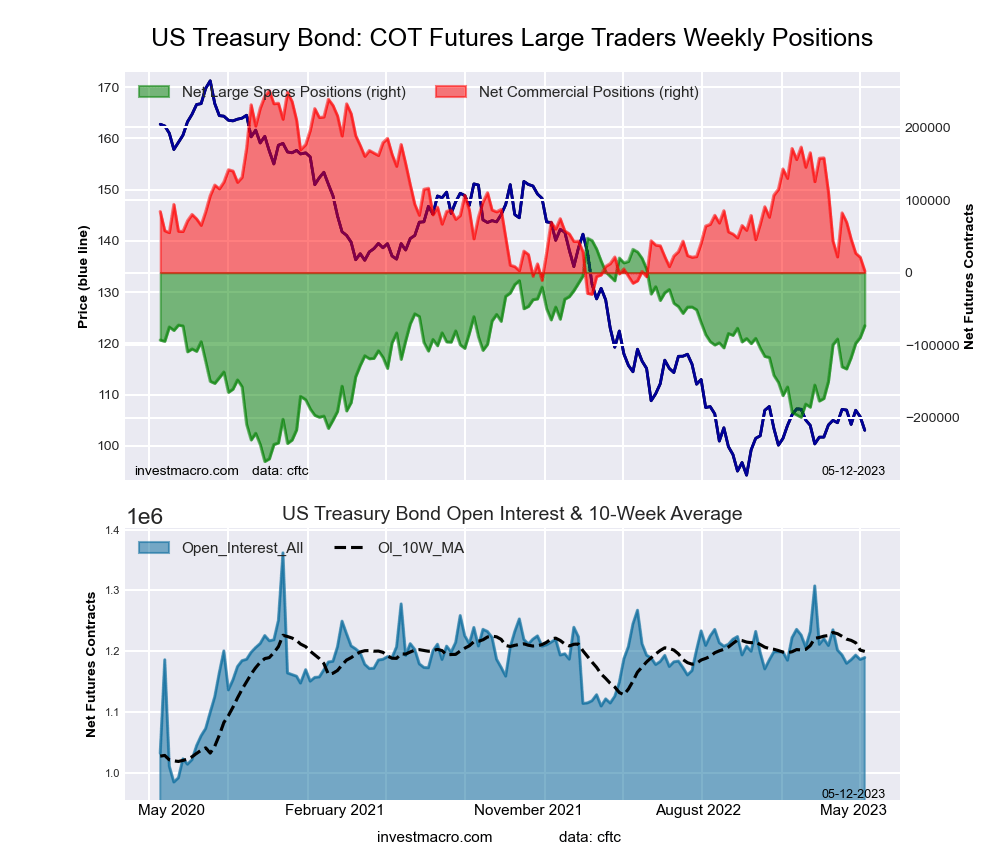
| Long T-Bond | 1,299,274 | 83 | -43,236 | 71 | 3,696 | 12 | 39,540 | 77 |
| 10-Year | 4,902,288 | 100 | -771,638 | 0 | 682,402 | 95 | 89,236 | 93 |
| 5-Year | 5,105,531 | 100 | -934,069 | 0 | 882,607 | 100 | 51,462 | 95 |
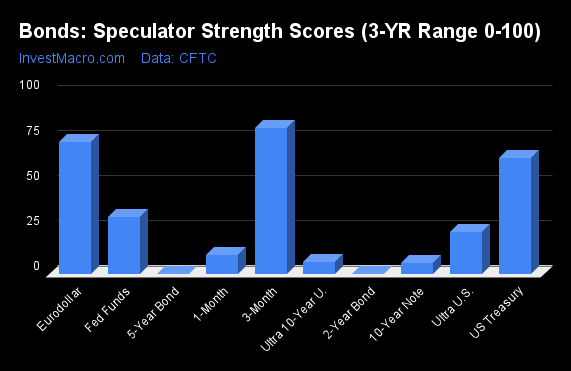
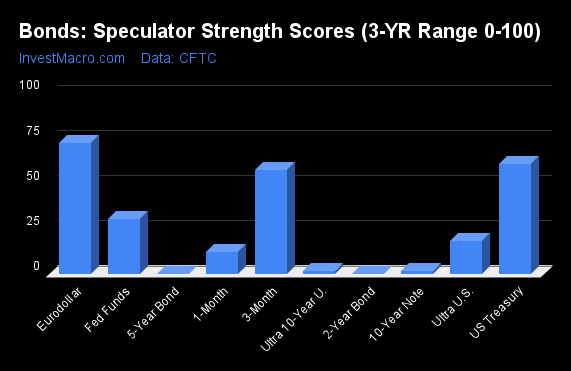
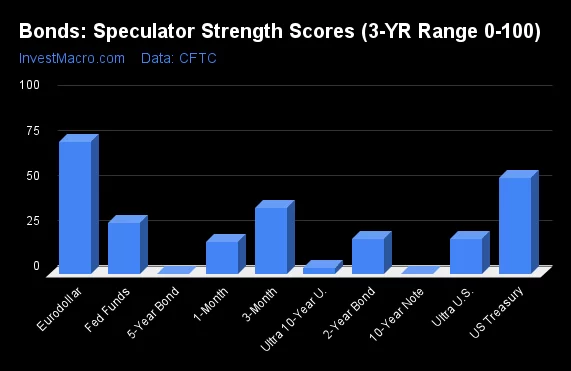
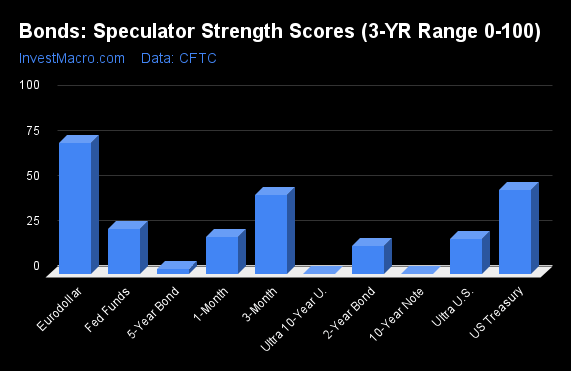
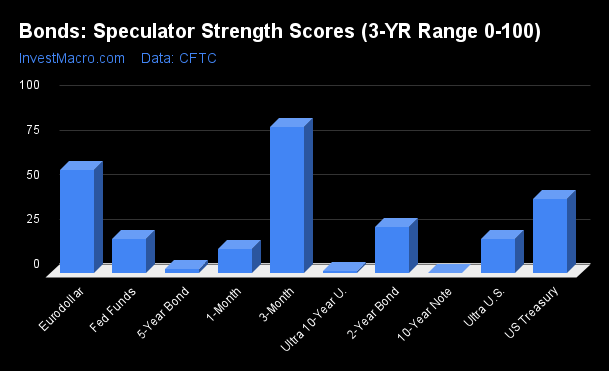
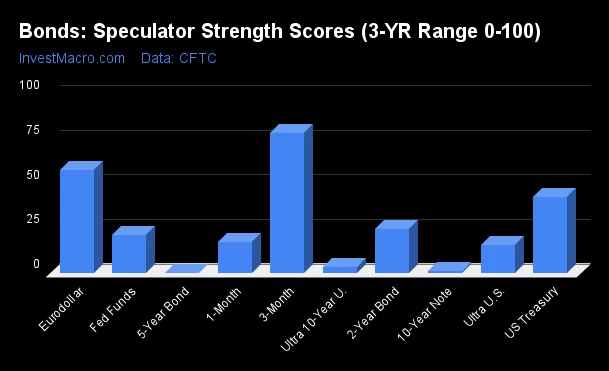
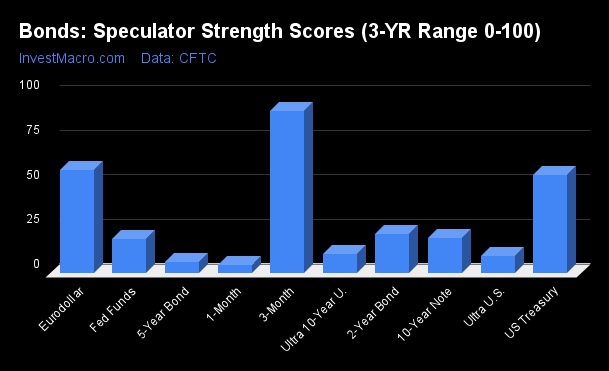
Strength Scores led by SOFR 3-Months & Eurodollar
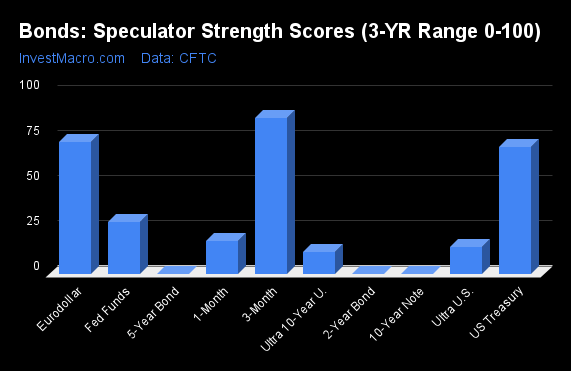
COT Strength Scores (a normalized measure of Speculator positions over a 3-Year range, from 0 to 100 where above 80 is Extreme-Bullish and below 20 is Extreme-Bearish) showed that the SOFR 3-Months (86 percent) and the Eurodollar (73 percent) lead the bond markets this week. The US Treasury Bonds (71 percent) comes in as the next highest in the weekly strength scores.
On the downside, the 5-Year Bonds (0 percent), the 10-Year Bonds (0 percent), the 2-Year Bonds (0 percent) and the Ultra 10-Year Bonds (12 percent) come in at the lowest strength level currently and are in Extreme-Bearish territory (below 20 percent).
Strength Statistics:
Fed Funds (28.8 percent) vs Fed Funds previous week (31.4 percent)
2-Year Bond (0.0 percent) vs 2-Year Bond previous week (3.7 percent)
5-Year Bond (0.0 percent) vs 5-Year Bond previous week (1.0 percent)
10-Year Bond (0.0 percent) vs 10-Year Bond previous week (8.3 percent)
Ultra 10-Year Bond (12.2 percent) vs Ultra 10-Year Bond previous week (6.5 percent)
US Treasury Bond (70.5 percent) vs US Treasury Bond previous week (64.5 percent)
Ultra US Treasury Bond (14.8 percent) vs Ultra US Treasury Bond previous week (23.4 percent)
Eurodollar (73.0 percent) vs Eurodollar previous week (73.1 percent)
SOFR 3-Months (86.3 percent) vs SOFR 3-Months previous week (81.0 percent)
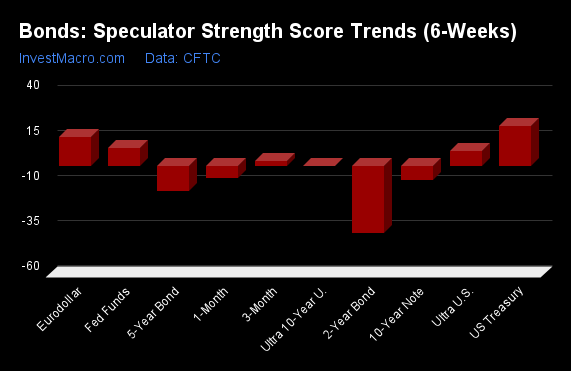
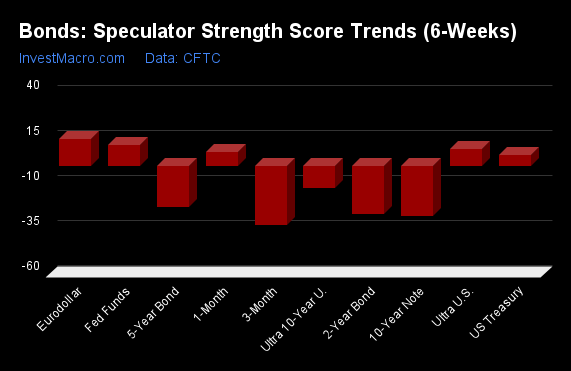
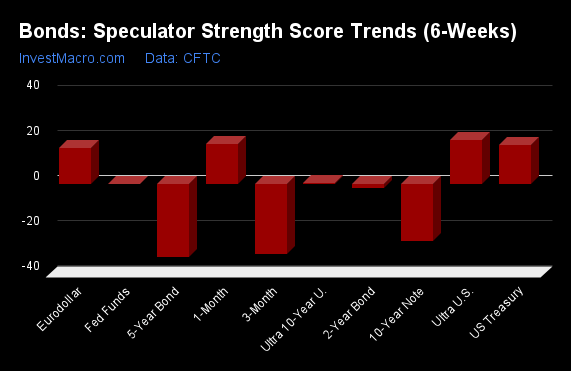
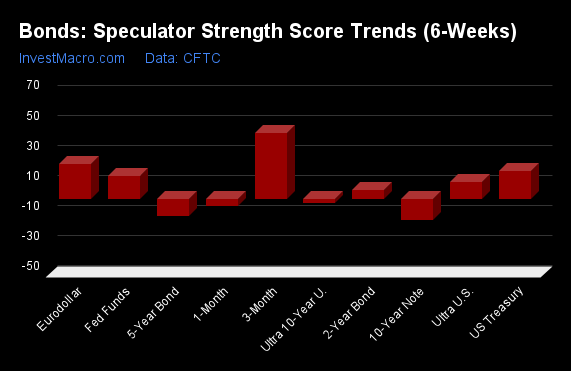
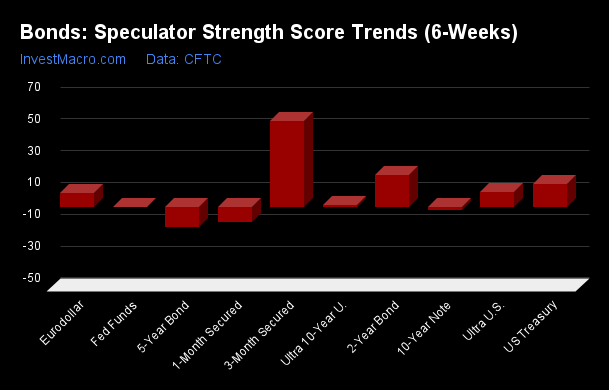
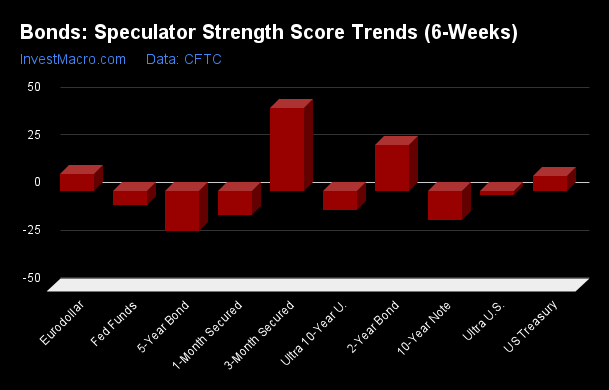
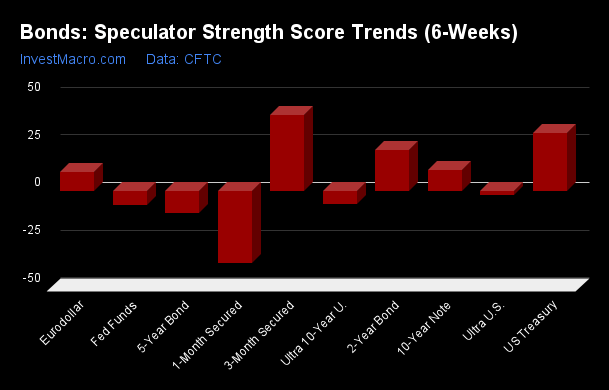
US Treasury Bonds & Eurodollar top the 6-Week Strength Trends
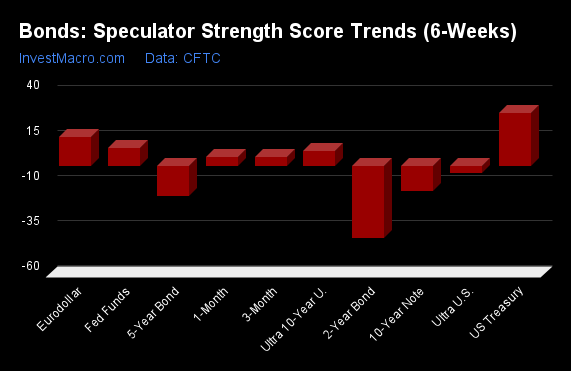
COT Strength Score Trends (or move index, calculates the 6-week changes in strength scores) showed that the US Treasury Bonds (29 percent) and the Eurodollar (16 percent) lead the past six weeks trends for bonds.
The 2-Year Bonds (-40 percent) and the 5-Year Bonds (-17 percent) lead the downside trend scores currently with the 10-Year Bonds (-14 percent) and the Ultra Treasury Bonds (-4 percent) following next with lower trend scores.
Strength Trend Statistics:
Fed Funds (9.8 percent) vs Fed Funds previous week (9.9 percent)
2-Year Bond (-40.2 percent) vs 2-Year Bond previous week (-35.9 percent)
5-Year Bond (-16.7 percent) vs 5-Year Bond previous week (-13.9 percent)
10-Year Bond (-13.9 percent) vs 10-Year Bond previous week (-7.5 percent)
Ultra 10-Year Bond (7.9 percent) vs Ultra 10-Year Bond previous week (0.0 percent)
US Treasury Bond (29.1 percent) vs US Treasury Bond previous week (22.1 percent)
Ultra US Treasury Bond (-4.2 percent) vs Ultra US Treasury Bond previous week (8.0 percent)
Eurodollar (15.6 percent) vs Eurodollar previous week (15.7 percent)
SOFR 3-Months (4.7 percent) vs SOFR 3-Months previous week (2.8 percent)
Individual Bond Markets:
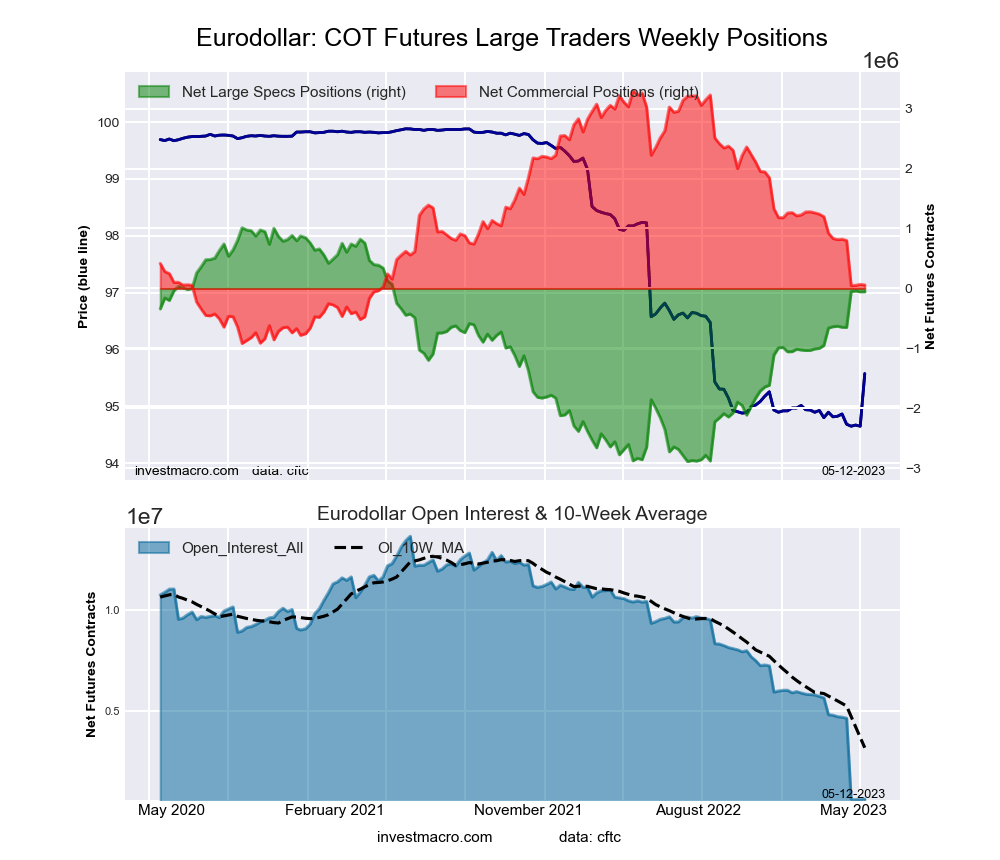
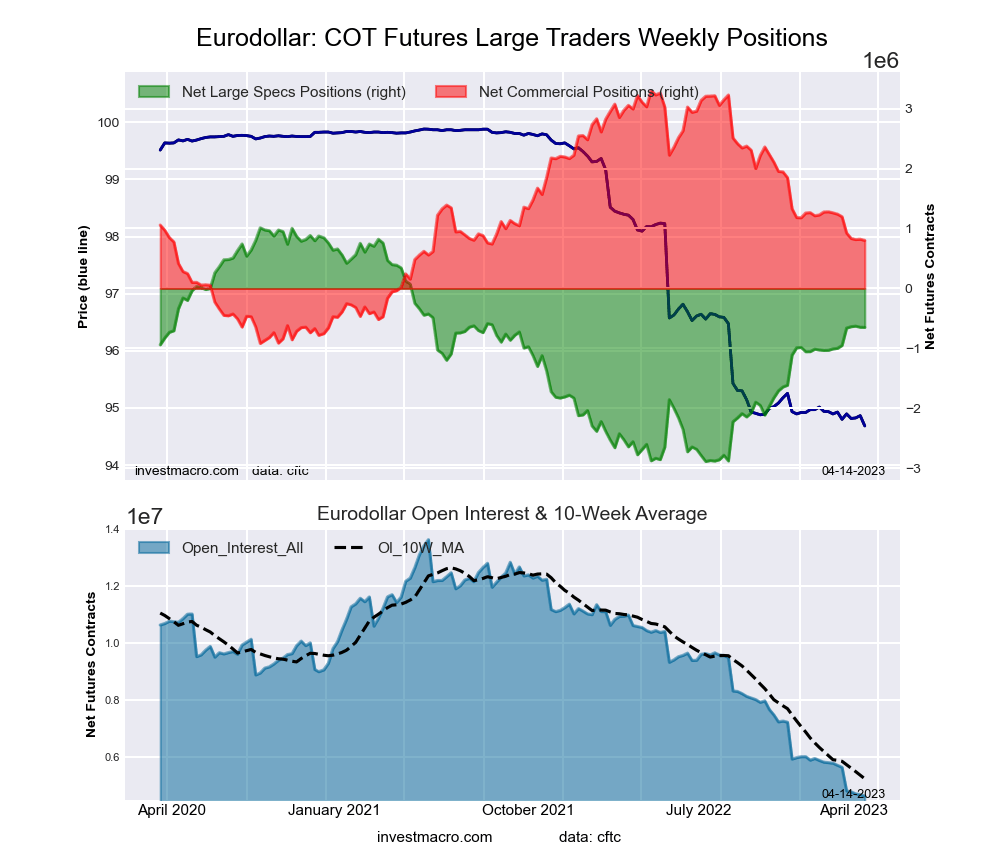
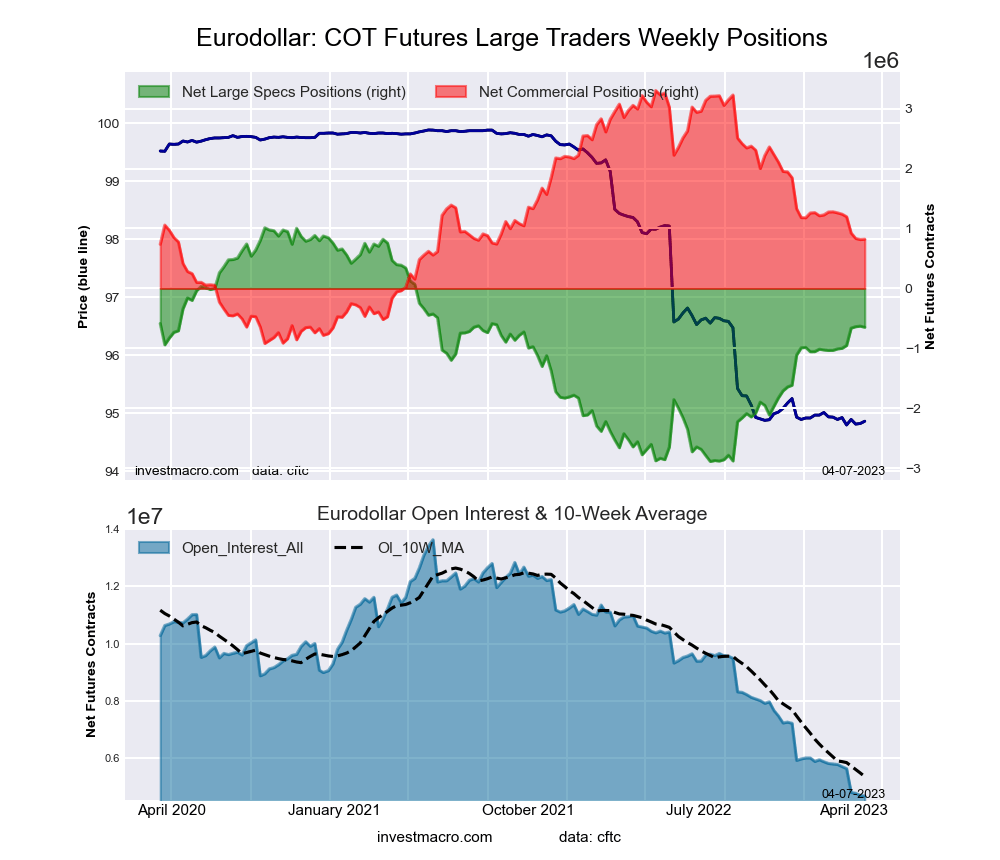
3-Month Eurodollars Futures:
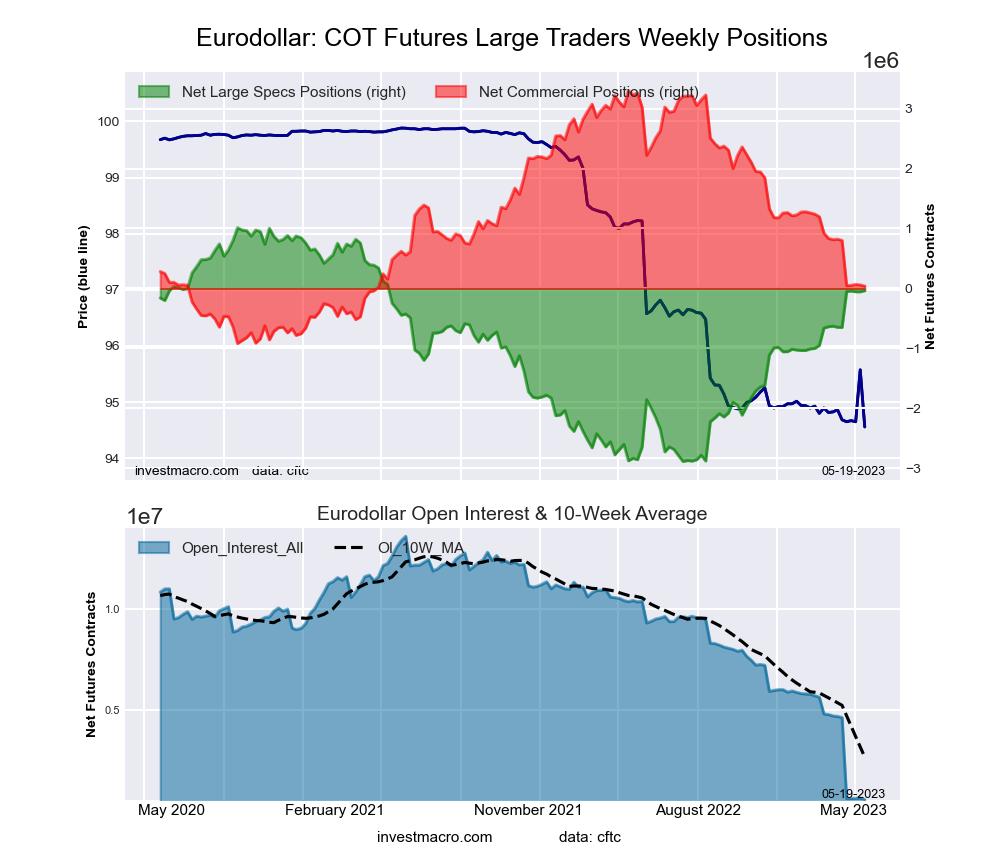
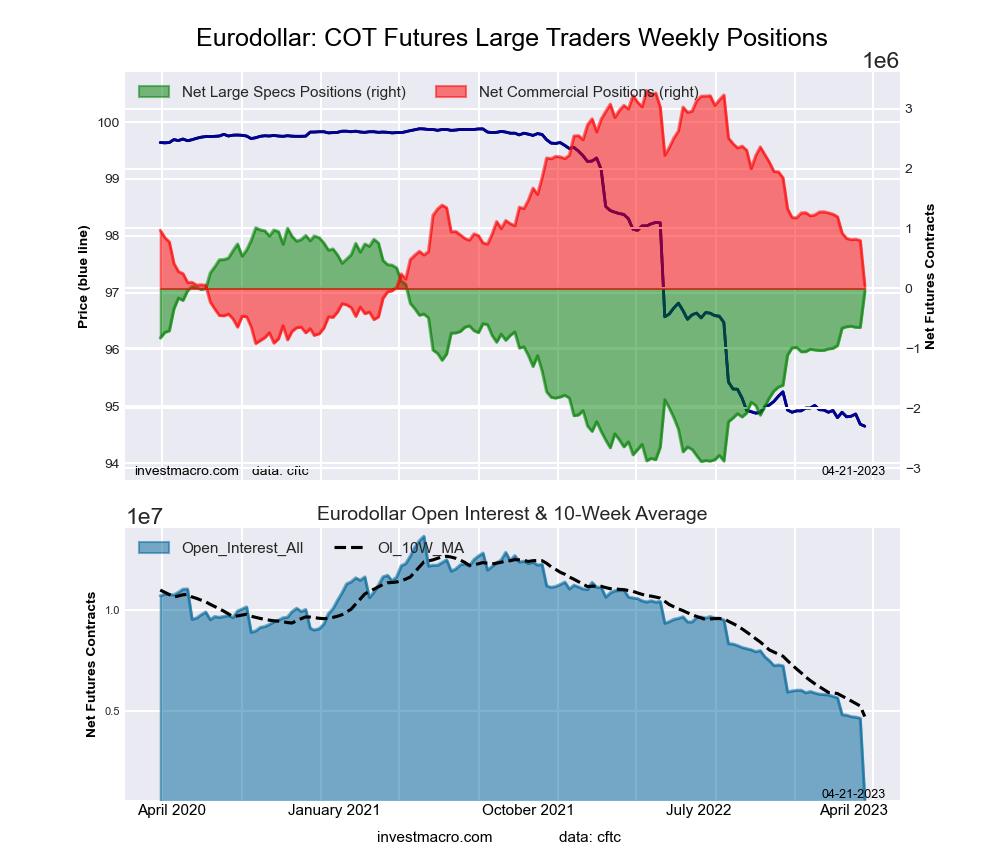
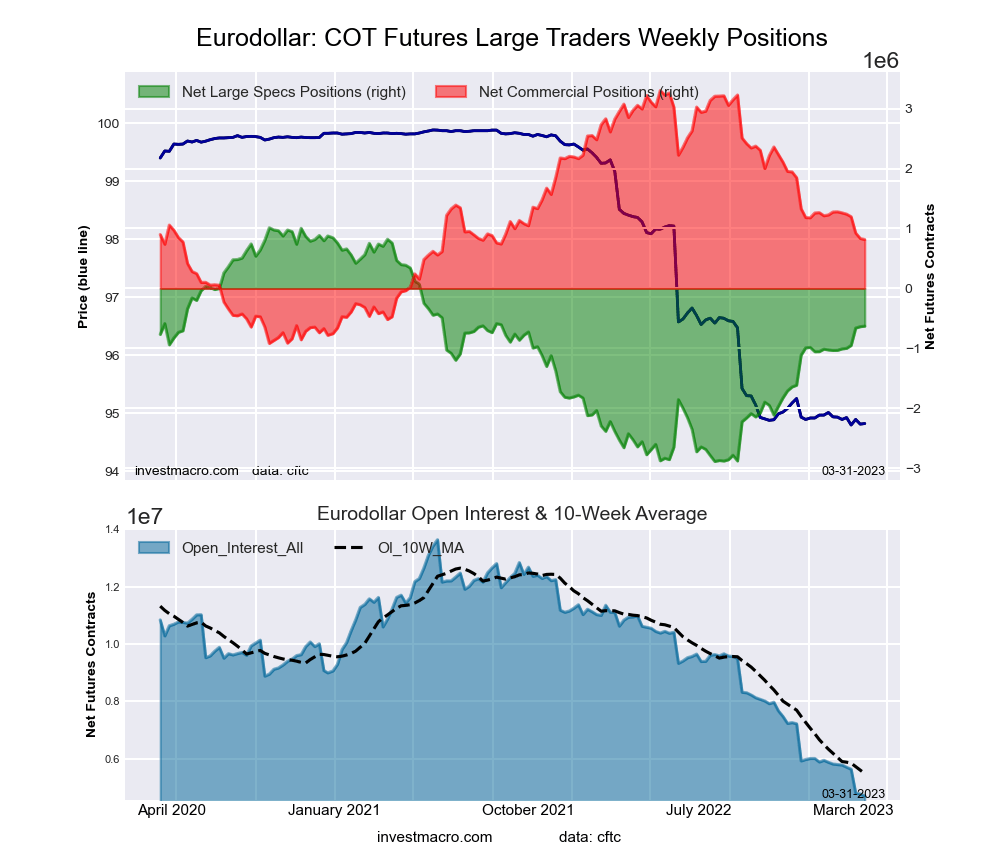
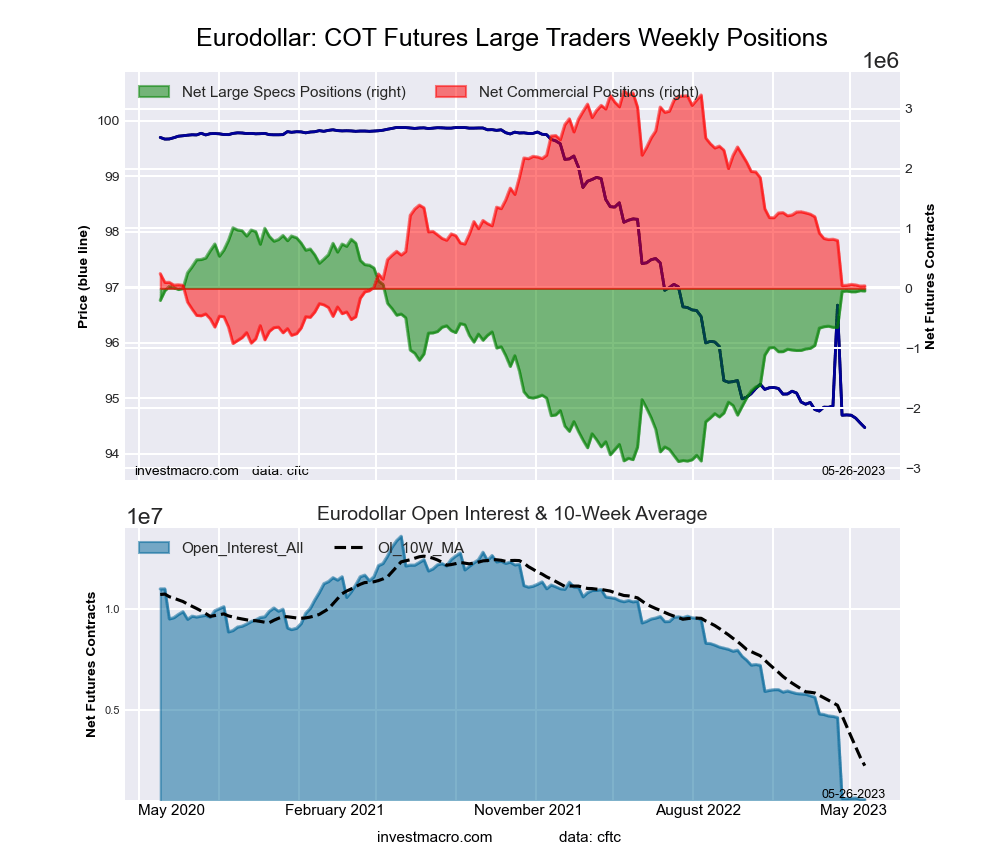 The 3-Month Eurodollars large speculator standing this week reached a net position of -41,549 contracts in the data reported through Tuesday. This was a weekly decrease of -4,665 contracts from the previous week which had a total of -36,884 net contracts.
This week’s current strength score (the trader positioning range over the past three years, measured from 0 to 100) shows the speculators are currently Bullish with a score of 73.0 percent. The commercials are Bearish with a score of 22.8 percent and the small traders (not shown in chart) are Bullish-Extreme with a score of 98.8 percent.
| 3-Month Eurodollars Statistics | SPECULATORS | COMMERCIALS | SMALL TRADERS |
| – Percent of Open Interest Longs: | 28.1 | 61.0 | 9.9 |
| – Percent of Open Interest Shorts: | 35.6 | 53.1 | 10.3 |
| – Net Position: | -41,549 | 43,737 | -2,188 |
| – Gross Longs: | 156,341 | 339,284 | 55,303 |
| – Gross Shorts: | 197,890 | 295,547 | 57,491 |
| – Long to Short Ratio: | 0.8 to 1 | 1.1 to 1 | 1.0 to 1 |
| NET POSITION TREND: | |||
| – Strength Index Score (3 Year Range Pct): | 73.0 | 22.8 | 98.8 |
| – Strength Index Reading (3 Year Range): | Bullish | Bearish | Bullish-Extreme |
| NET POSITION MOVEMENT INDEX: | |||
| – 6-Week Change in Strength Index: | 15.6 | -18.0 | 31.2 |
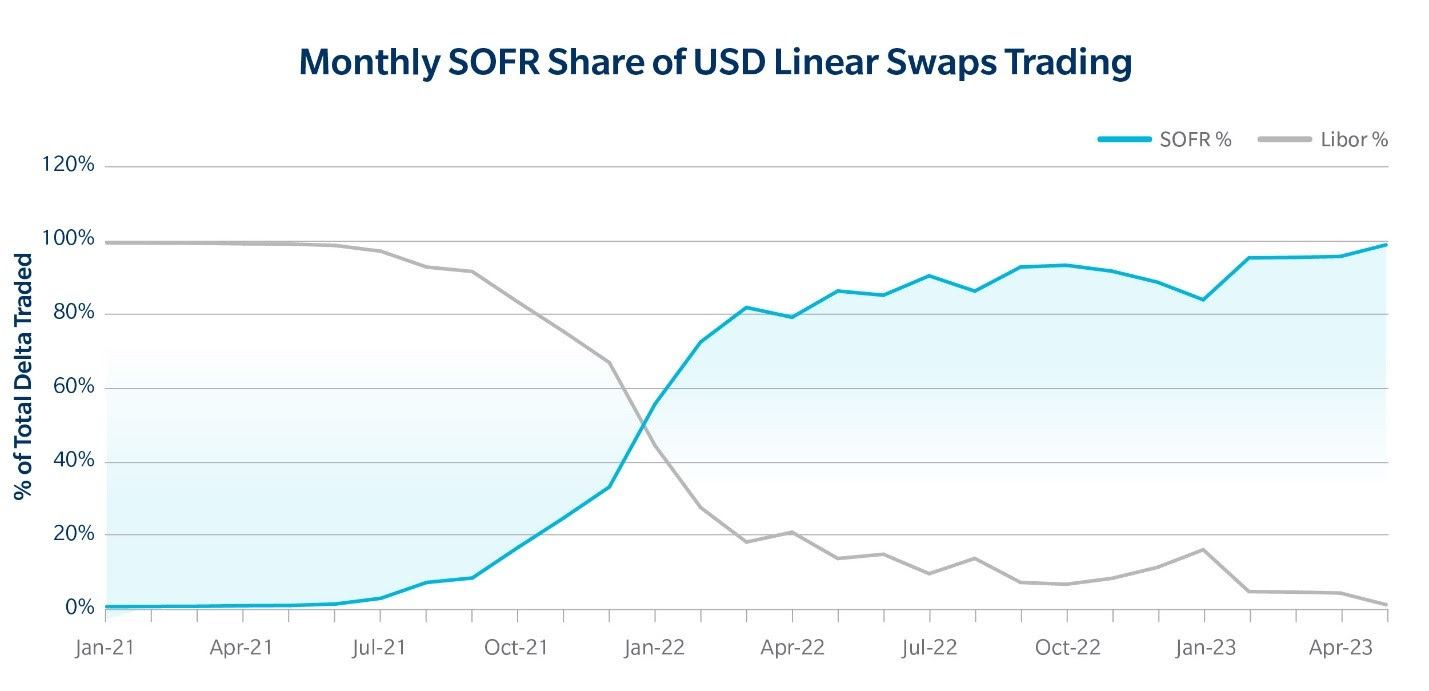
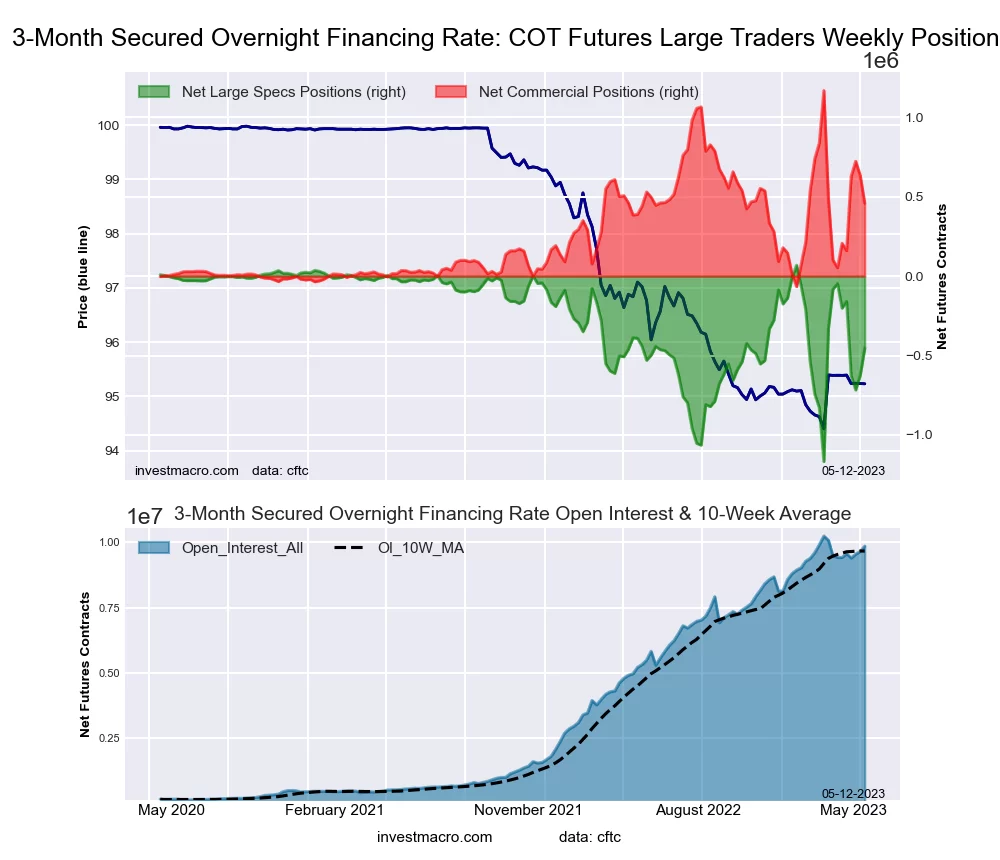
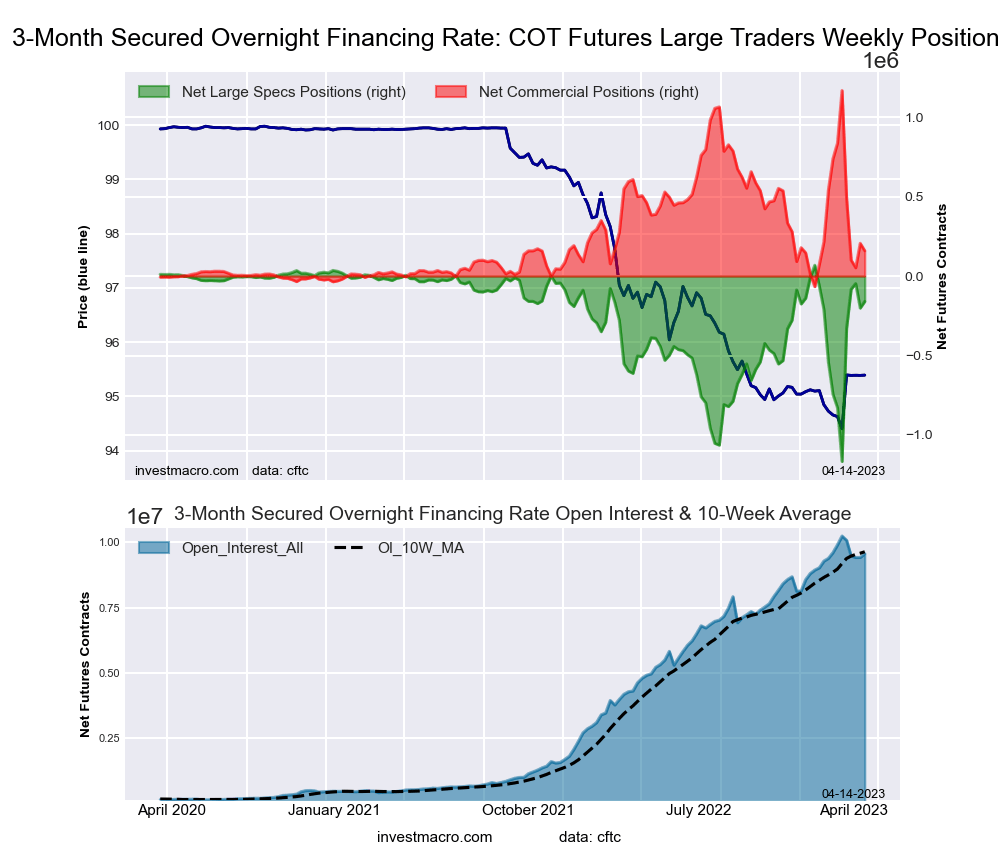
Secured Overnight Financing Rate (3-Month) Futures:
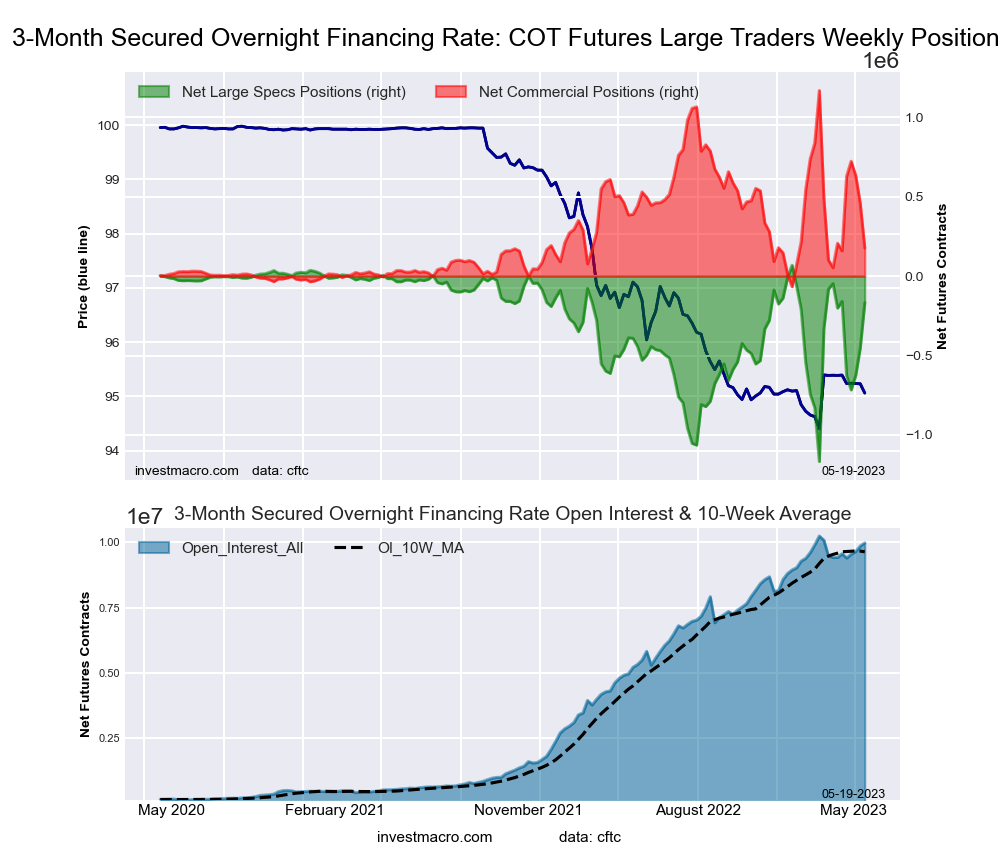
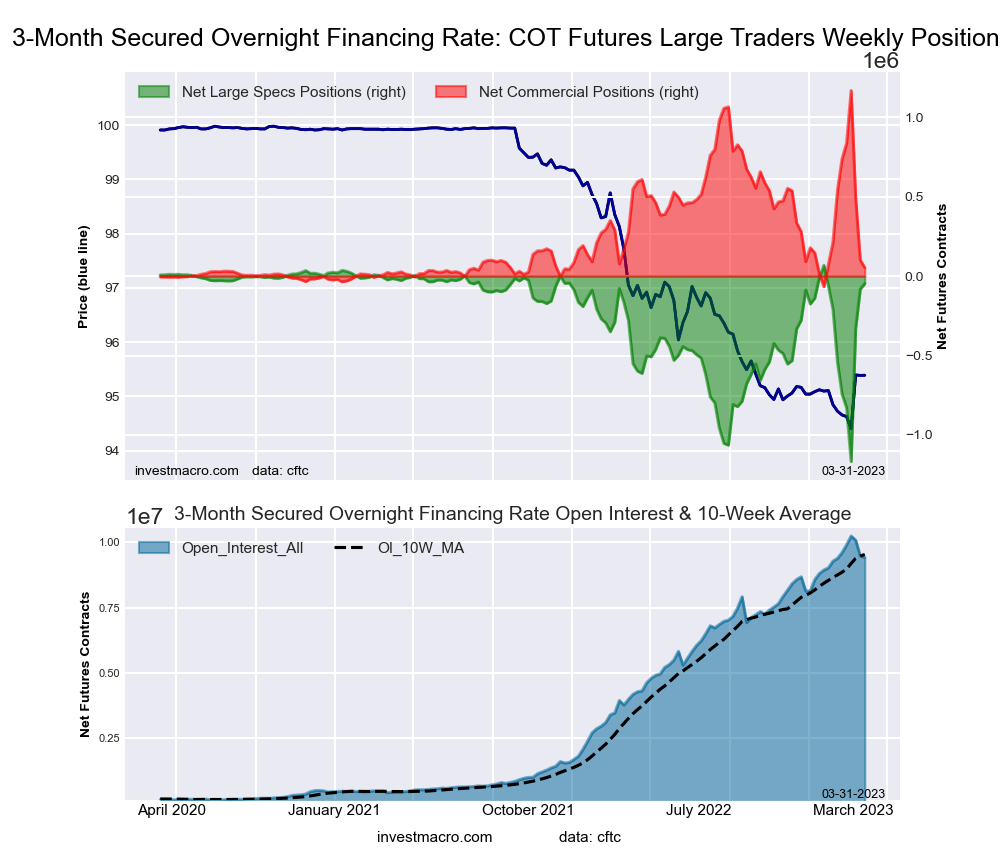
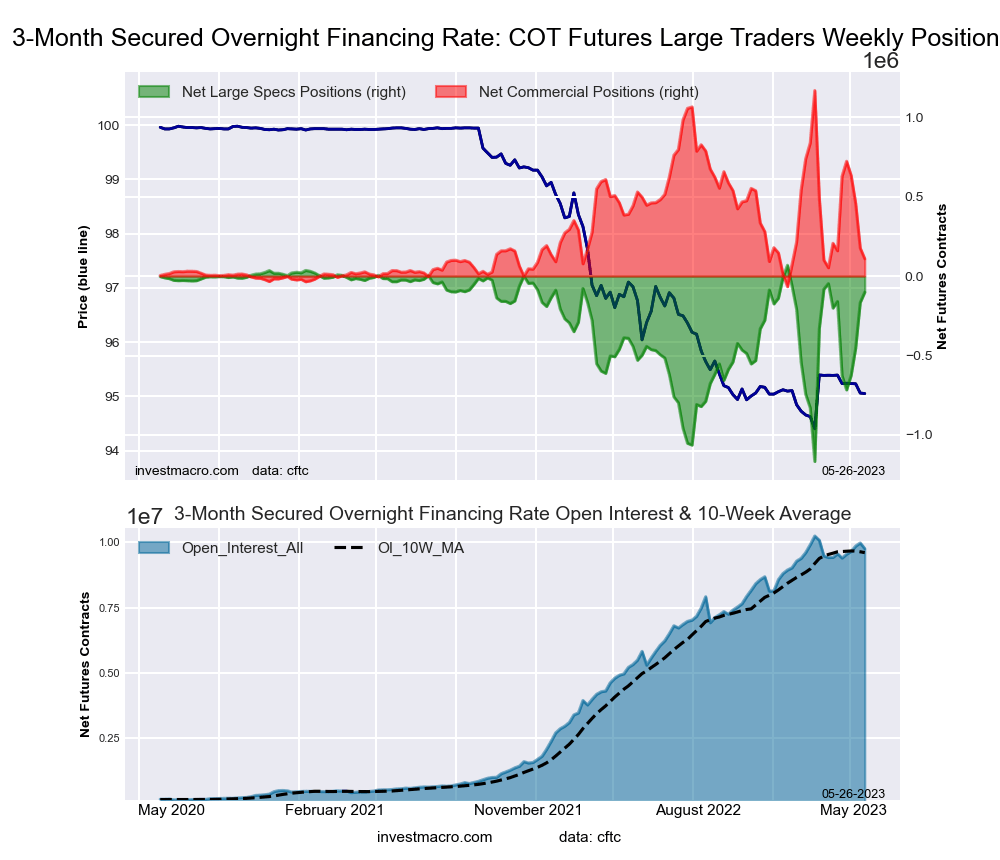 The Secured Overnight Financing Rate (3-Month) large speculator standing this week reached a net position of -101,543 contracts in the data reported through Tuesday. This was a weekly increase of 65,278 contracts from the previous week which had a total of -166,821 net contracts.
This week’s current strength score (the trader positioning range over the past three years, measured from 0 to 100) shows the speculators are currently Bullish-Extreme with a score of 86.3 percent. The commercials are Bearish-Extreme with a score of 14.2 percent and the small traders (not shown in chart) are Bullish-Extreme with a score of 83.8 percent.
| SOFR 3-Months Statistics | SPECULATORS | COMMERCIALS | SMALL TRADERS |
| – Percent of Open Interest Longs: | 16.1 | 61.1 | 0.5 |
| – Percent of Open Interest Shorts: | 17.1 | 59.9 | 0.5 |
| – Net Position: | -101,543 | 108,863 | -7,320 |
| – Gross Longs: | 1,568,592 | 5,953,387 | 45,538 |
| – Gross Shorts: | 1,670,135 | 5,844,524 | 52,858 |
| – Long to Short Ratio: | 0.9 to 1 | 1.0 to 1 | 0.9 to 1 |
| NET POSITION TREND: | |||
| – Strength Index Score (3 Year Range Pct): | 86.3 | 14.2 | 83.8 |
| – Strength Index Reading (3 Year Range): | Bullish-Extreme | Bearish-Extreme | Bullish-Extreme |
| NET POSITION MOVEMENT INDEX: | |||
| – 6-Week Change in Strength Index: | 4.7 | -4.1 | -4.1 |
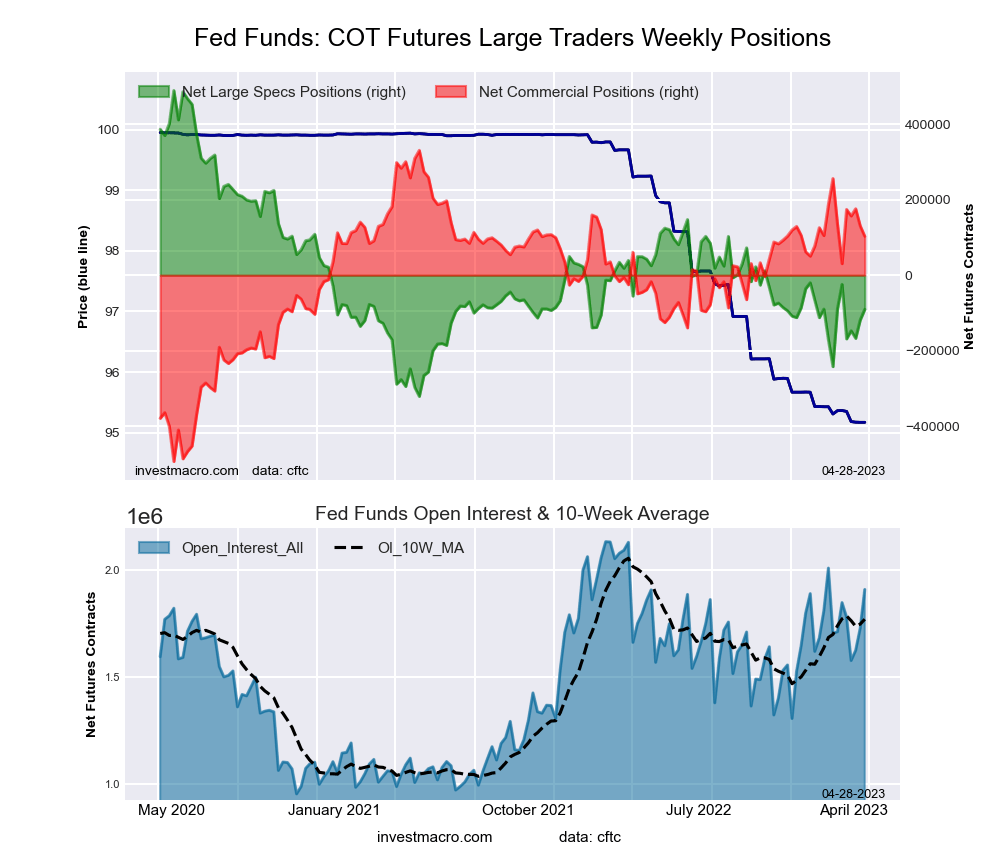
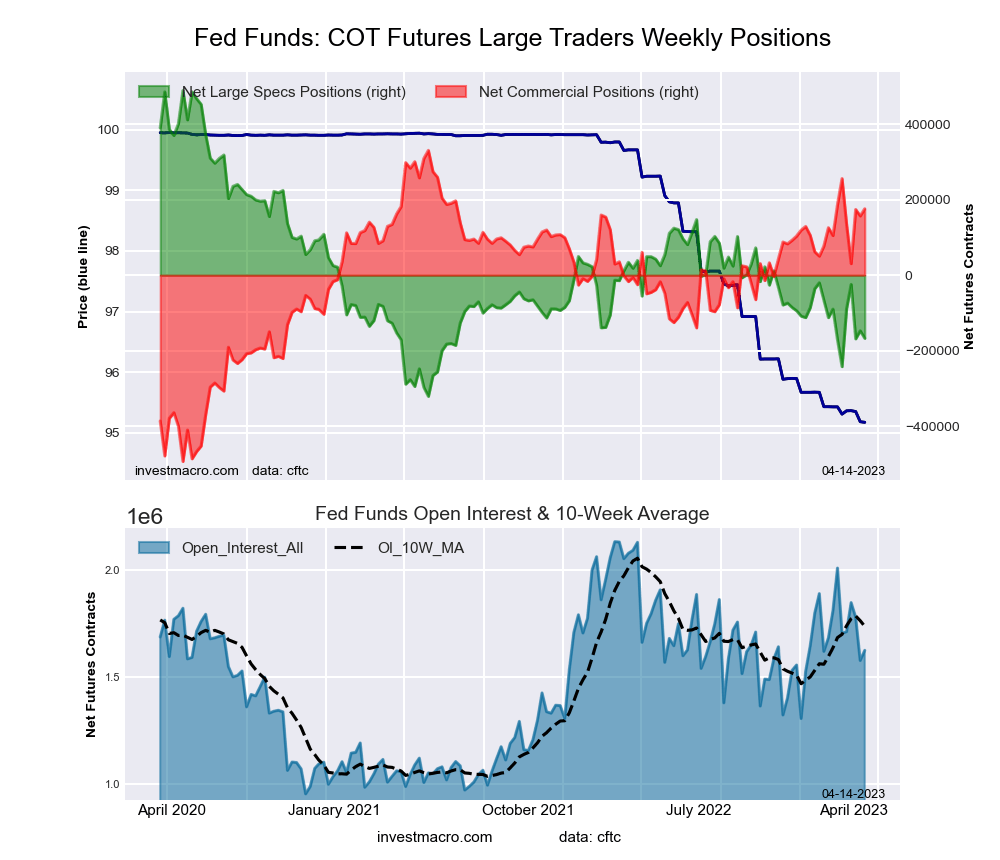
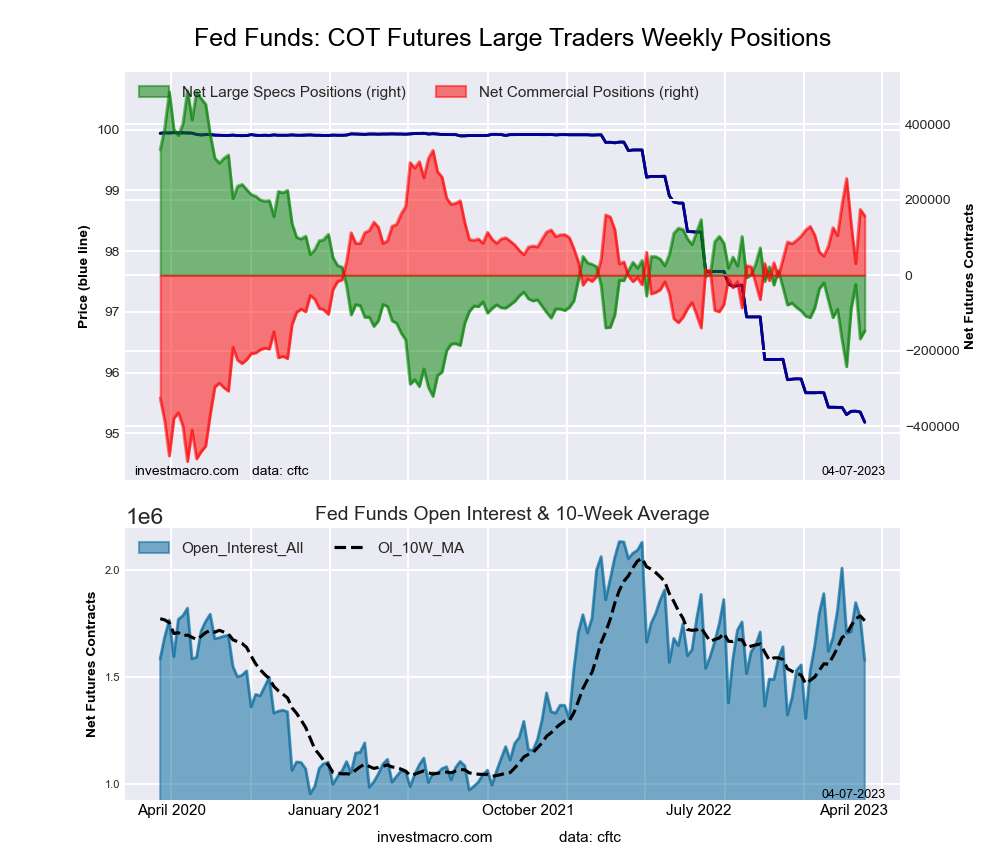
30-Day Federal Funds Futures:
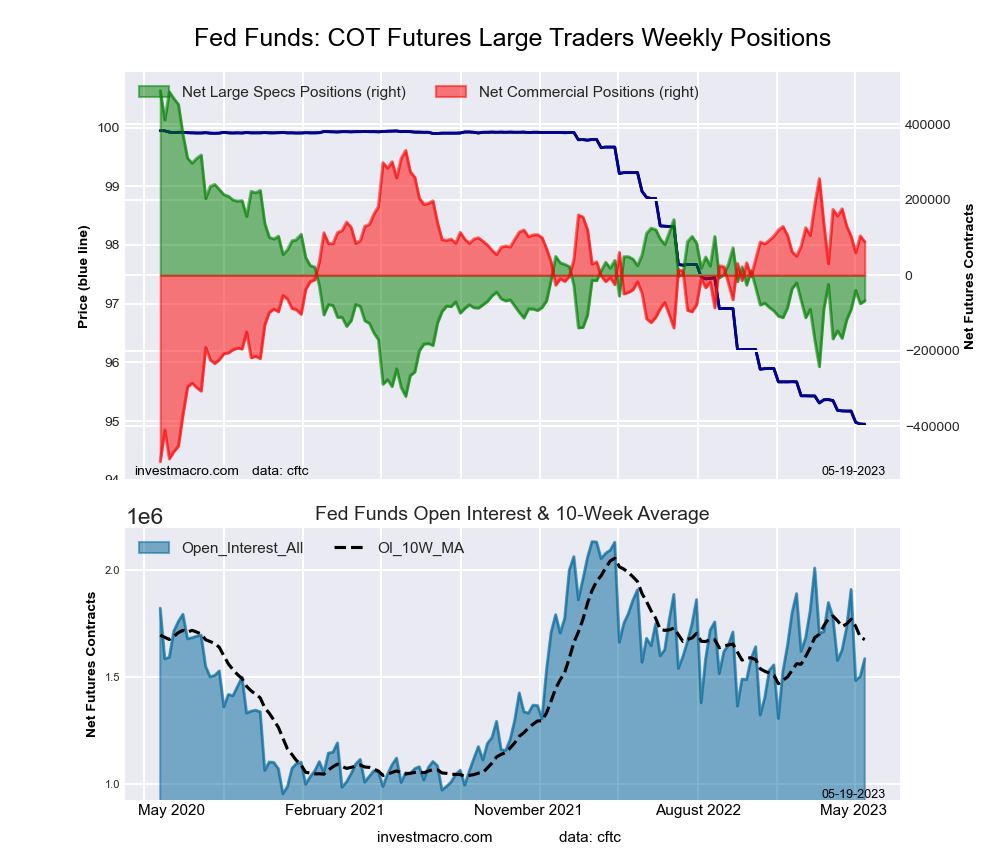
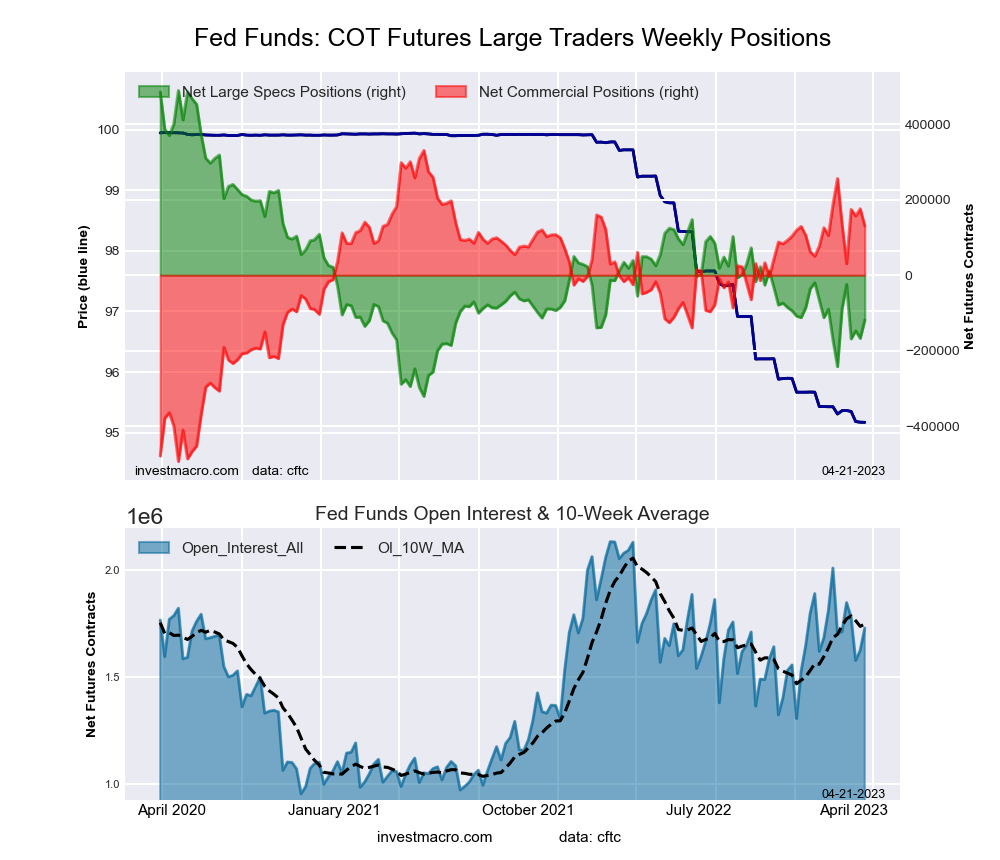
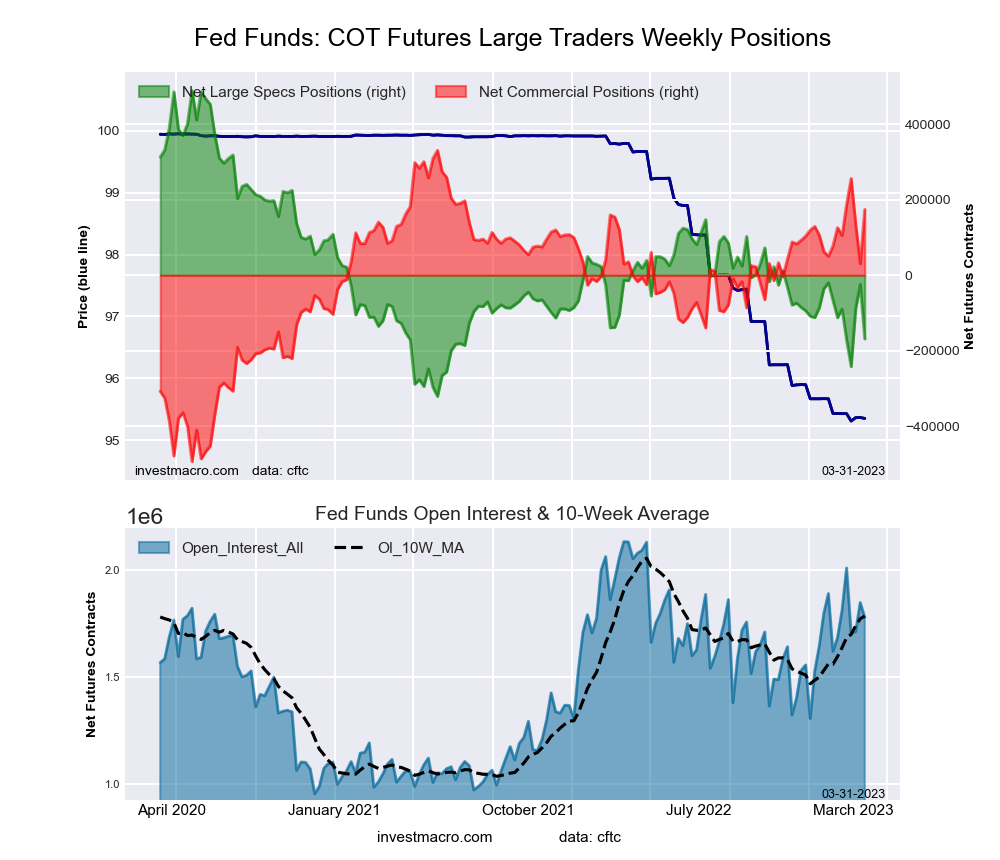
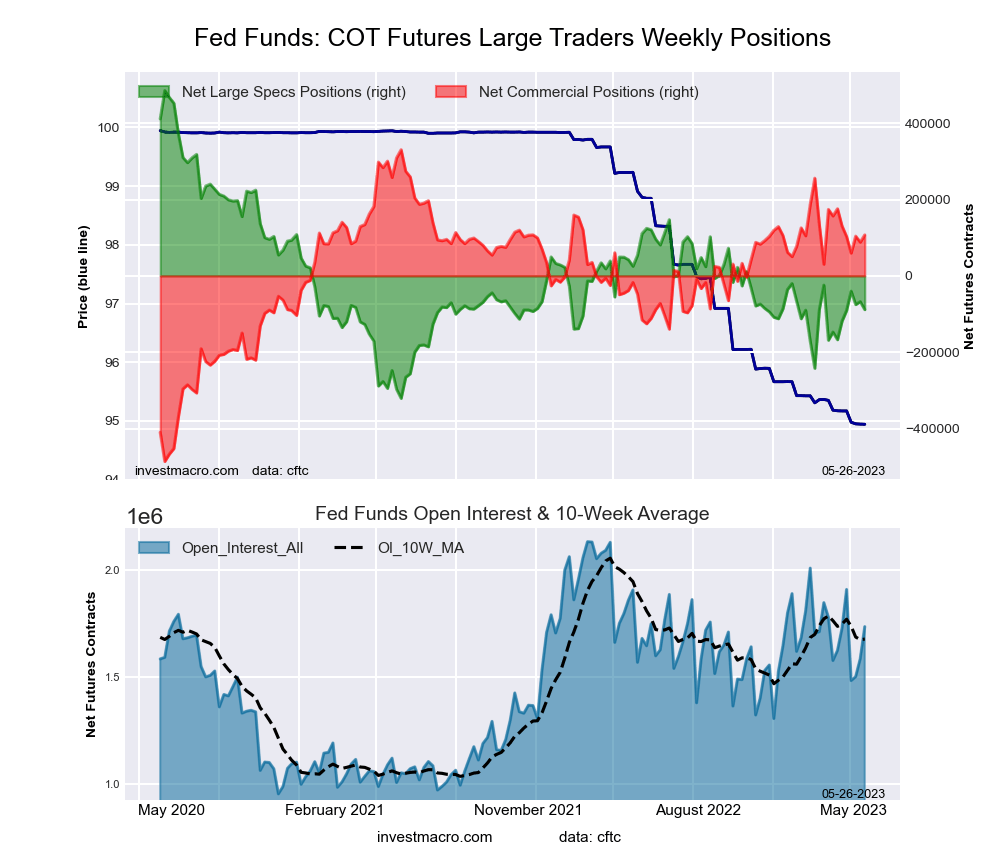 The 30-Day Federal Funds large speculator standing this week reached a net position of -88,495 contracts in the data reported through Tuesday. This was a weekly decrease of -20,924 contracts from the previous week which had a total of -67,571 net contracts.
This week’s current strength score (the trader positioning range over the past three years, measured from 0 to 100) shows the speculators are currently Bearish with a score of 28.8 percent. The commercials are Bullish with a score of 72.7 percent and the small traders (not shown in chart) are Bullish with a score of 54.1 percent.
| 30-Day Federal Funds Statistics | SPECULATORS | COMMERCIALS | SMALL TRADERS |
| – Percent of Open Interest Longs: | 5.8 | 76.5 | 1.9 |
| – Percent of Open Interest Shorts: | 10.9 | 70.3 | 3.0 |
| – Net Position: | -88,495 | 107,292 | -18,797 |
| – Gross Longs: | 100,027 | 1,327,988 | 33,520 |
| – Gross Shorts: | 188,522 | 1,220,696 | 52,317 |
| – Long to Short Ratio: | 0.5 to 1 | 1.1 to 1 | 0.6 to 1 |
| NET POSITION TREND: | |||
| – Strength Index Score (3 Year Range Pct): | 28.8 | 72.7 | 54.1 |
| – Strength Index Reading (3 Year Range): | Bearish | Bullish | Bullish |
| NET POSITION MOVEMENT INDEX: | |||
| – 6-Week Change in Strength Index: | 9.8 | -8.4 | -20.0 |
2-Year Treasury Note Futures:
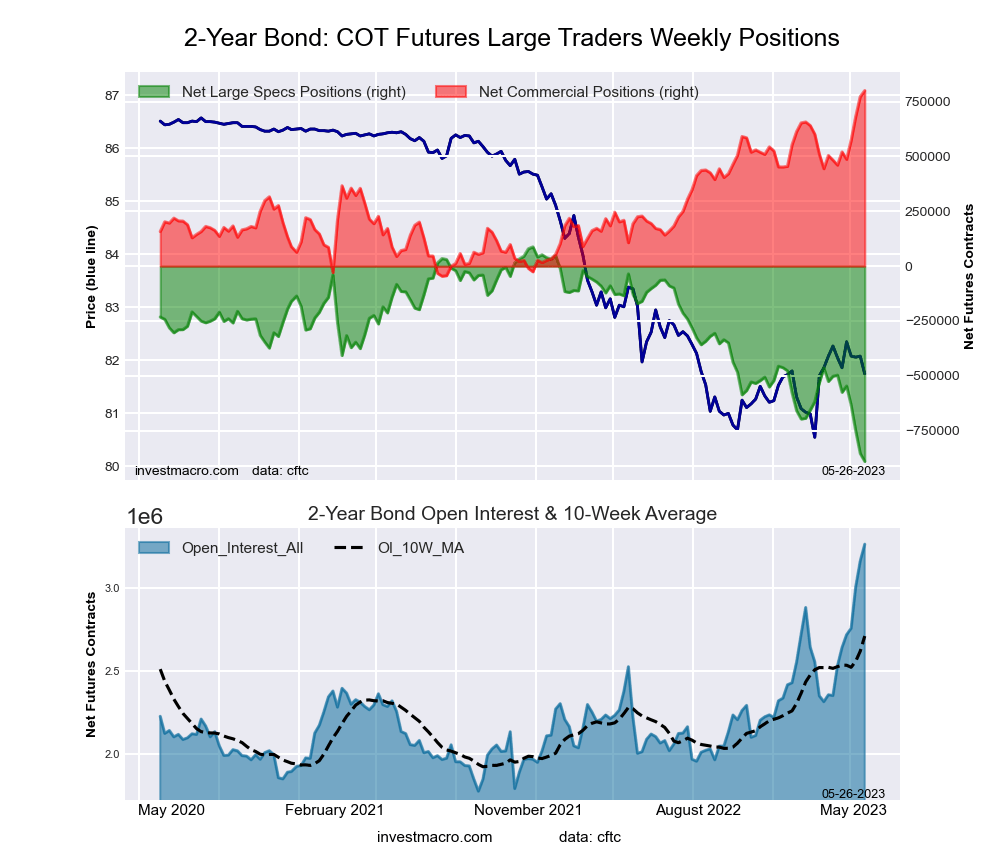 The 2-Year Treasury Note large speculator standing this week reached a net position of -890,202 contracts in the data reported through Tuesday. This was a weekly lowering of -36,627 contracts from the previous week which had a total of -853,575 net contracts.
This week’s current strength score (the trader positioning range over the past three years, measured from 0 to 100) shows the speculators are currently Bearish-Extreme with a score of 0.0 percent. The commercials are Bullish-Extreme with a score of 100.0 percent and the small traders (not shown in chart) are Bullish-Extreme with a score of 98.8 percent.
| 2-Year Treasury Note Statistics | SPECULATORS | COMMERCIALS | SMALL TRADERS |
| – Percent of Open Interest Longs: | 8.3 | 82.4 | 7.5 |
| – Percent of Open Interest Shorts: | 35.5 | 57.9 | 4.7 |
| – Net Position: | -890,202 | 800,371 | 89,831 |
| – Gross Longs: | 270,465 | 2,690,719 | 244,689 |
| – Gross Shorts: | 1,160,667 | 1,890,348 | 154,858 |
| – Long to Short Ratio: | 0.2 to 1 | 1.4 to 1 | 1.6 to 1 |
| NET POSITION TREND: | |||
| – Strength Index Score (3 Year Range Pct): | 0.0 | 100.0 | 98.8 |
| – Strength Index Reading (3 Year Range): | Bearish-Extreme | Bullish-Extreme | Bullish-Extreme |
| NET POSITION MOVEMENT INDEX: | |||
| – 6-Week Change in Strength Index: | -40.2 | 40.2 | 25.6 |
5-Year Treasury Note Futures:
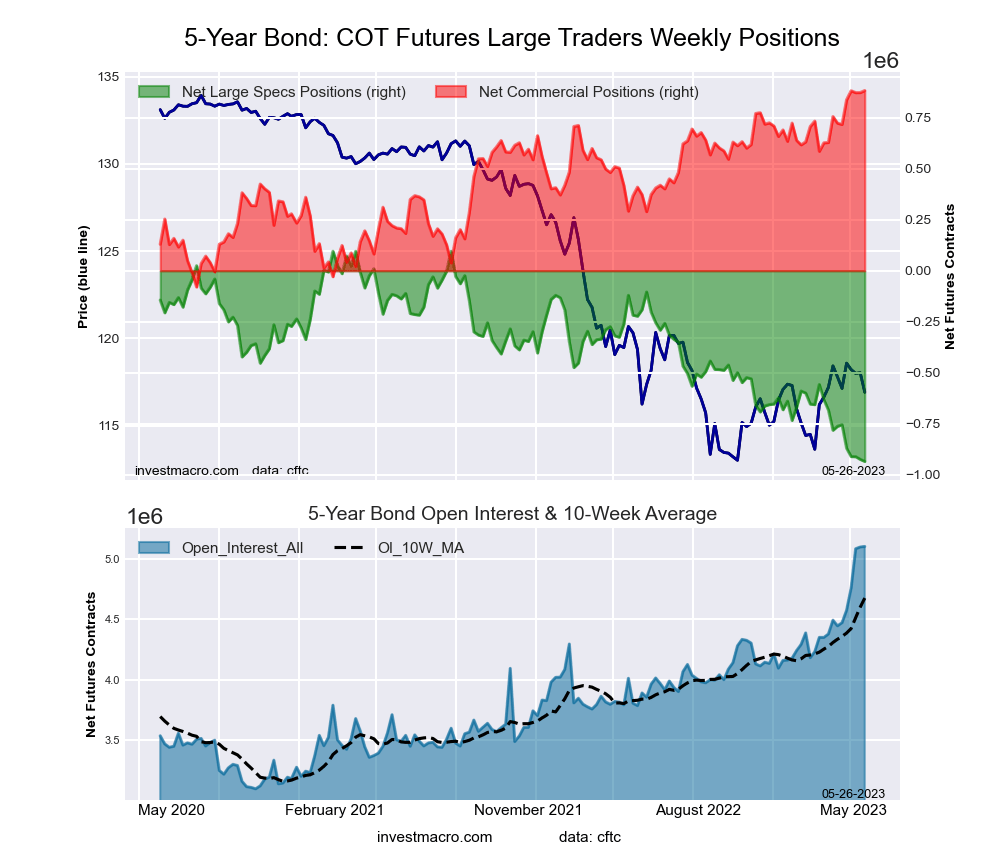 The 5-Year Treasury Note large speculator standing this week reached a net position of -934,069 contracts in the data reported through Tuesday. This was a weekly fall of -10,156 contracts from the previous week which had a total of -923,913 net contracts.
This week’s current strength score (the trader positioning range over the past three years, measured from 0 to 100) shows the speculators are currently Bearish-Extreme with a score of 0.0 percent. The commercials are Bullish-Extreme with a score of 100.0 percent and the small traders (not shown in chart) are Bullish-Extreme with a score of 95.1 percent.
| 5-Year Treasury Note Statistics | SPECULATORS | COMMERCIALS | SMALL TRADERS |
| – Percent of Open Interest Longs: | 8.3 | 82.0 | 7.8 |
| – Percent of Open Interest Shorts: | 26.6 | 64.7 | 6.8 |
| – Net Position: | -934,069 | 882,607 | 51,462 |
| – Gross Longs: | 423,353 | 4,186,028 | 396,832 |
| – Gross Shorts: | 1,357,422 | 3,303,421 | 345,370 |
| – Long to Short Ratio: | 0.3 to 1 | 1.3 to 1 | 1.1 to 1 |
| NET POSITION TREND: | |||
| – Strength Index Score (3 Year Range Pct): | 0.0 | 100.0 | 95.1 |
| – Strength Index Reading (3 Year Range): | Bearish-Extreme | Bullish-Extreme | Bullish-Extreme |
| NET POSITION MOVEMENT INDEX: | |||
| – 6-Week Change in Strength Index: | -16.7 | 16.6 | 3.3 |
10-Year Treasury Note Futures:
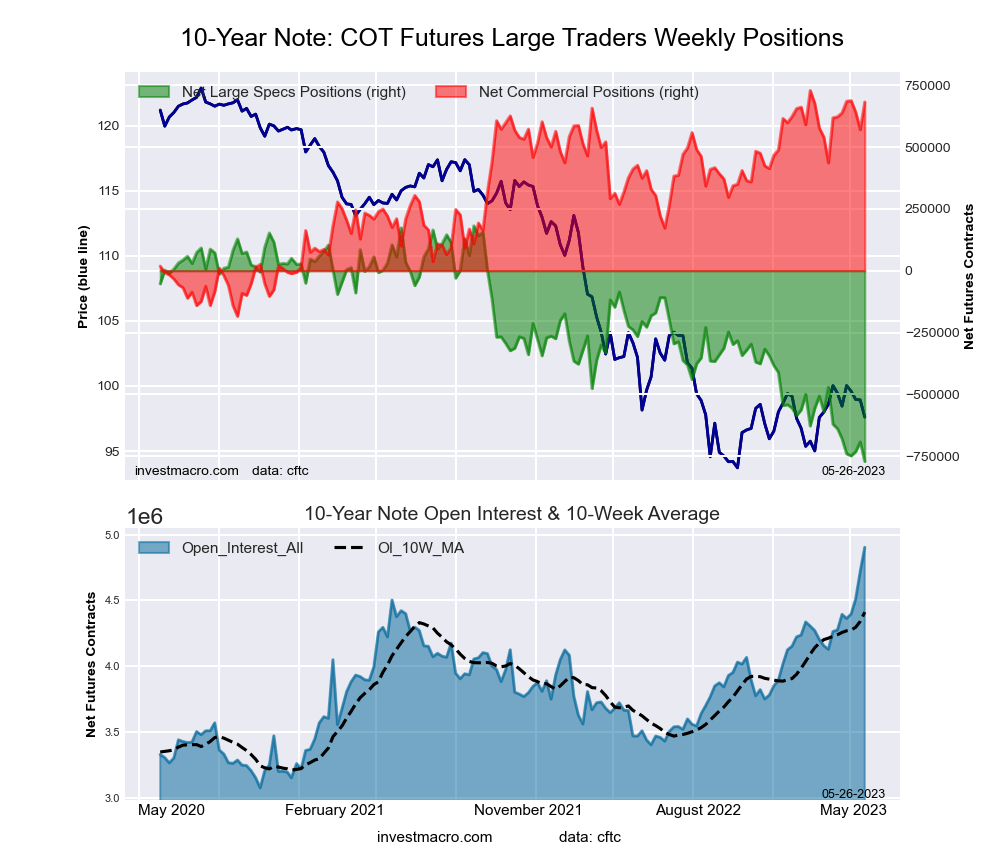 The 10-Year Treasury Note large speculator standing this week reached a net position of -771,638 contracts in the data reported through Tuesday. This was a weekly reduction of -79,196 contracts from the previous week which had a total of -692,442 net contracts.
This week’s current strength score (the trader positioning range over the past three years, measured from 0 to 100) shows the speculators are currently Bearish-Extreme with a score of 0.0 percent. The commercials are Bullish-Extreme with a score of 94.9 percent and the small traders (not shown in chart) are Bullish-Extreme with a score of 92.9 percent.
| 10-Year Treasury Note Statistics | SPECULATORS | COMMERCIALS | SMALL TRADERS |
| – Percent of Open Interest Longs: | 9.8 | 77.5 | 9.3 |
| – Percent of Open Interest Shorts: | 25.5 | 63.5 | 7.5 |
| – Net Position: | -771,638 | 682,402 | 89,236 |
| – Gross Longs: | 480,032 | 3,797,760 | 454,534 |
| – Gross Shorts: | 1,251,670 | 3,115,358 | 365,298 |
| – Long to Short Ratio: | 0.4 to 1 | 1.2 to 1 | 1.2 to 1 |
| NET POSITION TREND: | |||
| – Strength Index Score (3 Year Range Pct): | 0.0 | 94.9 | 92.9 |
| – Strength Index Reading (3 Year Range): | Bearish-Extreme | Bullish-Extreme | Bullish-Extreme |
| NET POSITION MOVEMENT INDEX: | |||
| – 6-Week Change in Strength Index: | -13.9 | 6.5 | 15.9 |
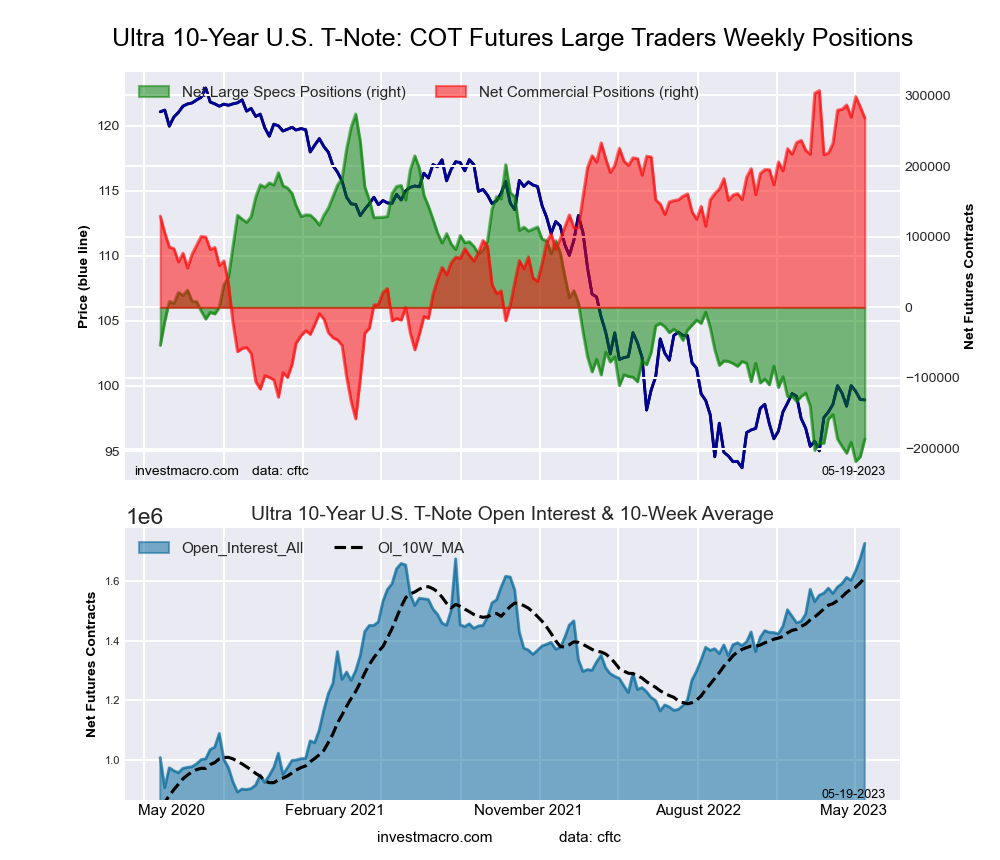
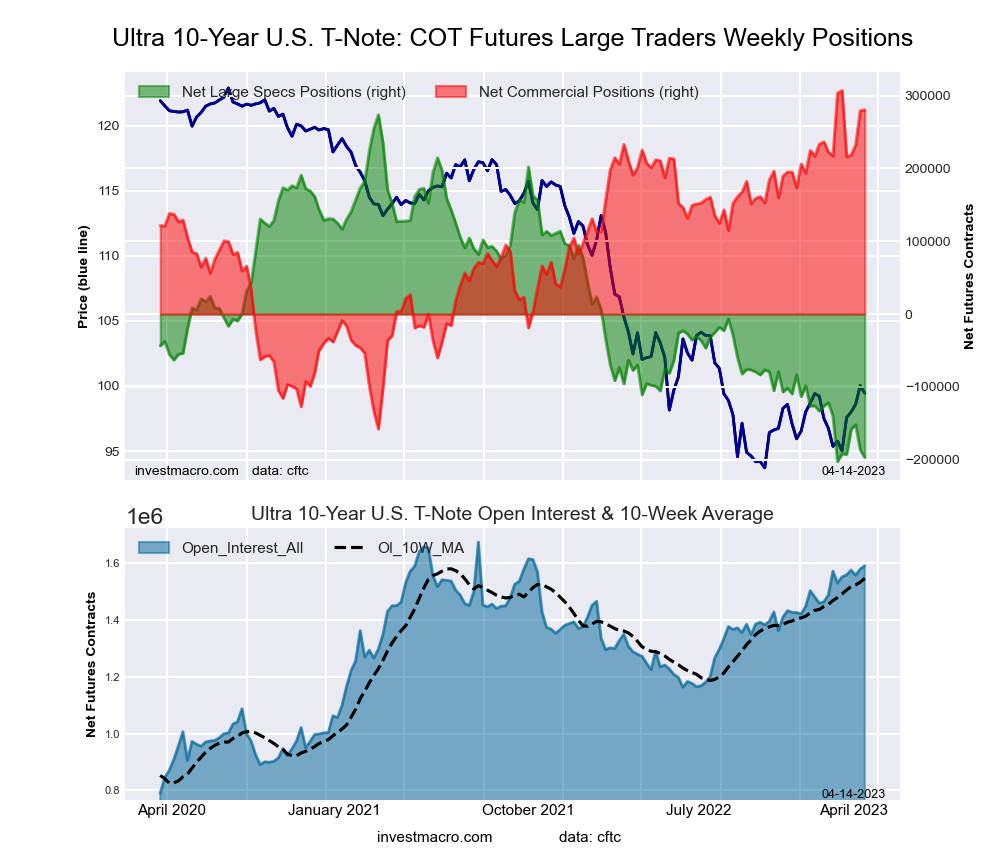
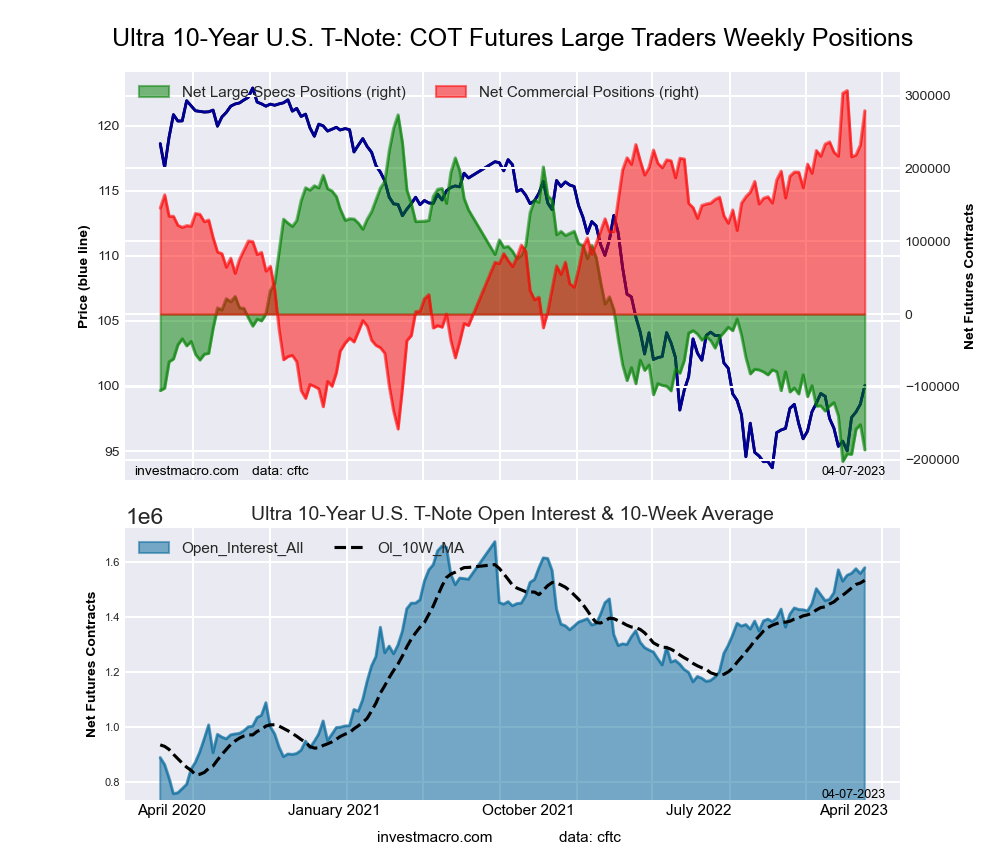
Ultra 10-Year Notes Futures:
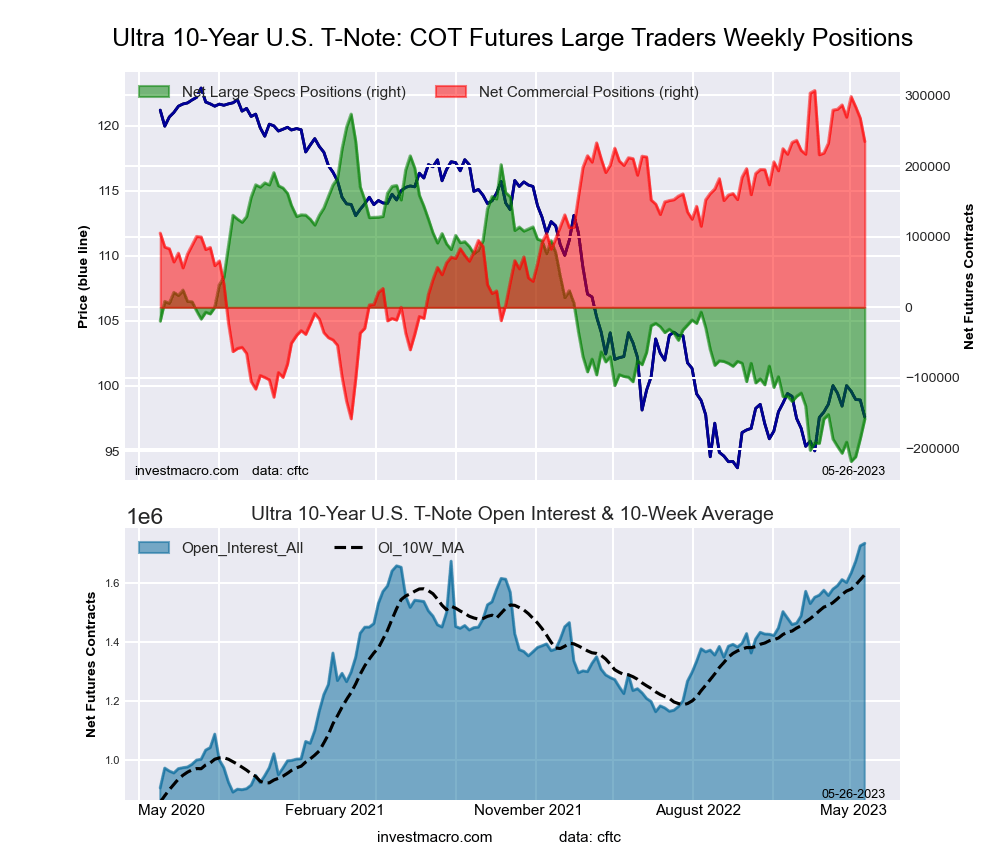 The Ultra 10-Year Notes large speculator standing this week reached a net position of -158,079 contracts in the data reported through Tuesday. This was a weekly increase of 28,348 contracts from the previous week which had a total of -186,427 net contracts.
This week’s current strength score (the trader positioning range over the past three years, measured from 0 to 100) shows the speculators are currently Bearish-Extreme with a score of 12.2 percent. The commercials are Bullish-Extreme with a score of 84.5 percent and the small traders (not shown in chart) are Bullish with a score of 68.4 percent.
| Ultra 10-Year Notes Statistics | SPECULATORS | COMMERCIALS | SMALL TRADERS |
| – Percent of Open Interest Longs: | 10.0 | 76.0 | 10.8 |
| – Percent of Open Interest Shorts: | 19.1 | 62.5 | 15.2 |
| – Net Position: | -158,079 | 234,828 | -76,749 |
| – Gross Longs: | 174,270 | 1,319,934 | 186,701 |
| – Gross Shorts: | 332,349 | 1,085,106 | 263,450 |
| – Long to Short Ratio: | 0.5 to 1 | 1.2 to 1 | 0.7 to 1 |
| NET POSITION TREND: | |||
| – Strength Index Score (3 Year Range Pct): | 12.2 | 84.5 | 68.4 |
| – Strength Index Reading (3 Year Range): | Bearish-Extreme | Bullish-Extreme | Bullish |
| NET POSITION MOVEMENT INDEX: | |||
| – 6-Week Change in Strength Index: | 7.9 | -9.8 | 4.0 |
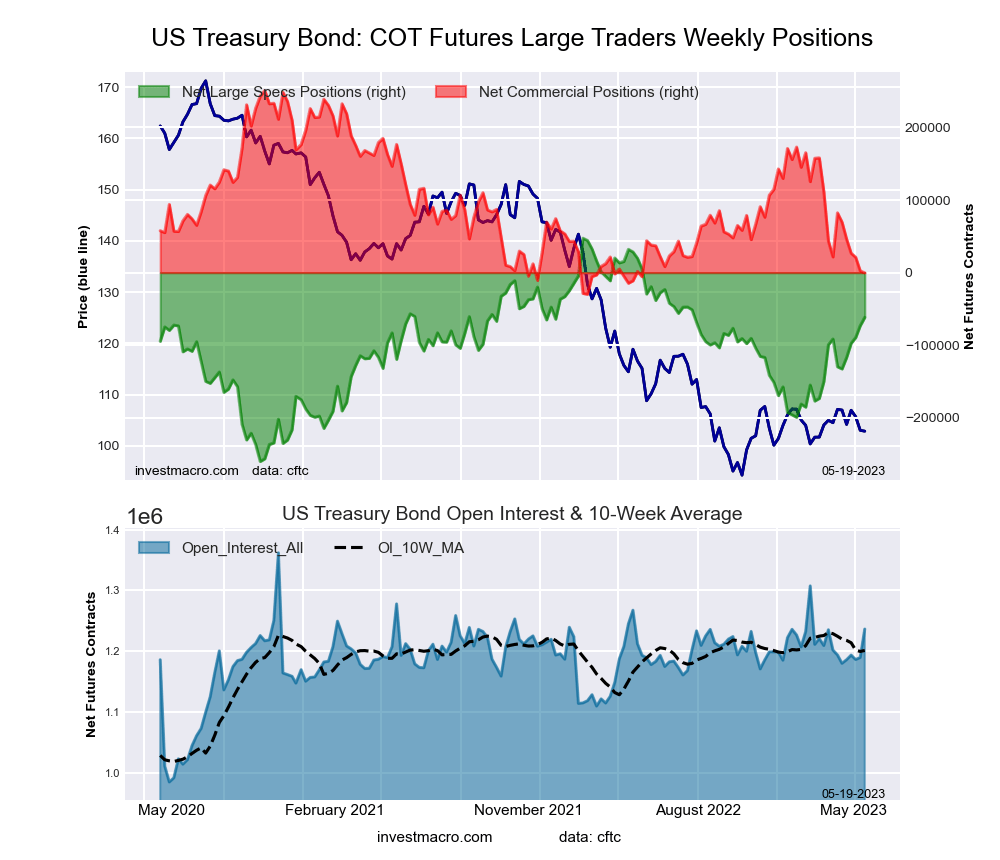
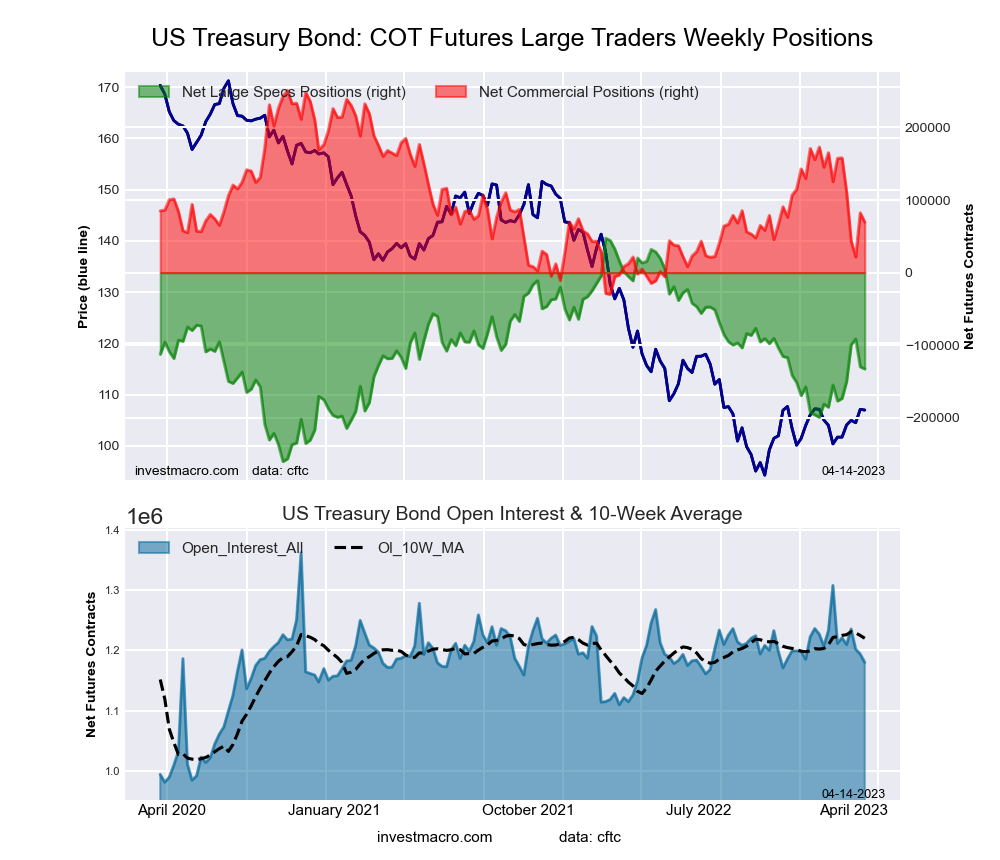
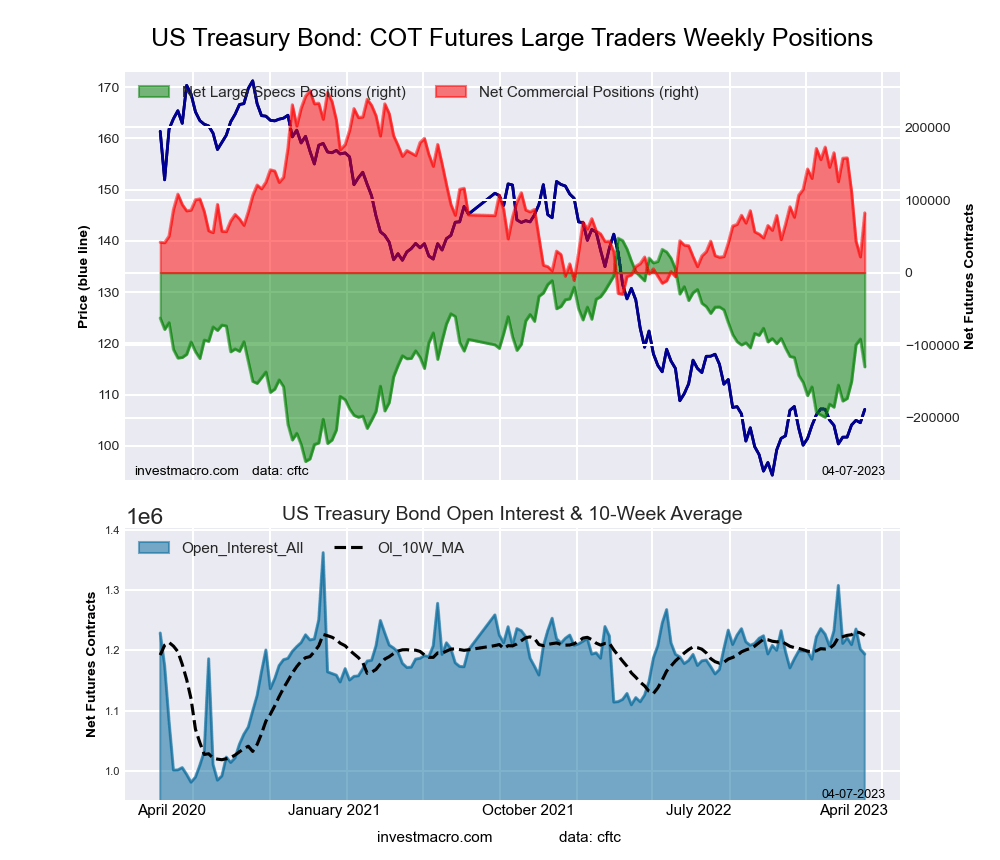
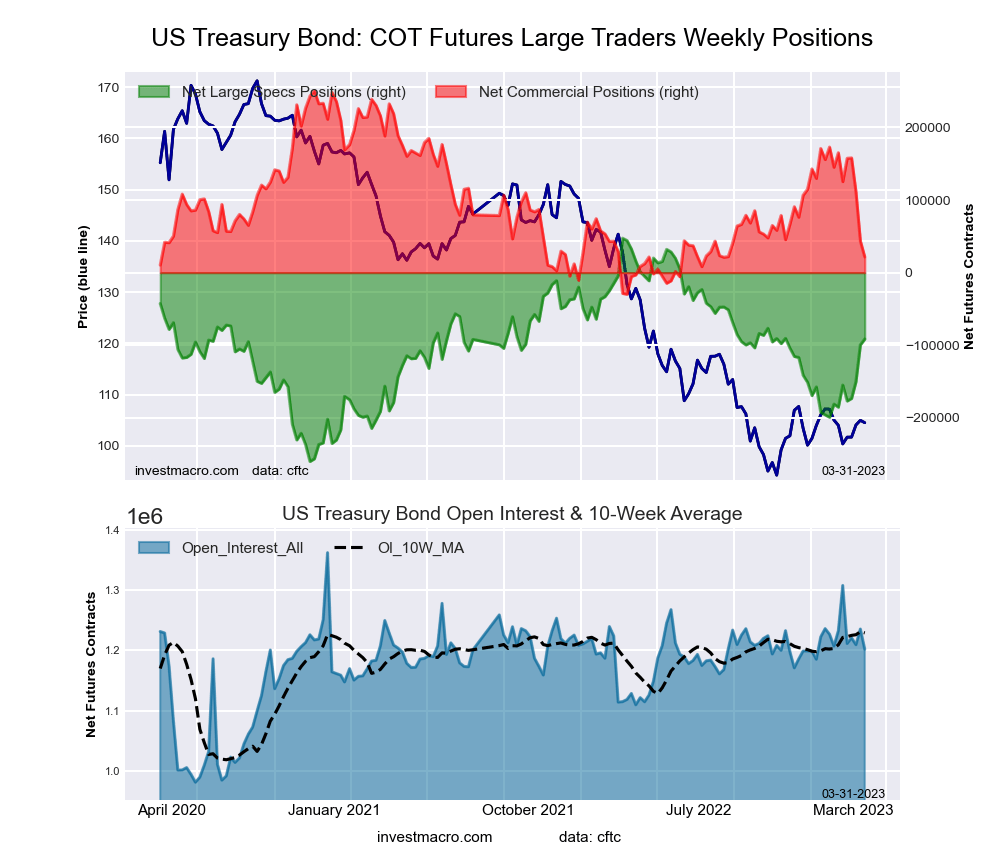
US Treasury Bonds Futures:
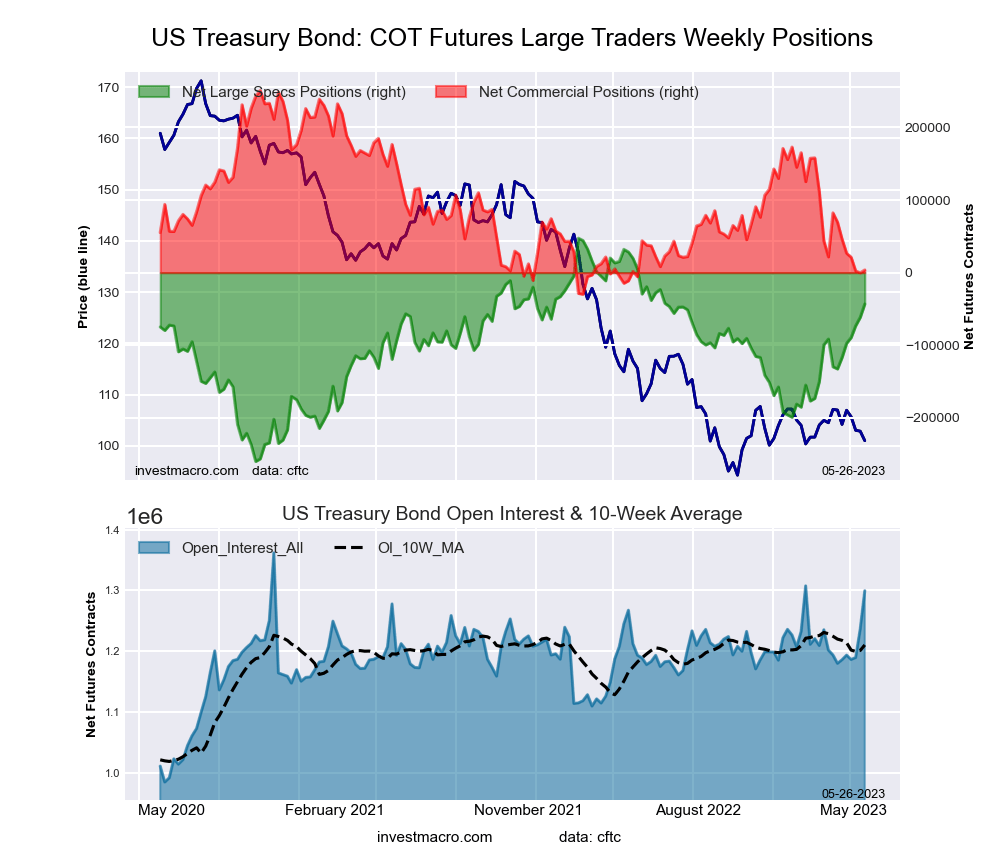 The US Treasury Bonds large speculator standing this week reached a net position of -43,236 contracts in the data reported through Tuesday. This was a weekly increase of 18,345 contracts from the previous week which had a total of -61,581 net contracts.
This week’s current strength score (the trader positioning range over the past three years, measured from 0 to 100) shows the speculators are currently Bullish with a score of 70.5 percent. The commercials are Bearish-Extreme with a score of 11.9 percent and the small traders (not shown in chart) are Bullish with a score of 77.2 percent.
| US Treasury Bonds Statistics | SPECULATORS | COMMERCIALS | SMALL TRADERS |
| – Percent of Open Interest Longs: | 8.6 | 74.4 | 14.8 |
| – Percent of Open Interest Shorts: | 12.0 | 74.1 | 11.8 |
| – Net Position: | -43,236 | 3,696 | 39,540 |
| – Gross Longs: | 112,271 | 966,329 | 192,516 |
| – Gross Shorts: | 155,507 | 962,633 | 152,976 |
| – Long to Short Ratio: | 0.7 to 1 | 1.0 to 1 | 1.3 to 1 |
| NET POSITION TREND: | |||
| – Strength Index Score (3 Year Range Pct): | 70.5 | 11.9 | 77.2 |
| – Strength Index Reading (3 Year Range): | Bullish | Bearish-Extreme | Bullish |
| NET POSITION MOVEMENT INDEX: | |||
| – 6-Week Change in Strength Index: | 29.1 | -23.5 | -17.2 |
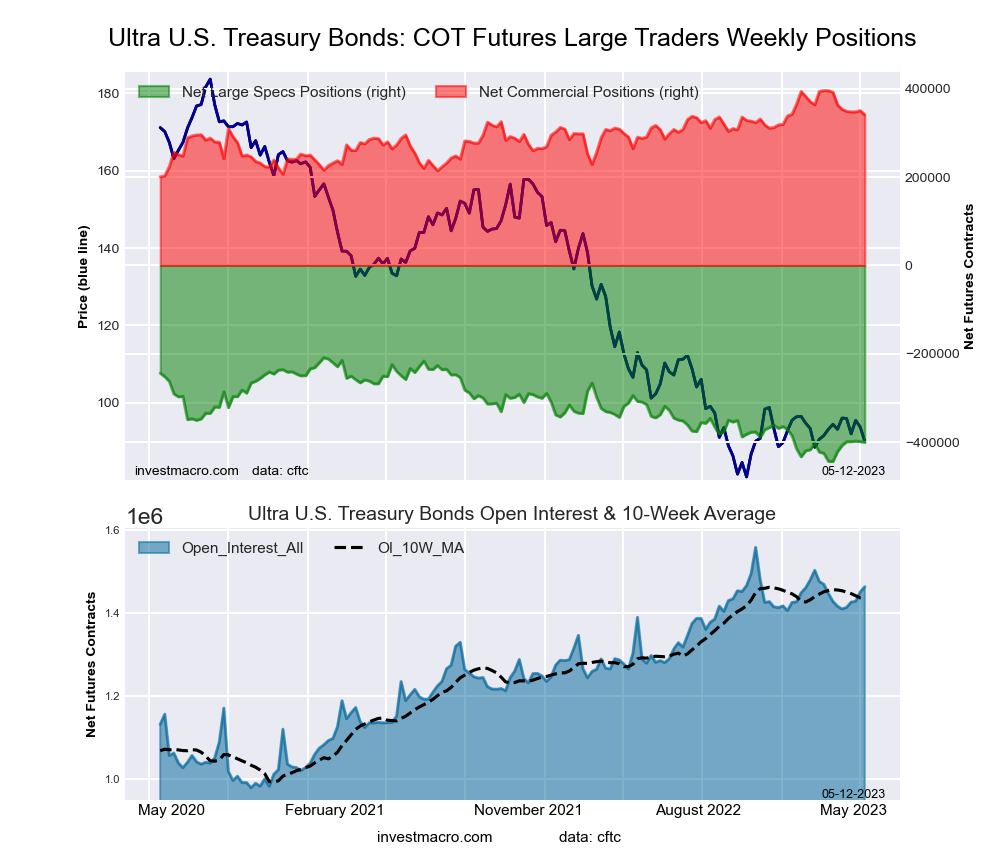
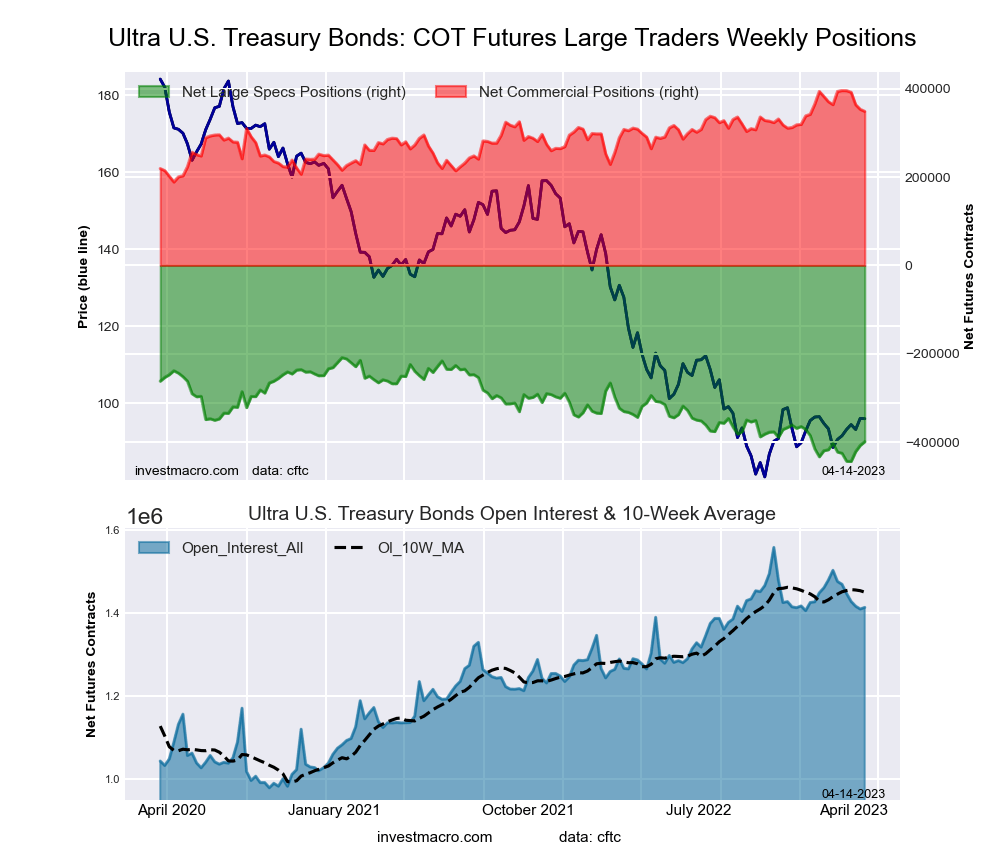
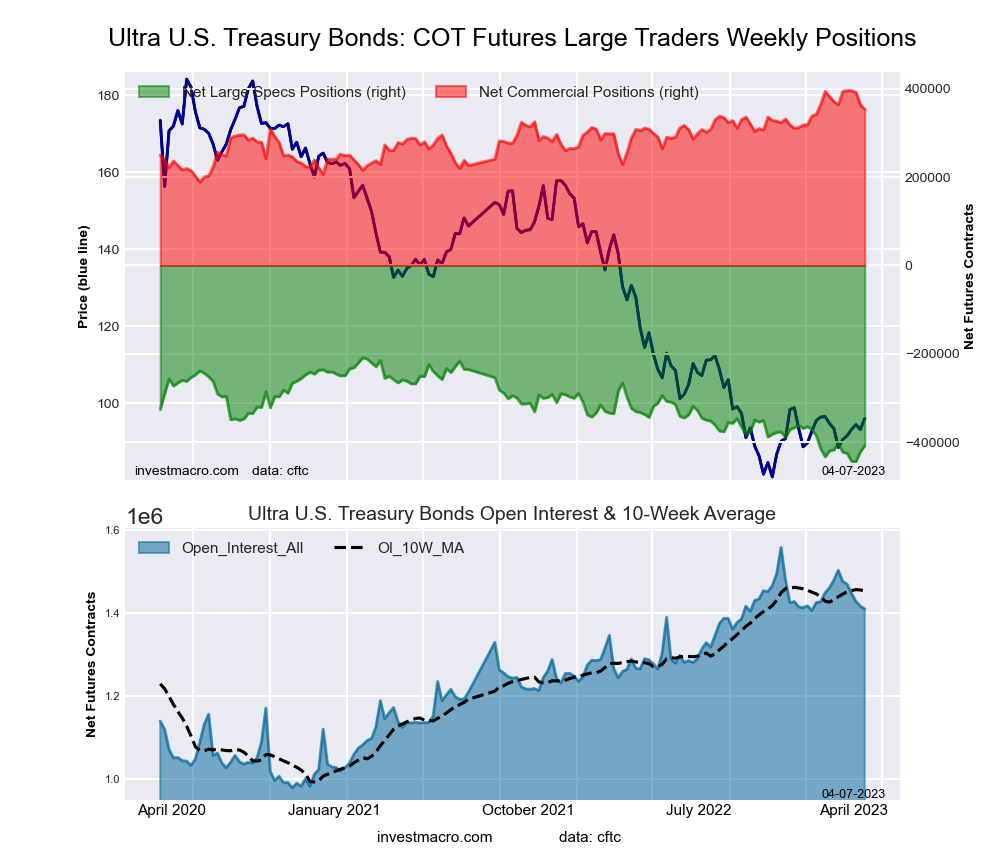
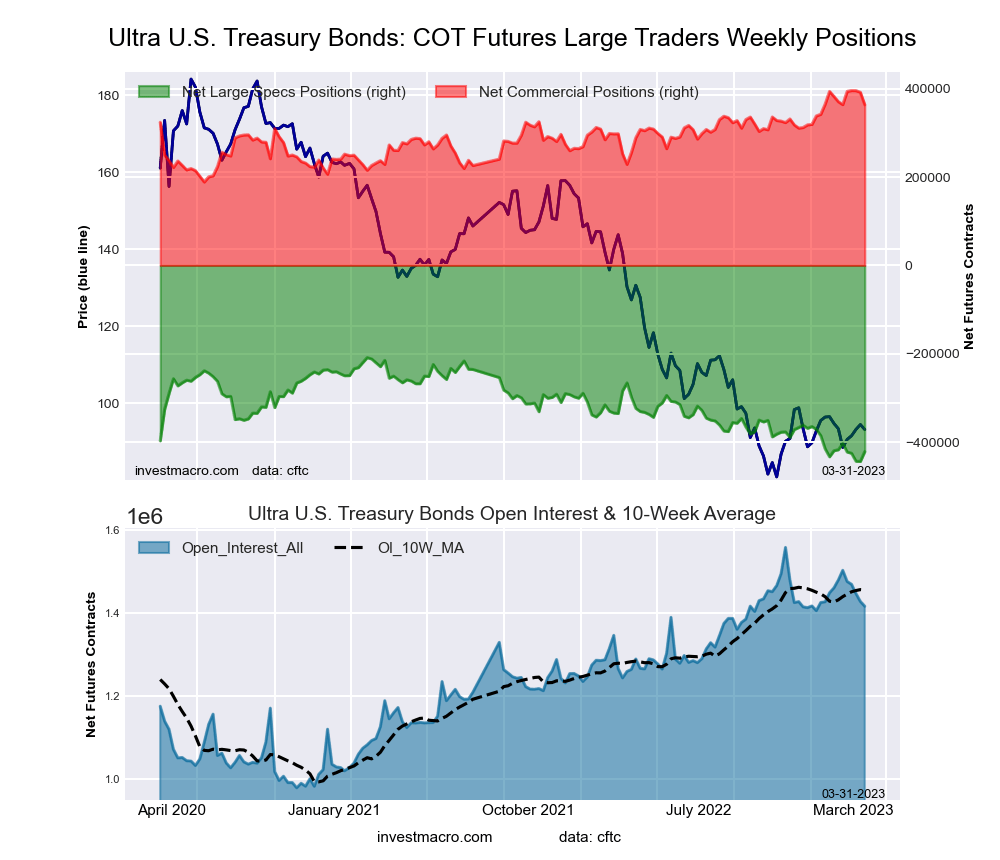
Ultra US Treasury Bonds Futures:
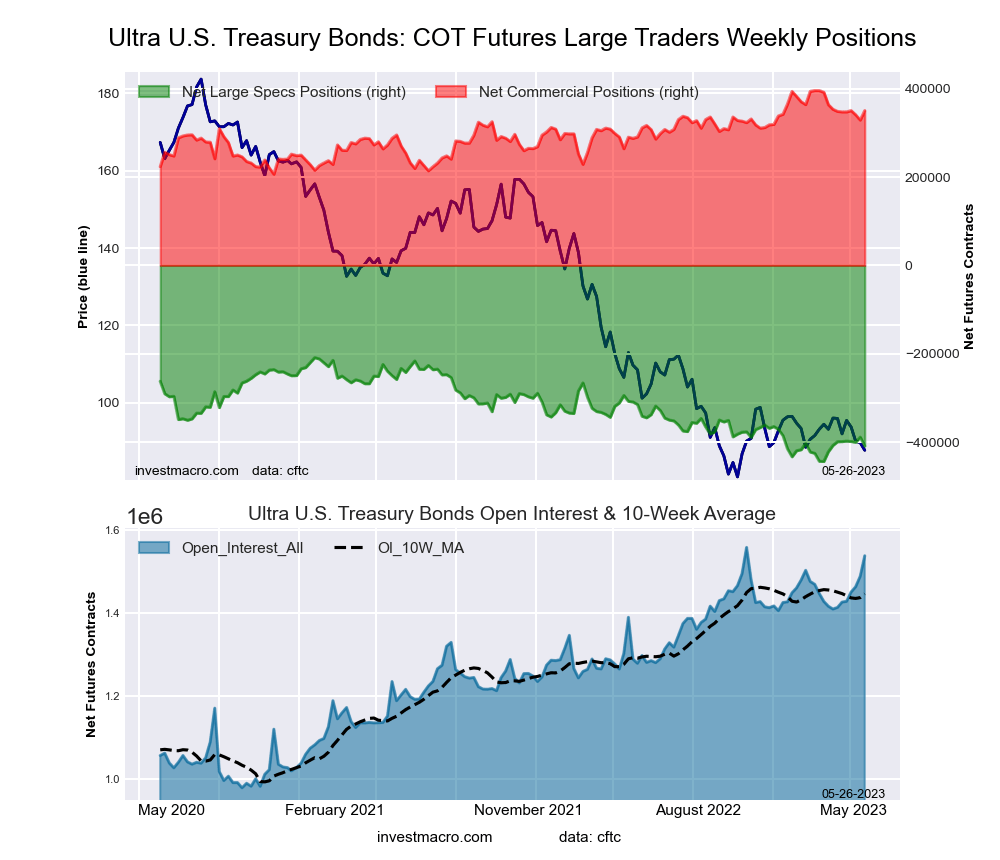 The Ultra US Treasury Bonds large speculator standing this week reached a net position of -409,108 contracts in the data reported through Tuesday. This was a weekly fall of -20,128 contracts from the previous week which had a total of -388,980 net contracts.
This week’s current strength score (the trader positioning range over the past three years, measured from 0 to 100) shows the speculators are currently Bearish-Extreme with a score of 14.8 percent. The commercials are Bullish with a score of 76.0 percent and the small traders (not shown in chart) are Bullish-Extreme with a score of 98.5 percent.
| Ultra US Treasury Bonds Statistics | SPECULATORS | COMMERCIALS | SMALL TRADERS |
| – Percent of Open Interest Longs: | 5.5 | 80.7 | 12.2 |
| – Percent of Open Interest Shorts: | 32.1 | 57.9 | 8.4 |
| – Net Position: | -409,108 | 350,435 | 58,673 |
| – Gross Longs: | 84,063 | 1,239,774 | 187,318 |
| – Gross Shorts: | 493,171 | 889,339 | 128,645 |
| – Long to Short Ratio: | 0.2 to 1 | 1.4 to 1 | 1.5 to 1 |
| NET POSITION TREND: | |||
| – Strength Index Score (3 Year Range Pct): | 14.8 | 76.0 | 98.5 |
| – Strength Index Reading (3 Year Range): | Bearish-Extreme | Bullish | Bullish-Extreme |
| NET POSITION MOVEMENT INDEX: | |||
| – 6-Week Change in Strength Index: | -4.2 | 0.9 | 8.1 |
Article By InvestMacro – Receive our weekly COT Newsletter
*COT Report: The COT data, released weekly to the public each Friday, is updated through the most recent Tuesday (data is 3 days old) and shows a quick view of how large speculators or non-commercials (for-profit traders) were positioned in the futures markets.
The CFTC categorizes trader positions according to commercial hedgers (traders who use futures contracts for hedging as part of the business), non-commercials (large traders who speculate to realize trading profits) and nonreportable traders (usually small traders/speculators) as well as their open interest (contracts open in the market at time of reporting). See CFTC criteria here.


