By InvestMacro
Here are the latest charts and statistics for the Commitment of Traders (COT) reports data published by the Commodities Futures Trading Commission (CFTC).
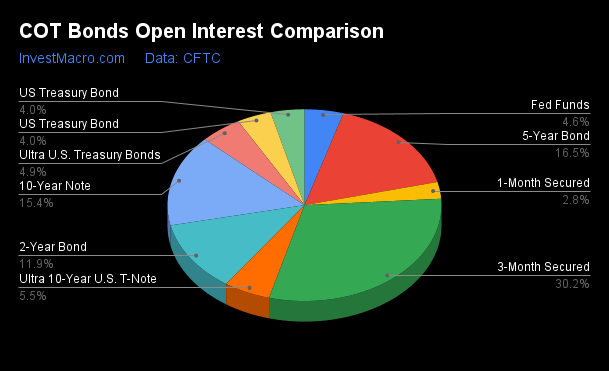
The latest COT data is updated through Monday July 3rd and shows a quick view of how large traders (for-profit speculators and commercial hedgers) were positioned in the futures markets.
The COT bond market speculator bets were lower this week as one out of the eight bond markets we cover had higher positioning while the other seven markets had lower speculator contracts.
Free Reports:
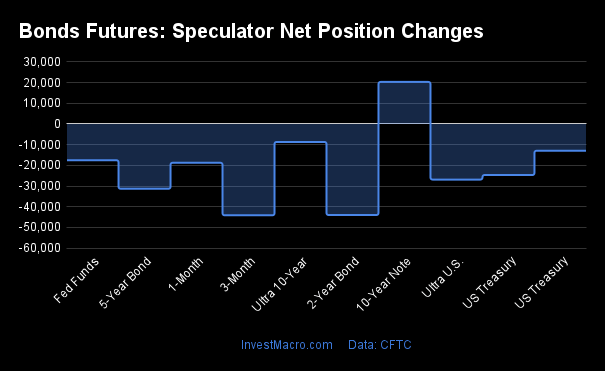
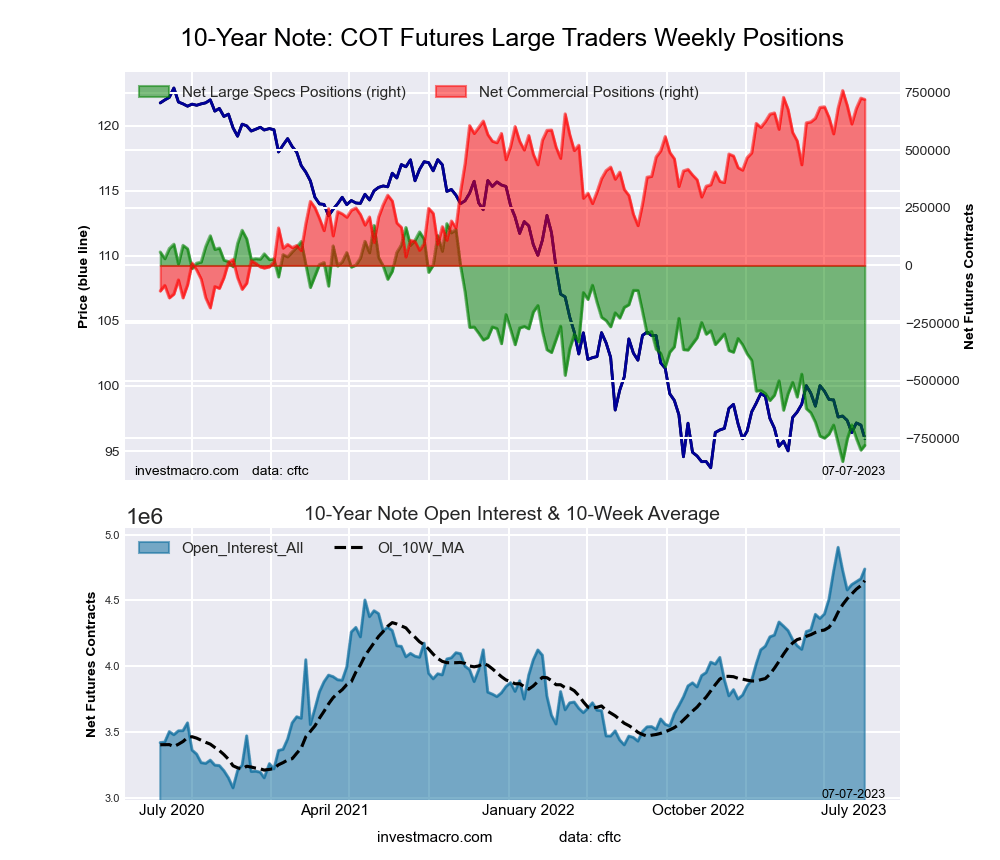
The only market with gains for the bond category was the 10-Year Bonds with a total rise of 20,321 contracts.
The bond markets with declines in speculator bets for the week were the SOFR 3-Months (-44,151 contracts), the 2-Year Bonds (-44,022 contracts), 5-Year Bonds (-31,326 contracts), the US Treasury Bonds (-24,681 contracts), the Ultra Treasury Bonds (-26,881 contracts), the Fed Funds (-17,553 contracts) and the Ultra 10-Year Bonds (-8,713 contracts) also registering lower bets on the week.
| Jul-03-2023 | OI | OI-Index | Spec-Net | Spec-Index | Com-Net | COM-Index | Smalls-Net | Smalls-Index |
|---|---|---|---|---|---|---|---|---|
| SOFR-3-Months | 9,300,042 | 89 | 239,839 | 97 | -233,436 | 2 | -6,403 | 84 |
| FedFunds | 1,414,525 | 39 | -106,758 | 34 | 115,921 | 66 | -9,163 | 73 |
| 2-Year | 3,667,737 | 100 | -1,058,426 | 0 | 970,602 | 100 | 87,824 | 97 |
| Long T-Bond | 1,242,918 | 63 | -139,929 | 39 | 106,742 | 49 | 33,187 | 73 |
| 10-Year | 4,737,762 | 91 | -780,678 | 7 | 719,909 | 96 | 60,769 | 87 |
| 5-Year | 5,080,610 | 99 | -1,029,814 | 0 | 1,026,687 | 100 | 3,127 | 82 |
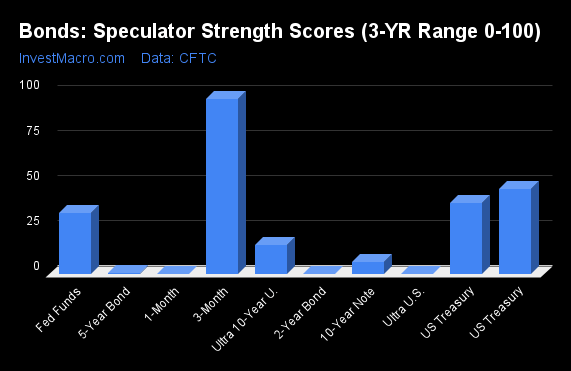
COT Strength Scores (a normalized measure of Speculator positions over a 3-Year range, from 0 to 100 where above 80 is Extreme-Bullish and below 20 is Extreme-Bearish) showed that the SOFR 3-Months (97 percent). The US Treasury Bonds (39 percent) and the Fed Funds (34 percent) come in as the next highest in the weekly strength scores.
On the downside, the Ultra Treasury Bonds (0 percent), the 5-Year Bonds (0 percent), the 2-Year Bonds (0 percent) and the 10-Year Bonds (7 percent) come in at the lowest strength level currently and are in Extreme-Bearish territory (below 20 percent).
Strength Statistics:
Fed Funds (33.5 percent) vs Fed Funds previous week (36.3 percent)
2-Year Bond (0.0 percent) vs 2-Year Bond previous week (3.8 percent)
5-Year Bond (0.5 percent) vs 5-Year Bond previous week (3.3 percent)
10-Year Bond (6.8 percent) vs 10-Year Bond previous week (4.8 percent)
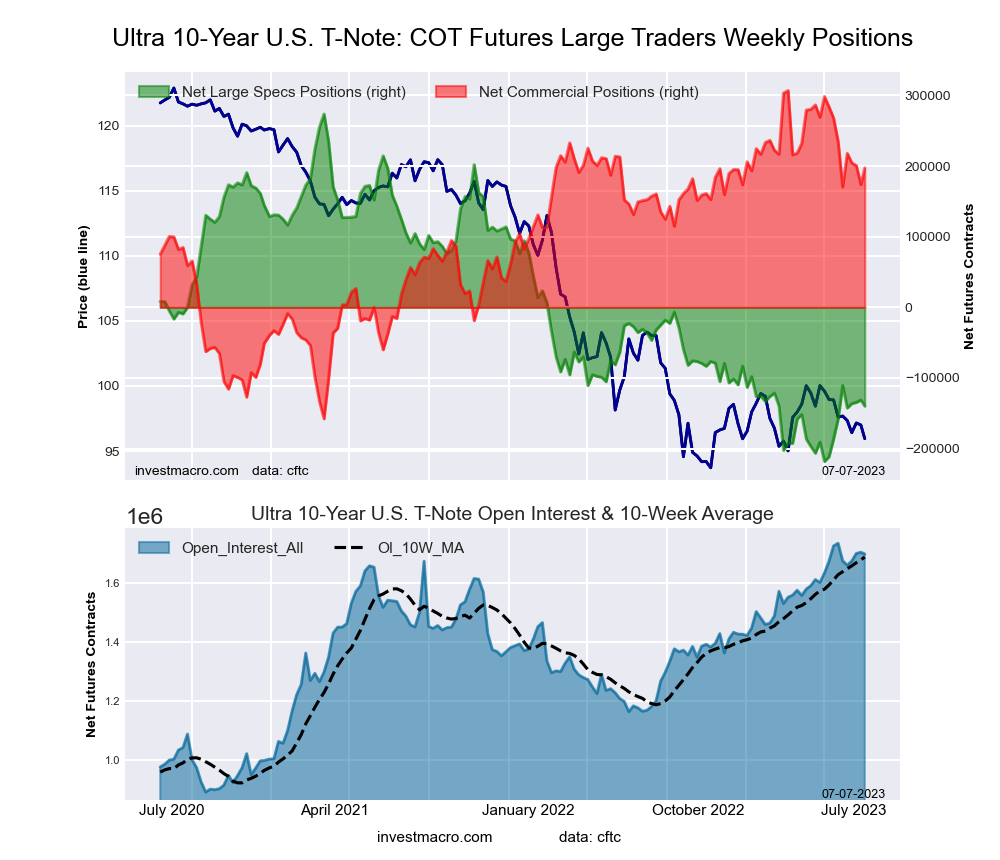
Ultra 10-Year Bond (15.9 percent) vs Ultra 10-Year Bond previous week (17.7 percent)
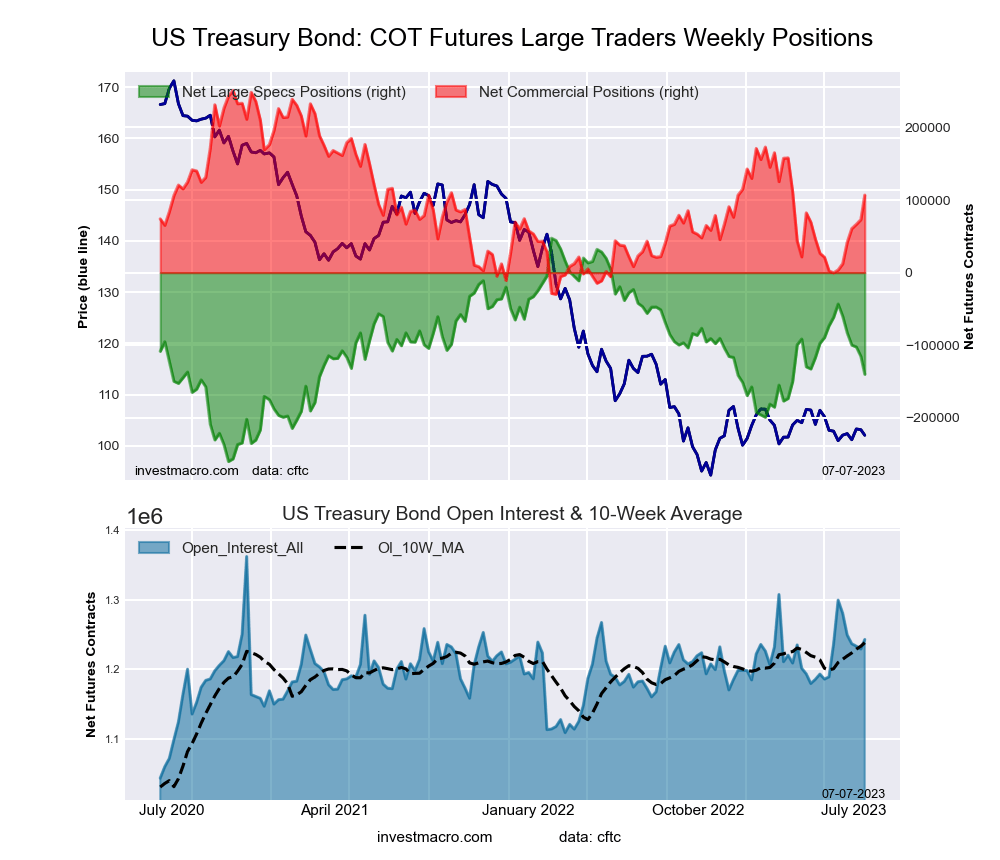
US Treasury Bond (39.1 percent) vs US Treasury Bond previous week (47.1 percent)
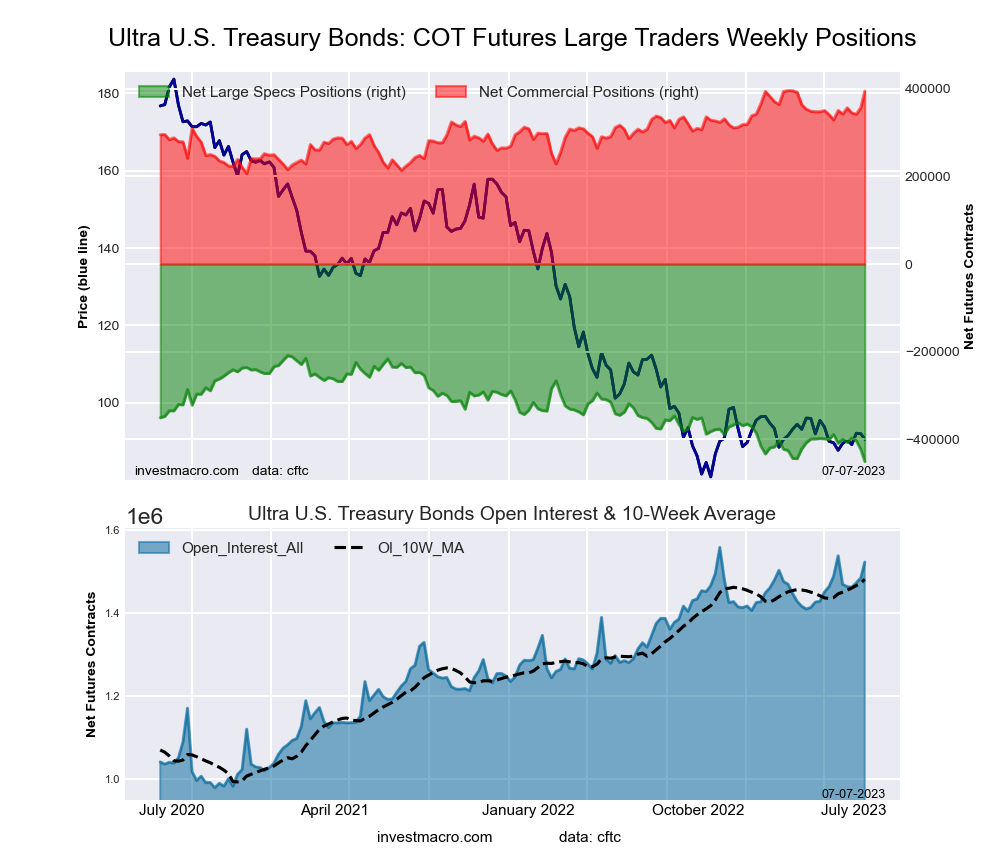
Ultra US Treasury Bond (0.0 percent) vs Ultra US Treasury Bond previous week (11.1 percent)
SOFR 3-Months (97.0 percent) vs SOFR 3-Months previous week (100.0 percent)
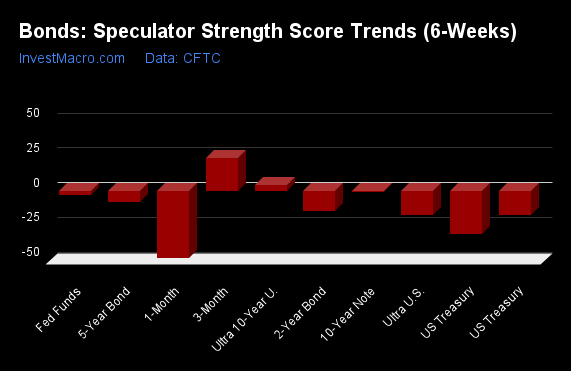
COT Strength Score Trends (or move index, calculates the 6-week changes in strength scores) showed that the SOFR 3-Months (24 percent) and the Ultra 10-Year Bonds (4 percent) lead the past six weeks trends for bonds. The 10-Year Bonds (-1 percent) and the are the next highest positive movers in the latest trends data.
The US Treasury Bonds (-31 percent), the Ultra Treasury Bonds (-17 percent) and the 2-Year Bonds (-15 percent) lead the downside trend scores currently.
Strength Trend Statistics:
Fed Funds (-2.9 percent) vs Fed Funds previous week (-3.4 percent)
2-Year Bond (-14.7 percent) vs 2-Year Bond previous week (-14.0 percent)
5-Year Bond (-8.5 percent) vs 5-Year Bond previous week (-6.6 percent)
10-Year Bond (-0.9 percent) vs 10-Year Bond previous week (-10.5 percent)
Ultra 10-Year Bond (3.7 percent) vs Ultra 10-Year Bond previous week (11.2 percent)
US Treasury Bond (-31.5 percent) vs US Treasury Bond previous week (-17.5 percent)
Ultra US Treasury Bond (-17.2 percent) vs Ultra US Treasury Bond previous week (-14.4 percent)
SOFR 3-Months (23.5 percent) vs SOFR 3-Months previous week (31.1 percent)
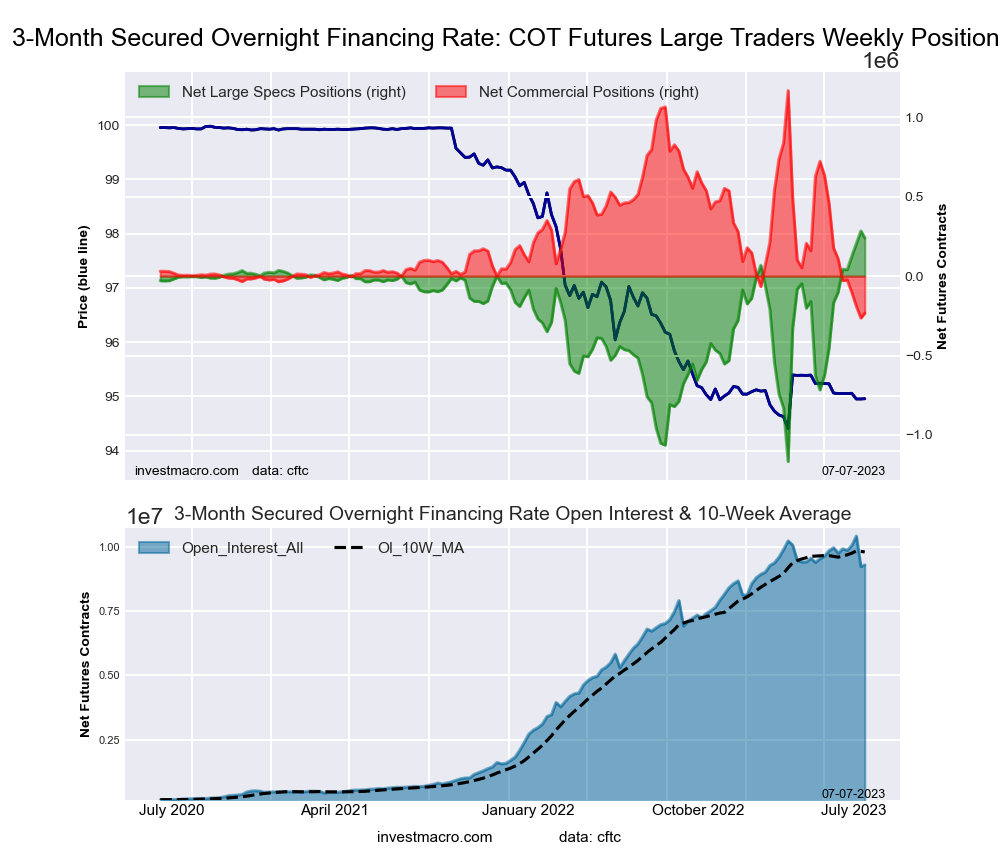
This week’s current strength score (the trader positioning range over the past three years, measured from 0 to 100) shows the speculators are currently Bullish-Extreme with a score of 97.0 percent. The commercials are Bearish-Extreme with a score of 2.1 percent and the small traders (not shown in chart) are Bullish-Extreme with a score of 84.4 percent.
Our weekly trend-following model classifies the current market price position as: Weak Uptrend. The current action for the model is considered to be: Hold – Maintain Long Position.
| SOFR 3-Months Statistics | SPECULATORS | COMMERCIALS | SMALL TRADERS |
| – Percent of Open Interest Longs: | 20.2 | 58.6 | 0.3 |
| – Percent of Open Interest Shorts: | 17.6 | 61.1 | 0.4 |
| – Net Position: | 239,839 | -233,436 | -6,403 |
| – Gross Longs: | 1,880,577 | 5,453,300 | 28,213 |
| – Gross Shorts: | 1,640,738 | 5,686,736 | 34,616 |
| – Long to Short Ratio: | 1.1 to 1 | 1.0 to 1 | 0.8 to 1 |
| NET POSITION TREND: | |||
| – Strength Index Score (3 Year Range Pct): | 97.0 | 2.1 | 84.4 |
| – Strength Index Reading (3 Year Range): | Bullish-Extreme | Bearish-Extreme | Bullish-Extreme |
| NET POSITION MOVEMENT INDEX: | |||
| – 6-Week Change in Strength Index: | 23.5 | -23.9 | 0.5 |
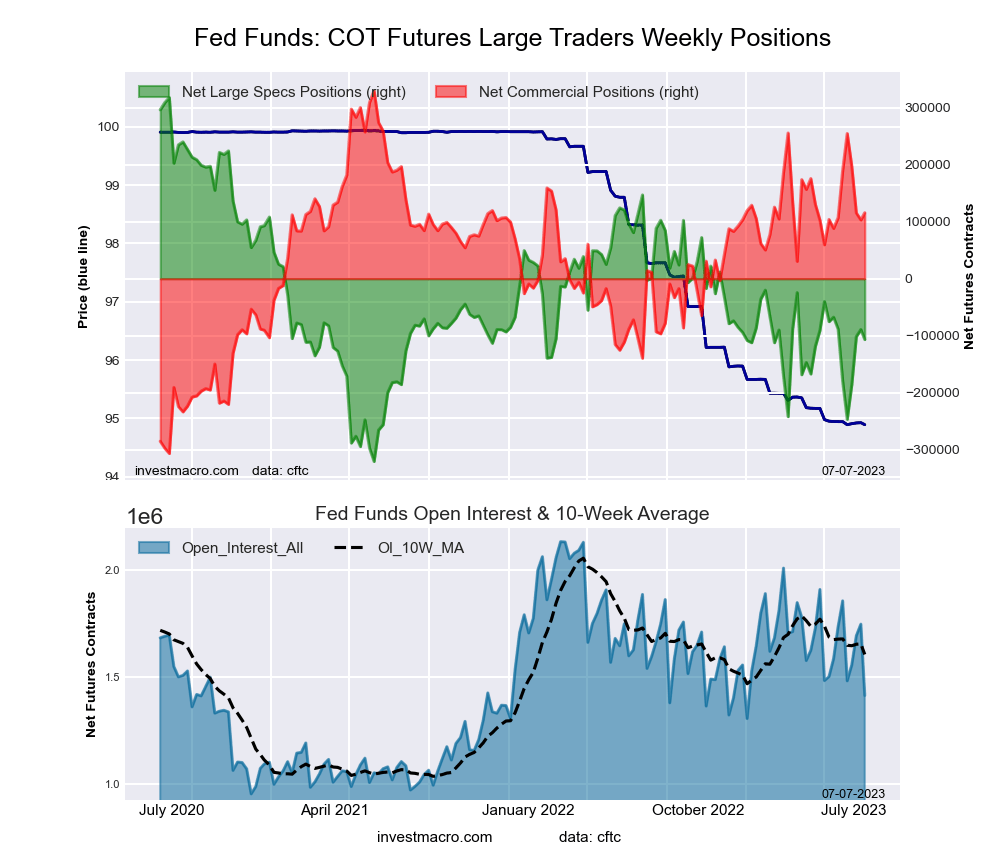
This week’s current strength score (the trader positioning range over the past three years, measured from 0 to 100) shows the speculators are currently Bearish with a score of 33.5 percent. The commercials are Bullish with a score of 66.3 percent and the small traders (not shown in chart) are Bullish with a score of 73.0 percent.
Our weekly trend-following model classifies the current market price position as: Downtrend. The current action for the model is considered to be: Hold – Maintain Short Position.
| 30-Day Federal Funds Statistics | SPECULATORS | COMMERCIALS | SMALL TRADERS |
| – Percent of Open Interest Longs: | 6.5 | 72.0 | 2.5 |
| – Percent of Open Interest Shorts: | 14.0 | 63.8 | 3.1 |
| – Net Position: | -106,758 | 115,921 | -9,163 |
| – Gross Longs: | 91,610 | 1,018,379 | 35,112 |
| – Gross Shorts: | 198,368 | 902,458 | 44,275 |
| – Long to Short Ratio: | 0.5 to 1 | 1.1 to 1 | 0.8 to 1 |
| NET POSITION TREND: | |||
| – Strength Index Score (3 Year Range Pct): | 33.5 | 66.3 | 73.0 |
| – Strength Index Reading (3 Year Range): | Bearish | Bullish | Bullish |
| NET POSITION MOVEMENT INDEX: | |||
| – 6-Week Change in Strength Index: | -2.9 | 1.4 | 18.9 |
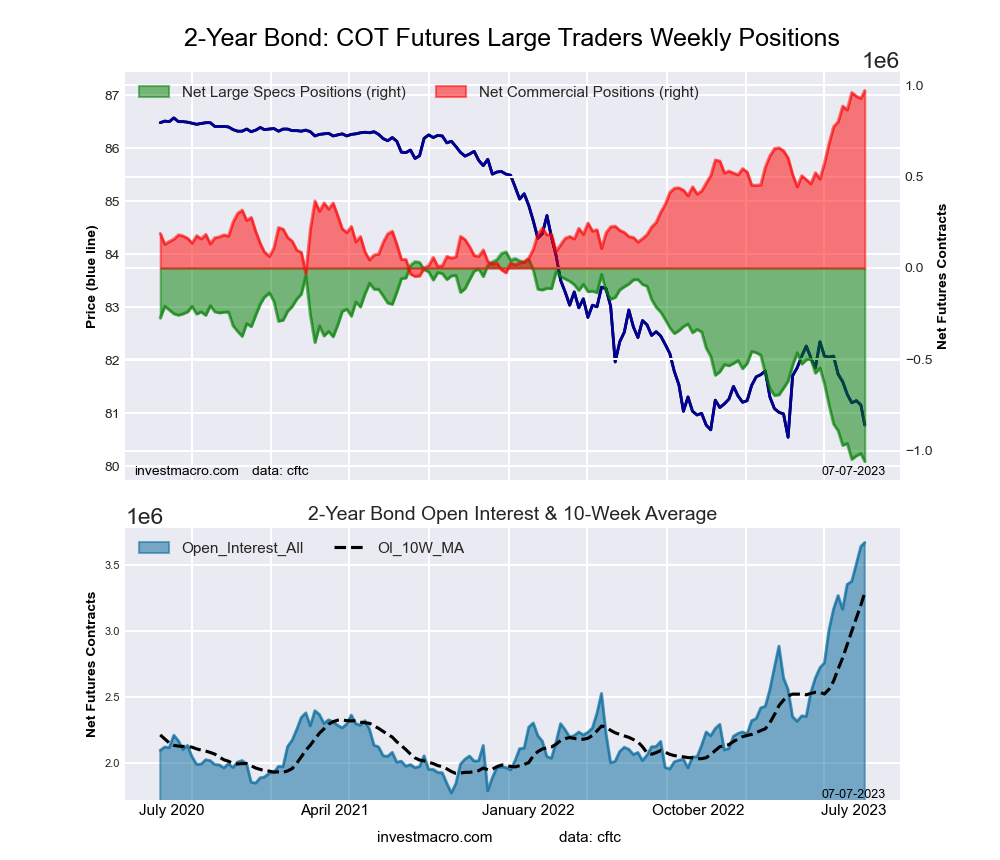
This week’s current strength score (the trader positioning range over the past three years, measured from 0 to 100) shows the speculators are currently Bearish-Extreme with a score of 0.0 percent. The commercials are Bullish-Extreme with a score of 100.0 percent and the small traders (not shown in chart) are Bullish-Extreme with a score of 96.6 percent.
Our weekly trend-following model classifies the current market price position as: Strong Downtrend. The current action for the model is considered to be: Hold – Maintain Short Position.
| 2-Year Treasury Note Statistics | SPECULATORS | COMMERCIALS | SMALL TRADERS |
| – Percent of Open Interest Longs: | 11.1 | 81.2 | 6.6 |
| – Percent of Open Interest Shorts: | 39.9 | 54.7 | 4.2 |
| – Net Position: | -1,058,426 | 970,602 | 87,824 |
| – Gross Longs: | 405,459 | 2,977,688 | 241,676 |
| – Gross Shorts: | 1,463,885 | 2,007,086 | 153,852 |
| – Long to Short Ratio: | 0.3 to 1 | 1.5 to 1 | 1.6 to 1 |
| NET POSITION TREND: | |||
| – Strength Index Score (3 Year Range Pct): | 0.0 | 100.0 | 96.6 |
| – Strength Index Reading (3 Year Range): | Bearish-Extreme | Bullish-Extreme | Bullish-Extreme |
| NET POSITION MOVEMENT INDEX: | |||
| – 6-Week Change in Strength Index: | -14.7 | 16.7 | -0.9 |
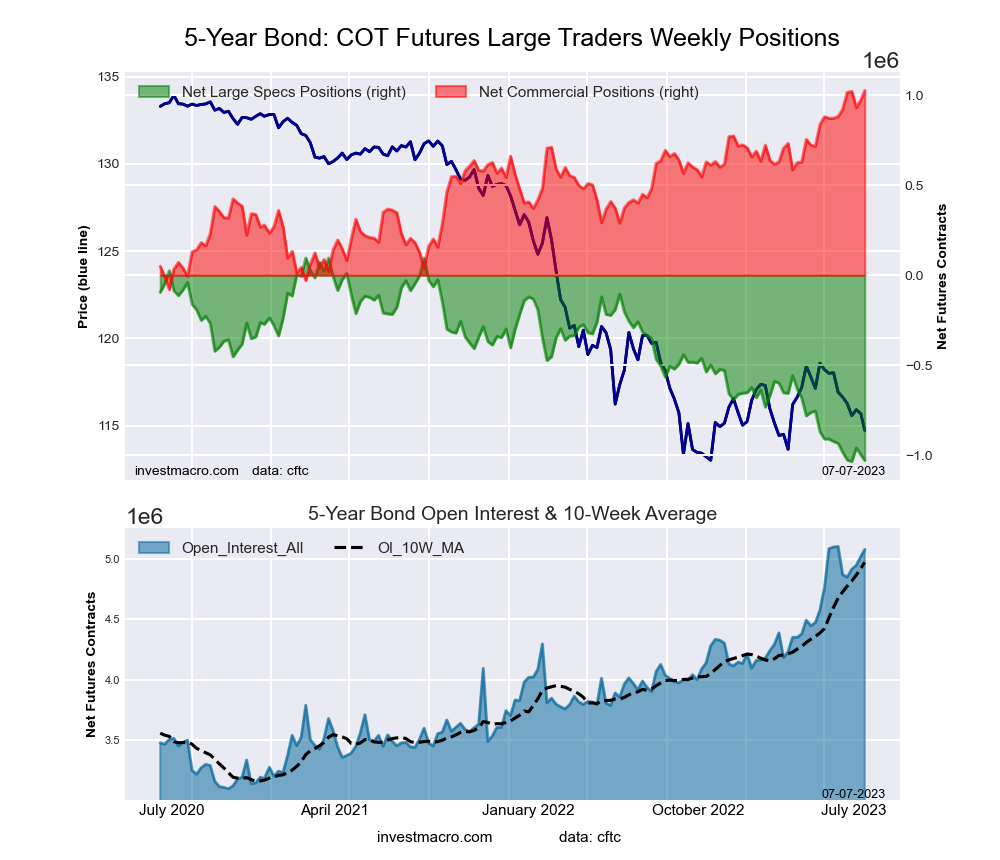
This week’s current strength score (the trader positioning range over the past three years, measured from 0 to 100) shows the speculators are currently Bearish-Extreme with a score of 0.5 percent. The commercials are Bullish-Extreme with a score of 100.0 percent and the small traders (not shown in chart) are Bullish-Extreme with a score of 81.9 percent.
Our weekly trend-following model classifies the current market price position as: Strong Downtrend. The current action for the model is considered to be: New Sell – Short Position.
| 5-Year Treasury Note Statistics | SPECULATORS | COMMERCIALS | SMALL TRADERS |
| – Percent of Open Interest Longs: | 6.9 | 84.6 | 7.3 |
| – Percent of Open Interest Shorts: | 27.1 | 64.4 | 7.3 |
| – Net Position: | -1,029,814 | 1,026,687 | 3,127 |
| – Gross Longs: | 348,230 | 4,297,985 | 373,393 |
| – Gross Shorts: | 1,378,044 | 3,271,298 | 370,266 |
| – Long to Short Ratio: | 0.3 to 1 | 1.3 to 1 | 1.0 to 1 |
| NET POSITION TREND: | |||
| – Strength Index Score (3 Year Range Pct): | 0.5 | 100.0 | 81.9 |
| – Strength Index Reading (3 Year Range): | Bearish-Extreme | Bullish-Extreme | Bullish-Extreme |
| NET POSITION MOVEMENT INDEX: | |||
| – 6-Week Change in Strength Index: | -8.5 | 13.0 | -13.3 |
This week’s current strength score (the trader positioning range over the past three years, measured from 0 to 100) shows the speculators are currently Bearish-Extreme with a score of 6.8 percent. The commercials are Bullish-Extreme with a score of 95.9 percent and the small traders (not shown in chart) are Bullish-Extreme with a score of 86.7 percent.
Our weekly trend-following model classifies the current market price position as: Strong Downtrend. The current action for the model is considered to be: New Sell – Short Position.
| 10-Year Treasury Note Statistics | SPECULATORS | COMMERCIALS | SMALL TRADERS |
| – Percent of Open Interest Longs: | 9.2 | 80.2 | 8.8 |
| – Percent of Open Interest Shorts: | 25.6 | 65.0 | 7.6 |
| – Net Position: | -780,678 | 719,909 | 60,769 |
| – Gross Longs: | 434,456 | 3,798,675 | 418,993 |
| – Gross Shorts: | 1,215,134 | 3,078,766 | 358,224 |
| – Long to Short Ratio: | 0.4 to 1 | 1.2 to 1 | 1.2 to 1 |
| NET POSITION TREND: | |||
| – Strength Index Score (3 Year Range Pct): | 6.8 | 95.9 | 86.7 |
| – Strength Index Reading (3 Year Range): | Bearish-Extreme | Bullish-Extreme | Bullish-Extreme |
| NET POSITION MOVEMENT INDEX: | |||
| – 6-Week Change in Strength Index: | -0.9 | 4.0 | -6.2 |
This week’s current strength score (the trader positioning range over the past three years, measured from 0 to 100) shows the speculators are currently Bearish-Extreme with a score of 15.9 percent. The commercials are Bullish with a score of 76.4 percent and the small traders (not shown in chart) are Bullish with a score of 79.9 percent.
Our weekly trend-following model classifies the current market price position as: Weak Uptrend. The current action for the model is considered to be: Hold – Maintain Long Position.
| Ultra 10-Year Notes Statistics | SPECULATORS | COMMERCIALS | SMALL TRADERS |
| – Percent of Open Interest Longs: | 9.9 | 76.8 | 11.8 |
| – Percent of Open Interest Shorts: | 18.1 | 65.2 | 15.2 |
| – Net Position: | -139,901 | 197,302 | -57,401 |
| – Gross Longs: | 168,089 | 1,304,780 | 201,280 |
| – Gross Shorts: | 307,990 | 1,107,478 | 258,681 |
| – Long to Short Ratio: | 0.5 to 1 | 1.2 to 1 | 0.8 to 1 |
| NET POSITION TREND: | |||
| – Strength Index Score (3 Year Range Pct): | 15.9 | 76.4 | 79.9 |
| – Strength Index Reading (3 Year Range): | Bearish-Extreme | Bullish | Bullish |
| NET POSITION MOVEMENT INDEX: | |||
| – 6-Week Change in Strength Index: | 3.7 | -8.1 | 11.5 |
This week’s current strength score (the trader positioning range over the past three years, measured from 0 to 100) shows the speculators are currently Bearish with a score of 39.1 percent. The commercials are Bearish with a score of 48.7 percent and the small traders (not shown in chart) are Bullish with a score of 72.6 percent.
Our weekly trend-following model classifies the current market price position as: Strong Downtrend. The current action for the model is considered to be: Hold – Maintain Short Position.
| US Treasury Bonds Statistics | SPECULATORS | COMMERCIALS | SMALL TRADERS |
| – Percent of Open Interest Longs: | 5.7 | 79.3 | 14.3 |
| – Percent of Open Interest Shorts: | 16.9 | 70.7 | 11.6 |
| – Net Position: | -139,929 | 106,742 | 33,187 |
| – Gross Longs: | 70,648 | 985,219 | 177,299 |
| – Gross Shorts: | 210,577 | 878,477 | 144,112 |
| – Long to Short Ratio: | 0.3 to 1 | 1.1 to 1 | 1.2 to 1 |
| NET POSITION TREND: | |||
| – Strength Index Score (3 Year Range Pct): | 39.1 | 48.7 | 72.6 |
| – Strength Index Reading (3 Year Range): | Bearish | Bearish | Bullish |
| NET POSITION MOVEMENT INDEX: | |||
| – 6-Week Change in Strength Index: | -31.5 | 36.7 | -4.6 |
This week’s current strength score (the trader positioning range over the past three years, measured from 0 to 100) shows the speculators are currently Bearish-Extreme with a score of 0.0 percent. The commercials are Bullish-Extreme with a score of 99.2 percent and the small traders (not shown in chart) are Bullish-Extreme with a score of 90.3 percent.
Our weekly trend-following model classifies the current market price position as: Strong Downtrend. The current action for the model is considered to be: Hold – Maintain Short Position.
| Ultra US Treasury Bonds Statistics | SPECULATORS | COMMERCIALS | SMALL TRADERS |
| – Percent of Open Interest Longs: | 4.6 | 83.6 | 11.5 |
| – Percent of Open Interest Shorts: | 34.2 | 57.7 | 7.8 |
| – Net Position: | -450,572 | 394,354 | 56,218 |
| – Gross Longs: | 69,955 | 1,272,590 | 174,627 |
| – Gross Shorts: | 520,527 | 878,236 | 118,409 |
| – Long to Short Ratio: | 0.1 to 1 | 1.4 to 1 | 1.5 to 1 |
| NET POSITION TREND: | |||
| – Strength Index Score (3 Year Range Pct): | 0.0 | 99.2 | 90.3 |
| – Strength Index Reading (3 Year Range): | Bearish-Extreme | Bullish-Extreme | Bullish-Extreme |
| NET POSITION MOVEMENT INDEX: | |||
| – 6-Week Change in Strength Index: | -17.2 | 23.2 | -2.3 |
Article By InvestMacro – Receive our weekly COT Newsletter
*COT Report: The COT data, released weekly to the public each Friday, is updated through the most recent Tuesday (data is 3 days old) and shows a quick view of how large speculators or non-commercials (for-profit traders) were positioned in the futures markets.
The CFTC categorizes trader positions according to commercial hedgers (traders who use futures contracts for hedging as part of the business), non-commercials (large traders who speculate to realize trading profits) and nonreportable traders (usually small traders/speculators) as well as their open interest (contracts open in the market at time of reporting). See CFTC criteria here.
By JustMarkets The US stock indices started the week on a downbeat note. By the…
By Analytical Department RoboForex GBP/USD fell to 1.3437 on Tuesday as investors assessed the appointment…
By JustMarkets The US stock indices ended Friday’s session in the red. By the end…
By Analytical Department RoboForex USD/JPY opens the week at 162.36 on Monday. The Japanese yen…
By InvestMacro Here are the latest charts and statistics for the Commitment of Traders (COT)…
By InvestMacro The latest update for the weekly Commitment of Traders (COT) report was released…
This website uses cookies.