By InvestMacro
Here are the latest charts and statistics for the Commitment of Traders (COT) reports data published by the Commodities Futures Trading Commission (CFTC).
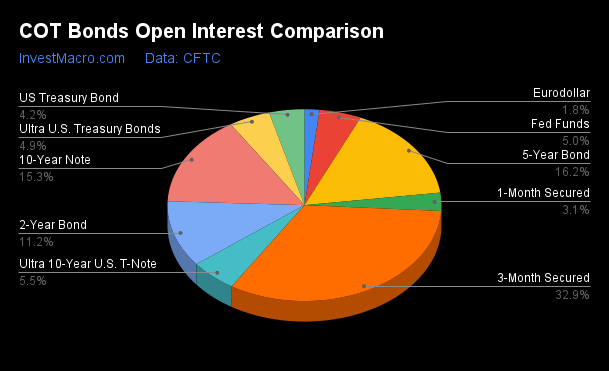
The latest COT data is updated through Tuesday June 6th and shows a quick view of how large traders (for-profit speculators and commercial hedgers) were positioned in the futures markets.
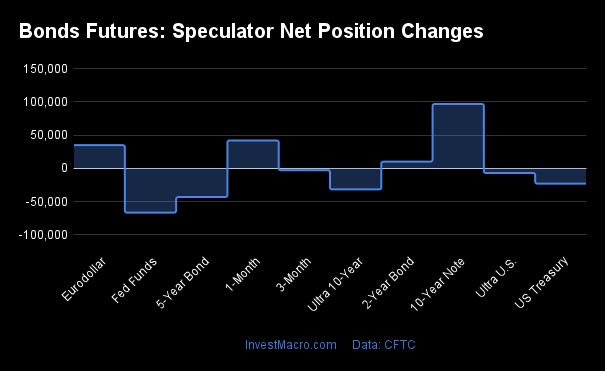
The COT bond market speculator bets were lower this week as three out of the nine bond markets we cover had higher positioning while the other six markets had lower speculator contracts.
Free Reports:
Leading the gains for the bond markets was the 10-Year Bonds (96,720 contracts) with the Eurodollar (34,765 contracts) and the 2-Year Bonds (9,962 contracts) also showing positive weeks.
The bond markets with declines in speculator bets for the week were the Fed Funds (-66,703 contracts), the Ultra 10-Year Bonds (-31,783 contracts), the 5-Year Bonds (-43,222 contracts), the US Treasury Bonds (-23,013 contracts), the Ultra Treasury Bonds (-7,099 contracts) and the SOFR 3-Months (-2,917 contracts) also registering lower bets on the week.
| Jun-06-2023 | OI | OI-Index | Spec-Net | Spec-Index | Com-Net | COM-Index | Smalls-Net | Smalls-Index |
|---|---|---|---|---|---|---|---|---|
| Eurodollar | 527,383 | 0 | -3,045 | 74 | 13,104 | 22 | -10,059 | 97 |
| FedFunds | 1,482,369 | 45 | -246,858 | 9 | 255,064 | 91 | -8,206 | 75 |
| 2-Year | 3,351,277 | 100 | -959,901 | 1 | 864,871 | 98 | 95,030 | 100 |
| Long T-Bond | 1,249,240 | 70 | -82,926 | 58 | 41,862 | 26 | 41,064 | 78 |
| 10-Year | 4,578,932 | 82 | -753,701 | 9 | 693,419 | 93 | 60,282 | 87 |
| 5-Year | 4,850,014 | 87 | -1,027,059 | 0 | 1,016,651 | 100 | 10,408 | 84 |
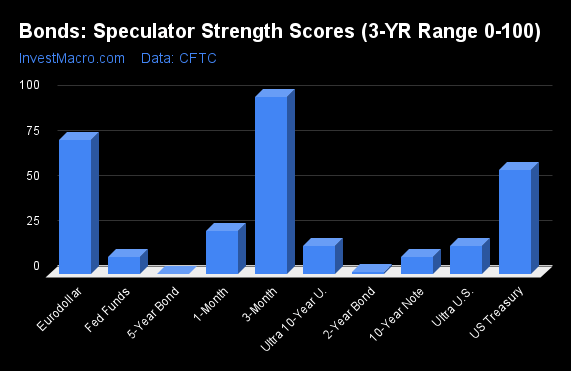
COT Strength Scores (a normalized measure of Speculator positions over a 3-Year range, from 0 to 100 where above 80 is Extreme-Bullish and below 20 is Extreme-Bearish) showed that the SOFR 3-Months (98 percent) and the Eurodollar (74 percent) lead the bond markets this week. The US Treasury Bonds (58 percent) comes in as the next highest in the weekly strength scores.
On the downside, the 5-Year Bonds (0 percent), the 2-Year Bonds (1 percent), the 10-Year Bonds (9 percent), the Fed Funds (9 percent), the Ultra 10-Year Bond (15.4 percent) and the Ultra US Treasury Bond (15.7 percent) come in at the lowest strength levels currently and are all in Extreme-Bearish territory (below 20 percent).
Strength Statistics:
Fed Funds (9.4 percent) vs Fed Funds previous week (17.9 percent)
2-Year Bond (0.9 percent) vs 2-Year Bond previous week (0.0 percent)
5-Year Bond (0.0 percent) vs 5-Year Bond previous week (3.9 percent)
10-Year Bond (9.4 percent) vs 10-Year Bond previous week (0.0 percent)
Ultra 10-Year Bond (15.4 percent) vs Ultra 10-Year Bond previous week (21.9 percent)
US Treasury Bond (57.6 percent) vs US Treasury Bond previous week (65.1 percent)
Ultra US Treasury Bond (15.7 percent) vs Ultra US Treasury Bond previous week (18.7 percent)
Eurodollar (74.0 percent) vs Eurodollar previous week (73.1 percent)
SOFR 3-Months (97.8 percent) vs SOFR 3-Months previous week (98.0 percent)
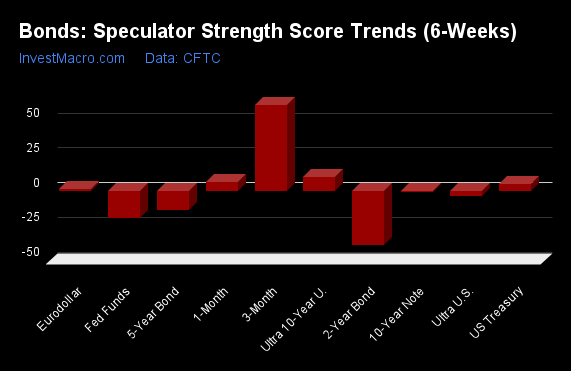
COT Strength Score Trends (or move index, calculates the 6-week changes in strength scores) showed that the SOFR 3-Months (61 percent) and the Ultra 10-Year Bonds (10 percent) lead the past six weeks trends for bonds. The US Treasury Bonds (5 percent) is the next highest positive mover in the latest trends data.
The 2-Year Bond (-39 percent), the Fed Funds (-20 percent) and the 5-Year Bonds (-14 percent) lead the downside trend scores currently.
Strength Trend Statistics:
Fed Funds (-19.8 percent) vs Fed Funds previous week (-7.8 percent)
2-Year Bond (-39.1 percent) vs 2-Year Bond previous week (-37.3 percent)
5-Year Bond (-14.1 percent) vs 5-Year Bond previous week (-20.4 percent)
10-Year Bond (-1.3 percent) vs 10-Year Bond previous week (-16.5 percent)
Ultra 10-Year Bond (9.8 percent) vs Ultra 10-Year Bond previous week (19.5 percent)
US Treasury Bond (4.7 percent) vs US Treasury Bond previous week (18.6 percent)
Ultra US Treasury Bond (-3.8 percent) vs Ultra US Treasury Bond previous week (-0.4 percent)
Eurodollar (1.0 percent) vs Eurodollar previous week (0.3 percent)
SOFR 3-Months (61.3 percent) vs SOFR 3-Months previous week (54.2 percent)
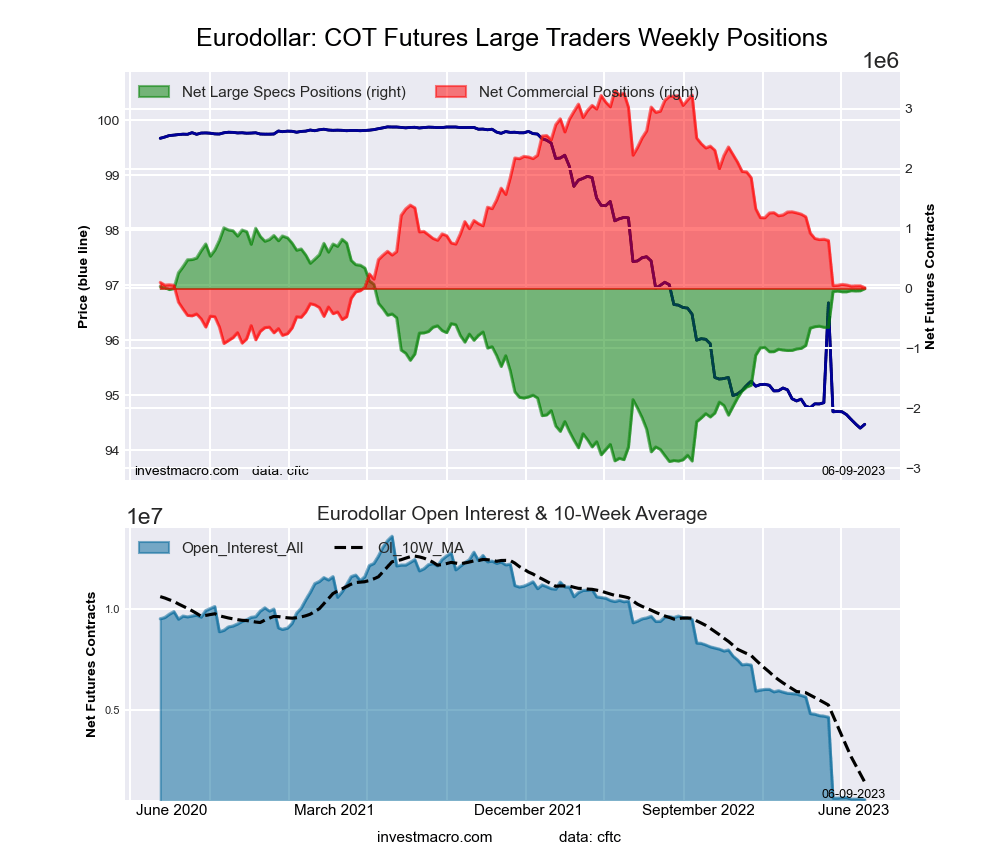
This week’s current strength score (the trader positioning range over the past three years, measured from 0 to 100) shows the speculators are currently Bullish with a score of 74.0 percent. The commercials are Bearish with a score of 22.0 percent and the small traders (not shown in chart) are Bullish-Extreme with a score of 97.1 percent.
| 3-Month Eurodollars Statistics | SPECULATORS | COMMERCIALS | SMALL TRADERS |
| – Percent of Open Interest Longs: | 26.8 | 63.6 | 9.6 |
| – Percent of Open Interest Shorts: | 27.4 | 61.1 | 11.5 |
| – Net Position: | -3,045 | 13,104 | -10,059 |
| – Gross Longs: | 141,397 | 335,311 | 50,675 |
| – Gross Shorts: | 144,442 | 322,207 | 60,734 |
| – Long to Short Ratio: | 1.0 to 1 | 1.0 to 1 | 0.8 to 1 |
| NET POSITION TREND: | |||
| – Strength Index Score (3 Year Range Pct): | 74.0 | 22.0 | 97.1 |
| – Strength Index Reading (3 Year Range): | Bullish | Bearish | Bullish-Extreme |
| NET POSITION MOVEMENT INDEX: | |||
| – 6-Week Change in Strength Index: | 1.0 | -0.9 | -0.0 |
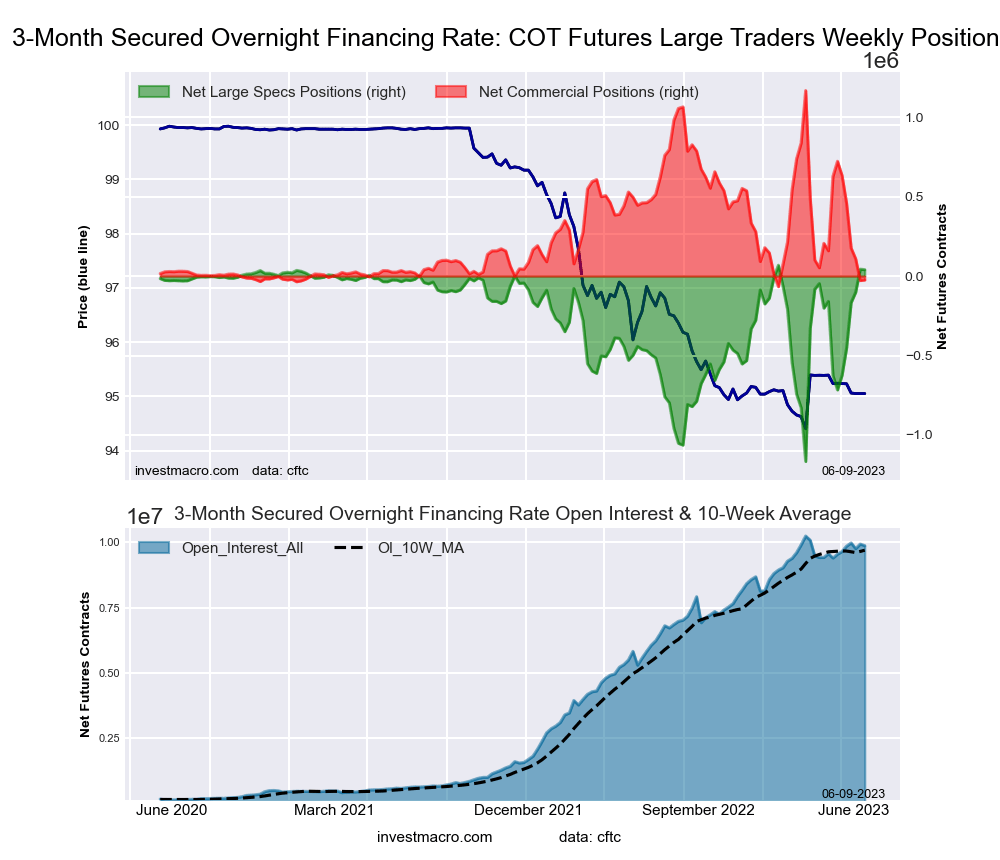
This week’s current strength score (the trader positioning range over the past three years, measured from 0 to 100) shows the speculators are currently Bullish-Extreme with a score of 97.8 percent. The commercials are Bearish-Extreme with a score of 3.4 percent and the small traders (not shown in chart) are Bullish with a score of 79.2 percent.
| SOFR 3-Months Statistics | SPECULATORS | COMMERCIALS | SMALL TRADERS |
| – Percent of Open Interest Longs: | 16.0 | 61.1 | 0.4 |
| – Percent of Open Interest Shorts: | 15.6 | 61.3 | 0.6 |
| – Net Position: | 40,305 | -24,496 | -15,809 |
| – Gross Longs: | 1,581,630 | 6,023,024 | 41,854 |
| – Gross Shorts: | 1,541,325 | 6,047,520 | 57,663 |
| – Long to Short Ratio: | 1.0 to 1 | 1.0 to 1 | 0.7 to 1 |
| NET POSITION TREND: | |||
| – Strength Index Score (3 Year Range Pct): | 97.8 | 3.4 | 79.2 |
| – Strength Index Reading (3 Year Range): | Bullish-Extreme | Bearish-Extreme | Bullish |
| NET POSITION MOVEMENT INDEX: | |||
| – 6-Week Change in Strength Index: | 61.3 | -60.5 | -5.3 |
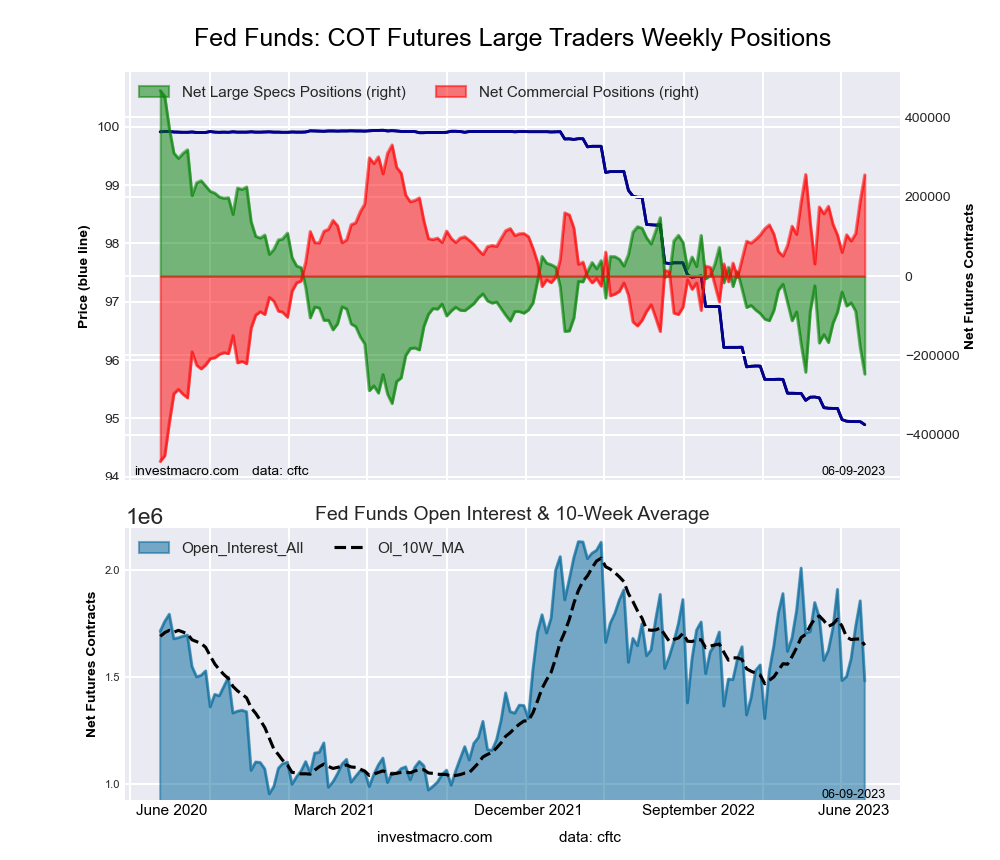
This week’s current strength score (the trader positioning range over the past three years, measured from 0 to 100) shows the speculators are currently Bearish-Extreme with a score of 9.4 percent. The commercials are Bullish-Extreme with a score of 90.5 percent and the small traders (not shown in chart) are Bullish with a score of 74.9 percent.
| 30-Day Federal Funds Statistics | SPECULATORS | COMMERCIALS | SMALL TRADERS |
| – Percent of Open Interest Longs: | 3.6 | 78.7 | 2.3 |
| – Percent of Open Interest Shorts: | 20.2 | 61.5 | 2.9 |
| – Net Position: | -246,858 | 255,064 | -8,206 |
| – Gross Longs: | 52,857 | 1,167,235 | 34,401 |
| – Gross Shorts: | 299,715 | 912,171 | 42,607 |
| – Long to Short Ratio: | 0.2 to 1 | 1.3 to 1 | 0.8 to 1 |
| NET POSITION TREND: | |||
| – Strength Index Score (3 Year Range Pct): | 9.4 | 90.5 | 74.9 |
| – Strength Index Reading (3 Year Range): | Bearish-Extreme | Bullish-Extreme | Bullish |
| NET POSITION MOVEMENT INDEX: | |||
| – 6-Week Change in Strength Index: | -19.8 | 19.1 | 8.2 |
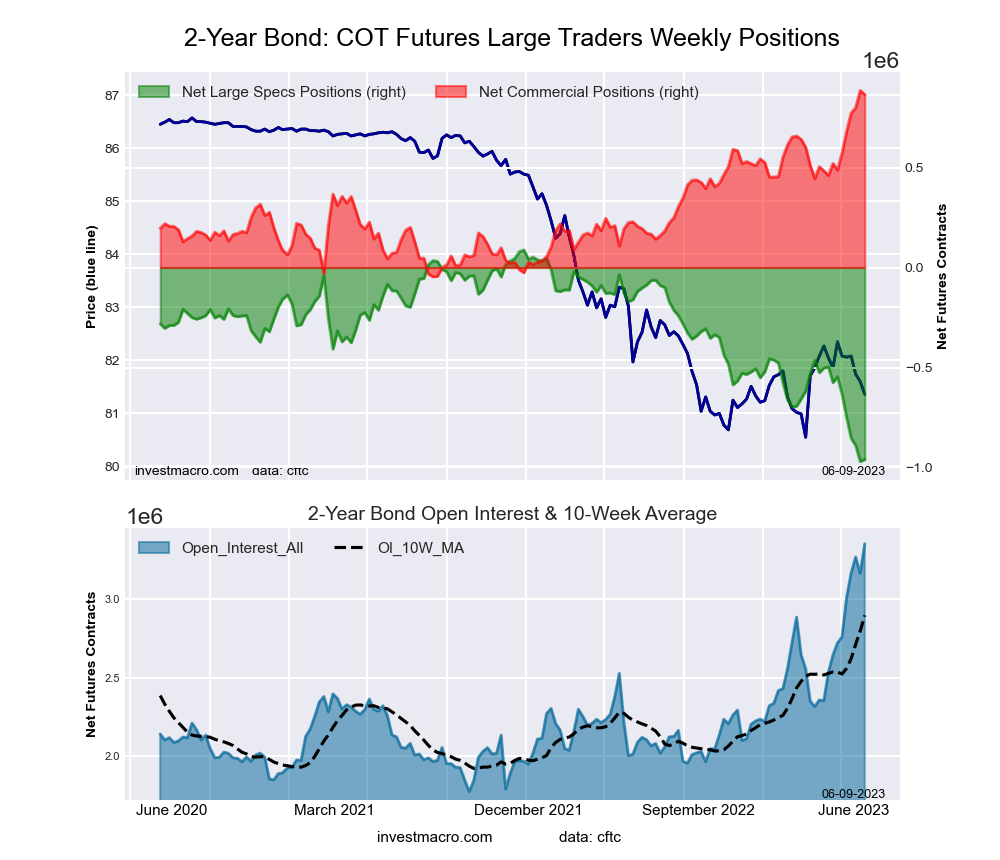
This week’s current strength score (the trader positioning range over the past three years, measured from 0 to 100) shows the speculators are currently Bearish-Extreme with a score of 0.9 percent. The commercials are Bullish-Extreme with a score of 97.8 percent and the small traders (not shown in chart) are Bullish-Extreme with a score of 100.0 percent.
| 2-Year Treasury Note Statistics | SPECULATORS | COMMERCIALS | SMALL TRADERS |
| – Percent of Open Interest Longs: | 11.1 | 80.9 | 7.2 |
| – Percent of Open Interest Shorts: | 39.7 | 55.1 | 4.3 |
| – Net Position: | -959,901 | 864,871 | 95,030 |
| – Gross Longs: | 370,970 | 2,712,847 | 240,315 |
| – Gross Shorts: | 1,330,871 | 1,847,976 | 145,285 |
| – Long to Short Ratio: | 0.3 to 1 | 1.5 to 1 | 1.7 to 1 |
| NET POSITION TREND: | |||
| – Strength Index Score (3 Year Range Pct): | 0.9 | 97.8 | 100.0 |
| – Strength Index Reading (3 Year Range): | Bearish-Extreme | Bullish-Extreme | Bullish-Extreme |
| NET POSITION MOVEMENT INDEX: | |||
| – 6-Week Change in Strength Index: | -39.1 | 40.6 | 16.8 |
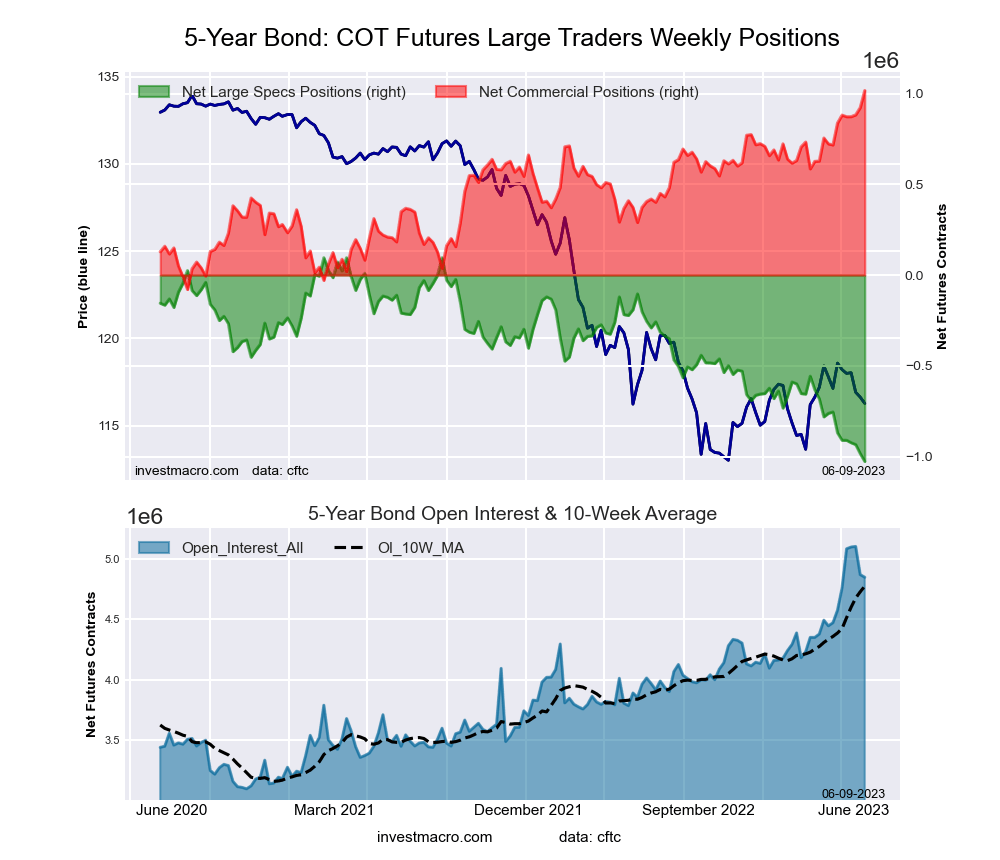
This week’s current strength score (the trader positioning range over the past three years, measured from 0 to 100) shows the speculators are currently Bearish-Extreme with a score of 0.0 percent. The commercials are Bullish-Extreme with a score of 100.0 percent and the small traders (not shown in chart) are Bullish-Extreme with a score of 83.9 percent.
| 5-Year Treasury Note Statistics | SPECULATORS | COMMERCIALS | SMALL TRADERS |
| – Percent of Open Interest Longs: | 6.7 | 84.2 | 7.4 |
| – Percent of Open Interest Shorts: | 27.9 | 63.3 | 7.2 |
| – Net Position: | -1,027,059 | 1,016,651 | 10,408 |
| – Gross Longs: | 326,795 | 4,085,049 | 359,182 |
| – Gross Shorts: | 1,353,854 | 3,068,398 | 348,774 |
| – Long to Short Ratio: | 0.2 to 1 | 1.3 to 1 | 1.0 to 1 |
| NET POSITION TREND: | |||
| – Strength Index Score (3 Year Range Pct): | 0.0 | 100.0 | 83.9 |
| – Strength Index Reading (3 Year Range): | Bearish-Extreme | Bullish-Extreme | Bullish-Extreme |
| NET POSITION MOVEMENT INDEX: | |||
| – 6-Week Change in Strength Index: | -14.1 | 16.4 | -5.9 |
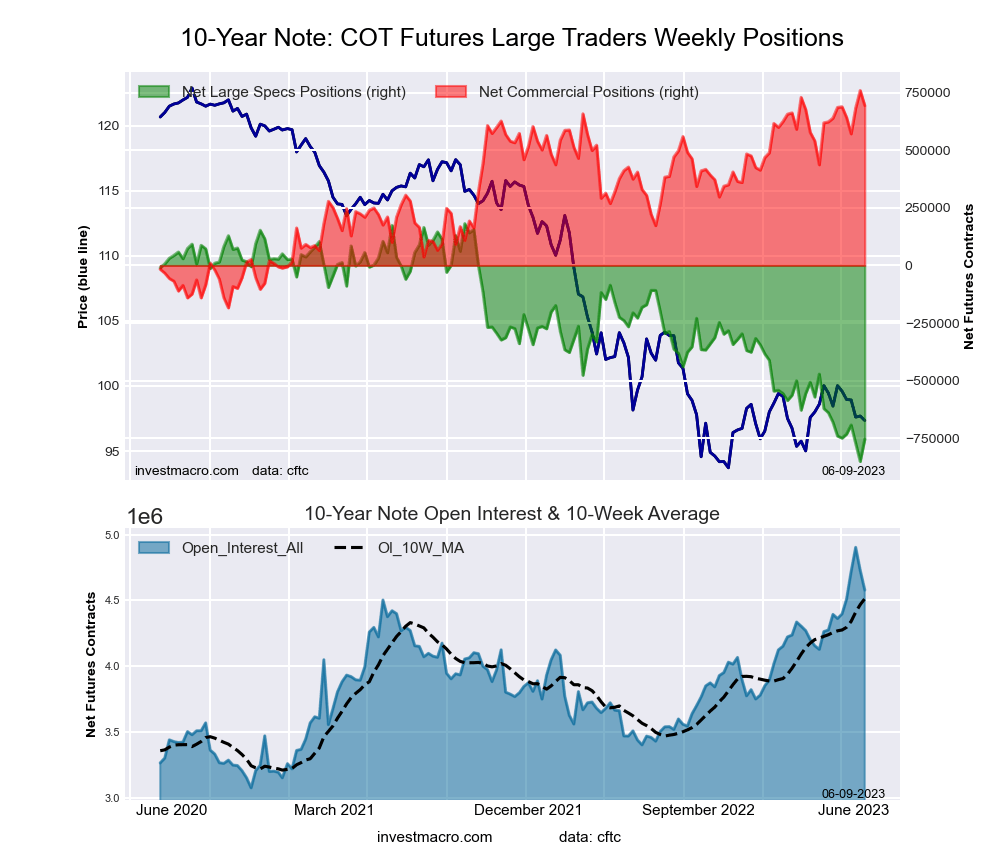
This week’s current strength score (the trader positioning range over the past three years, measured from 0 to 100) shows the speculators are currently Bearish-Extreme with a score of 9.4 percent. The commercials are Bullish-Extreme with a score of 93.1 percent and the small traders (not shown in chart) are Bullish-Extreme with a score of 86.6 percent.
| 10-Year Treasury Note Statistics | SPECULATORS | COMMERCIALS | SMALL TRADERS |
| – Percent of Open Interest Longs: | 9.0 | 80.3 | 8.7 |
| – Percent of Open Interest Shorts: | 25.4 | 65.1 | 7.4 |
| – Net Position: | -753,701 | 693,419 | 60,282 |
| – Gross Longs: | 410,777 | 3,675,457 | 397,950 |
| – Gross Shorts: | 1,164,478 | 2,982,038 | 337,668 |
| – Long to Short Ratio: | 0.4 to 1 | 1.2 to 1 | 1.2 to 1 |
| NET POSITION TREND: | |||
| – Strength Index Score (3 Year Range Pct): | 9.4 | 93.1 | 86.6 |
| – Strength Index Reading (3 Year Range): | Bearish-Extreme | Bullish-Extreme | Bullish-Extreme |
| NET POSITION MOVEMENT INDEX: | |||
| – 6-Week Change in Strength Index: | -1.3 | 0.9 | 1.1 |
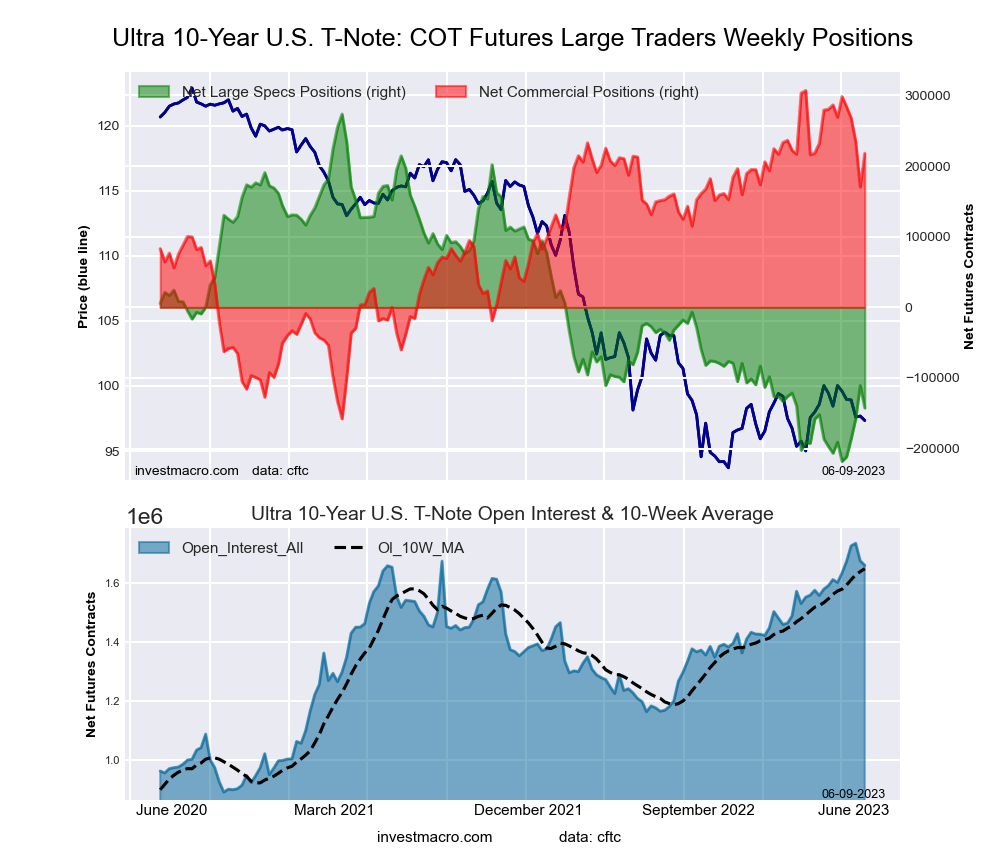
This week’s current strength score (the trader positioning range over the past three years, measured from 0 to 100) shows the speculators are currently Bearish-Extreme with a score of 15.4 percent. The commercials are Bullish-Extreme with a score of 80.9 percent and the small traders (not shown in chart) are Bullish with a score of 69.2 percent.
| Ultra 10-Year Notes Statistics | SPECULATORS | COMMERCIALS | SMALL TRADERS |
| – Percent of Open Interest Longs: | 10.5 | 76.8 | 10.9 |
| – Percent of Open Interest Shorts: | 19.1 | 63.7 | 15.5 |
| – Net Position: | -142,577 | 218,066 | -75,489 |
| – Gross Longs: | 174,272 | 1,275,948 | 181,822 |
| – Gross Shorts: | 316,849 | 1,057,882 | 257,311 |
| – Long to Short Ratio: | 0.6 to 1 | 1.2 to 1 | 0.7 to 1 |
| NET POSITION TREND: | |||
| – Strength Index Score (3 Year Range Pct): | 15.4 | 80.9 | 69.2 |
| – Strength Index Reading (3 Year Range): | Bearish-Extreme | Bullish-Extreme | Bullish |
| NET POSITION MOVEMENT INDEX: | |||
| – 6-Week Change in Strength Index: | 9.8 | -11.0 | 1.7 |
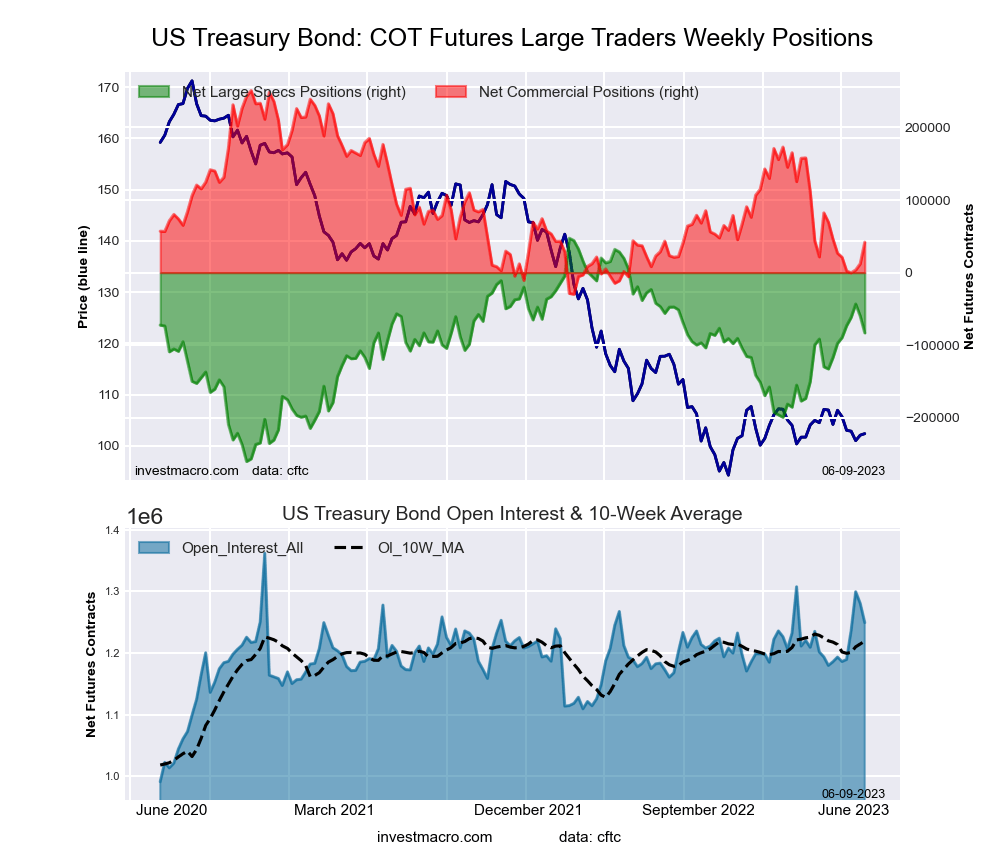
This week’s current strength score (the trader positioning range over the past three years, measured from 0 to 100) shows the speculators are currently Bullish with a score of 57.6 percent. The commercials are Bearish with a score of 25.5 percent and the small traders (not shown in chart) are Bullish with a score of 78.3 percent.
| US Treasury Bonds Statistics | SPECULATORS | COMMERCIALS | SMALL TRADERS |
| – Percent of Open Interest Longs: | 8.2 | 75.6 | 14.0 |
| – Percent of Open Interest Shorts: | 14.8 | 72.2 | 10.7 |
| – Net Position: | -82,926 | 41,862 | 41,064 |
| – Gross Longs: | 102,025 | 943,943 | 175,105 |
| – Gross Shorts: | 184,951 | 902,081 | 134,041 |
| – Long to Short Ratio: | 0.6 to 1 | 1.0 to 1 | 1.3 to 1 |
| NET POSITION TREND: | |||
| – Strength Index Score (3 Year Range Pct): | 57.6 | 25.5 | 78.3 |
| – Strength Index Reading (3 Year Range): | Bullish | Bearish | Bullish |
| NET POSITION MOVEMENT INDEX: | |||
| – 6-Week Change in Strength Index: | 4.7 | 5.4 | -21.6 |
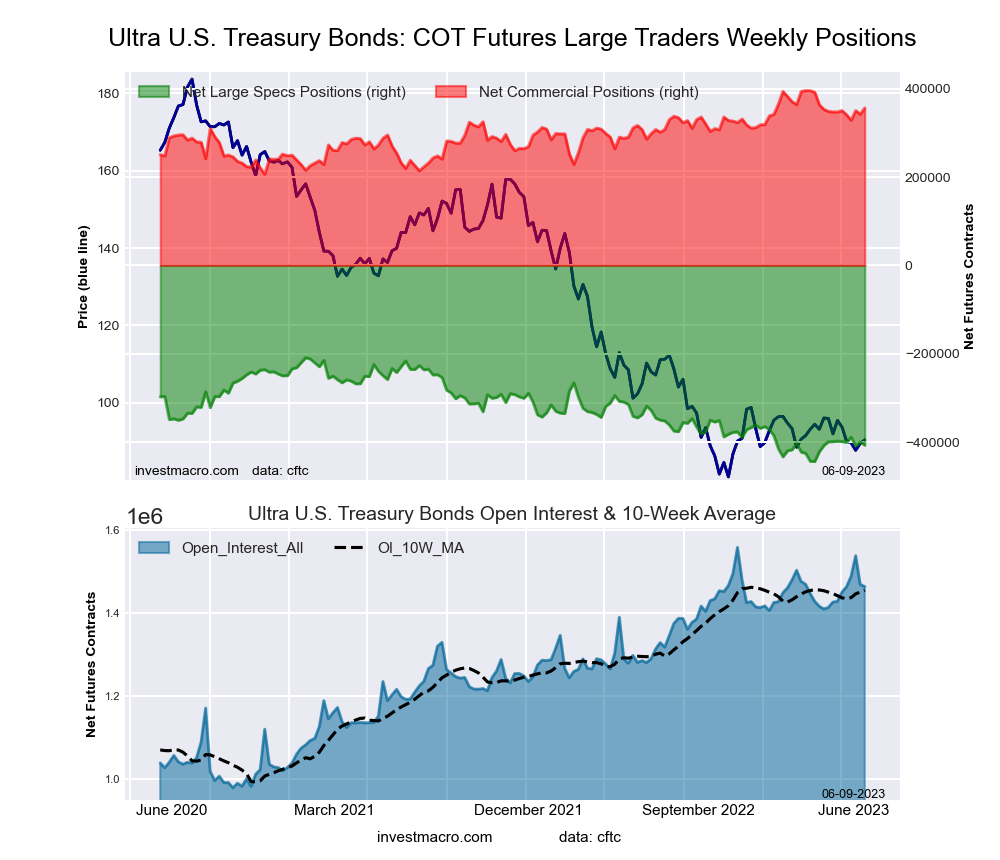
This week’s current strength score (the trader positioning range over the past three years, measured from 0 to 100) shows the speculators are currently Bearish-Extreme with a score of 15.7 percent. The commercials are Bullish with a score of 79.2 percent and the small traders (not shown in chart) are Bullish-Extreme with a score of 90.3 percent.
| Ultra US Treasury Bonds Statistics | SPECULATORS | COMMERCIALS | SMALL TRADERS |
| – Percent of Open Interest Longs: | 5.9 | 82.4 | 11.4 |
| – Percent of Open Interest Shorts: | 33.7 | 58.0 | 7.9 |
| – Net Position: | -406,999 | 356,439 | 50,560 |
| – Gross Longs: | 85,791 | 1,205,231 | 166,525 |
| – Gross Shorts: | 492,790 | 848,792 | 115,965 |
| – Long to Short Ratio: | 0.2 to 1 | 1.4 to 1 | 1.4 to 1 |
| NET POSITION TREND: | |||
| – Strength Index Score (3 Year Range Pct): | 15.7 | 79.2 | 90.3 |
| – Strength Index Reading (3 Year Range): | Bearish-Extreme | Bullish | Bullish-Extreme |
| NET POSITION MOVEMENT INDEX: | |||
| – 6-Week Change in Strength Index: | -3.8 | 4.7 | 0.2 |
Article By InvestMacro – Receive our weekly COT Newsletter
*COT Report: The COT data, released weekly to the public each Friday, is updated through the most recent Tuesday (data is 3 days old) and shows a quick view of how large speculators or non-commercials (for-profit traders) were positioned in the futures markets.
The CFTC categorizes trader positions according to commercial hedgers (traders who use futures contracts for hedging as part of the business), non-commercials (large traders who speculate to realize trading profits) and nonreportable traders (usually small traders/speculators) as well as their open interest (contracts open in the market at time of reporting). See CFTC criteria here.
By InvestMacro Here are the latest charts and statistics for the Commitment of Traders (COT)…
By InvestMacro The latest update for the weekly Commitment of Traders (COT) report was released…
By InvestMacro Here are the latest charts and statistics for the Commitment of Traders (COT)…
By InvestMacro Here are the latest charts and statistics for the Commitment of Traders (COT)…
By InvestMacro Here are the latest charts and statistics for the Commitment of Traders (COT)…
By InvestMacro Here are the latest charts and statistics for the Commitment of Traders (COT)…
This website uses cookies.