
By RoboForex Analytical Department
The EUR/USD pair reached a five-week high at 1.0822, buoyed by positive market sentiment ahead of today’s crucial US Consumer Price Index (CPI) data release. The report is expected to show a 0.3% month-on-month increase in inflation for April, a slight decrease from the 0.4% rise in March.
Federal Reserve Chair Jerome Powell recently provided a confident assessment of the US economy, predicting above-trend GDP growth and a decline in inflation. Despite some recent data that has slightly challenged this optimism, Powell’s outlook remains resilient. This year’s unexpected surge in US consumer prices has led to a revision in the Fed’s interest rate cut forecasts, with the market now anticipating a 45-basis point reduction by the end of 2024.
Investor expectations have significantly shifted throughout the year. They anticipated six rate cuts at the beginning of 2024, but now they only foresee a maximum of one by May. The Fed’s future decisions depend heavily on ongoing price trends and inflation forecasts.
EUR/USD technical analysis
Free Reports:
 Sign Up for Our Stock Market Newsletter – Get updated on News, Charts & Rankings of Public Companies when you join our Stocks Newsletter
 Get our Weekly Commitment of Traders Reports - See where the biggest traders (Hedge Funds and Commercial Hedgers) are positioned in the futures markets on a weekly basis.
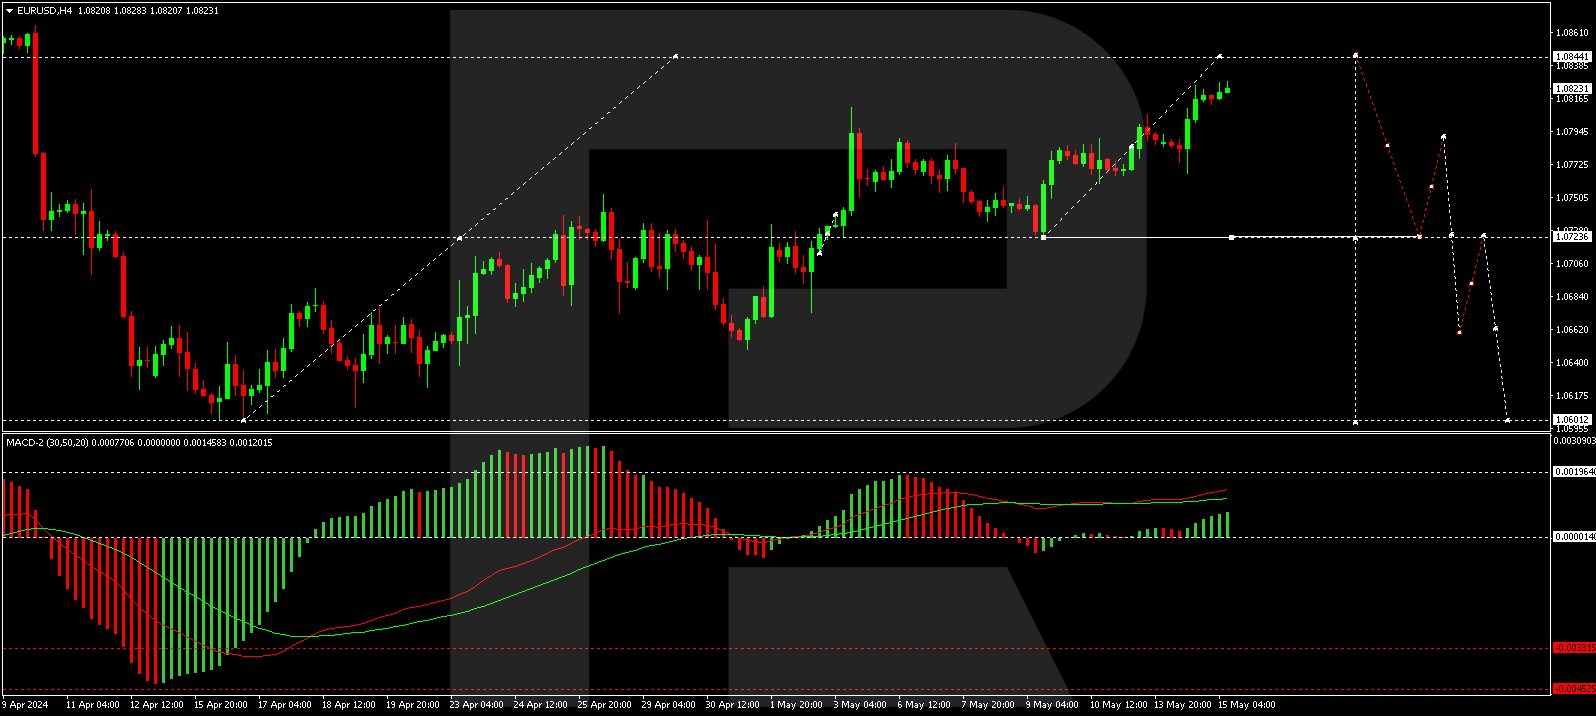
On the H4 chart, the EUR/USD has formed a consolidation range around 1.0785. With an upward exit from this range, a continuation of the correction is expected. The growth to 1.0827 has already been achieved, and a retraction to 1.0805 (testing from above) is anticipated today. Subsequent developments may lead to an increase towards 1.0844. This growth pattern from the level of 1.0601 is viewed as a correction to the last decline wave. Following its completion, a new wave of decline to 1.0600 is expected. This scenario is technically supported by the MACD indicator, with its signal line above zero and directed upwards, although histograms are at maximums and preparing for a decline.

On the H1 chart, after reaching 1.0805, a consolidation range was established above this level. Following an upward breakout, the price moved to 1.0827. Once this level is tested, a potential decline to 1.0805 (testing from above) could occur, leading to further growth towards 1.0844. The Stochastic oscillator confirms this technical outlook, with its signal line currently above 80. A decline to 50 followed by a rebound to 80 is expected, then a potential drop to 20, indicating upcoming fluctuations.
Disclaimer
Any forecasts contained herein are based on the author’s particular opinion. This analysis may not be treated as trading advice. RoboForex bears no responsibility for trading results based on trading recommendations and reviews contained herein.

- COT Metals Charts: Weekly Speculator Bets see small gains for Silver & Gold Jul 12, 2026
- COT Bonds Charts: Speculator Bets led by SOFR 3-Months & 2-Year Bonds Jul 12, 2026
- COT Energy Charts: Weekly Speculator Changes led by Brent Oil Jul 12, 2026
- COT Soft Commodities Charts: Weekly Speculator Changes led by Sugar, Corn & Soybeans Jul 12, 2026
- The US and European stock indices are rising again amid renewed investor interest in the AI industry. Jul 10, 2026
- USD/JPY Falls as Yen Recovers Weekly Losses Jul 10, 2026
- Crude oil prices surged sharply by 7% in reaction to the rapid escalation of the conflict in the Middle East Jul 9, 2026
- Middle East Tensions Weigh on Gold Jul 9, 2026
- Pound Awaits Tighter Policy from Bank of England Jul 8, 2026
- The United States carried out airstrikes on Iran after Iran’s attacked tankers in the Strait of Hormuz. The RBNZ raised the interest rate to 2.5% Jul 8, 2026