By InvestMacro
Here are the latest charts and statistics for the Commitment of Traders (COT) data published by the Commodities Futures Trading Commission (CFTC).
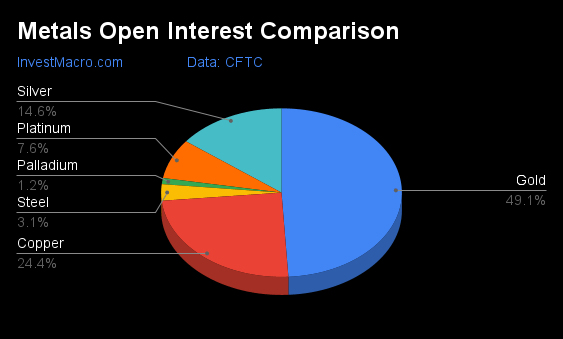
The latest COT data is updated through Tuesday May 30th and shows a quick view of how large traders (for-profit speculators and commercial entities) were positioned in the futures markets.
The COT metals markets speculator bets were lower this week as two out of the six metals markets we cover had higher positioning while the other four markets had lower speculator contracts.
Free Reports:
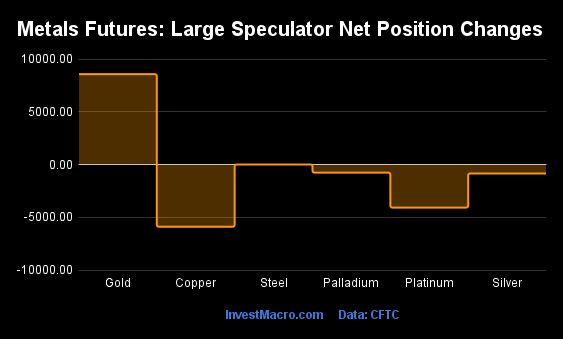
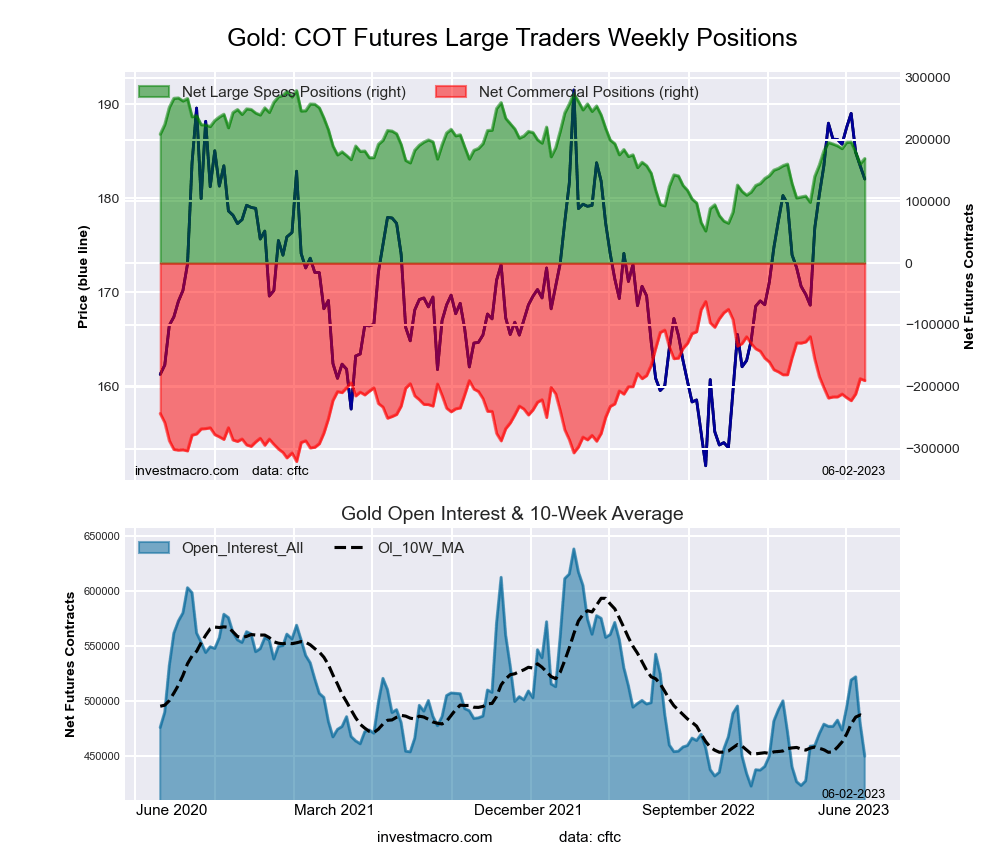
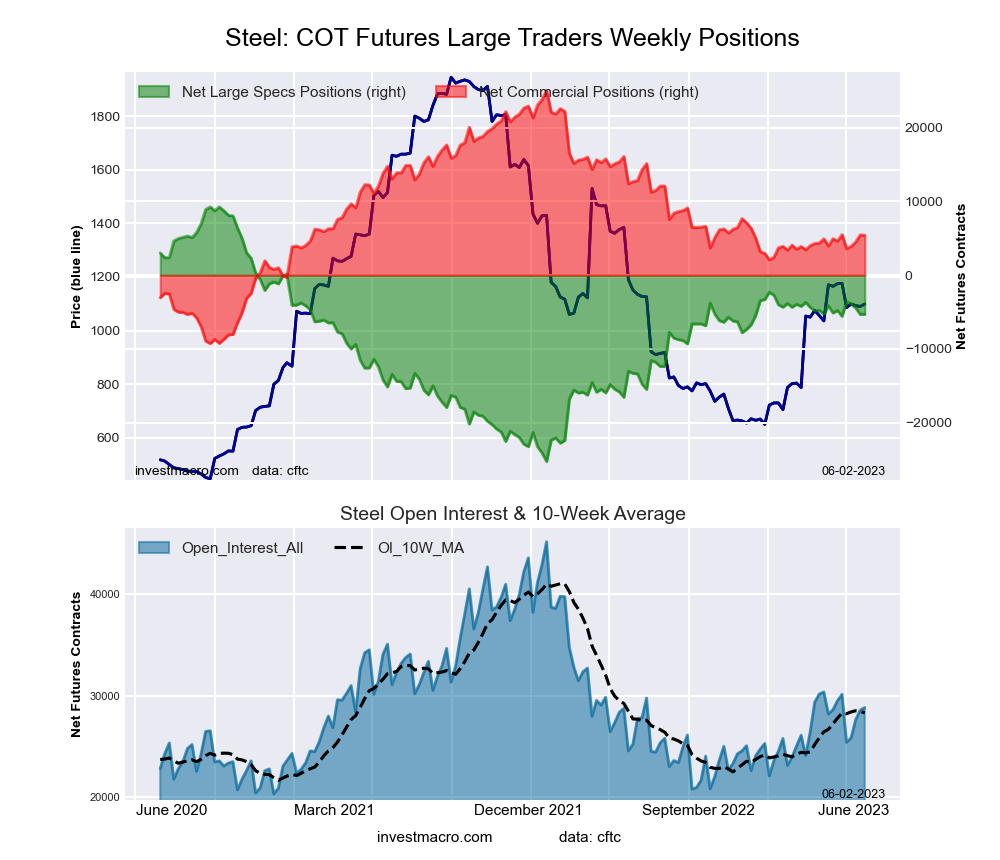
Leading the gains for the metals was Gold (8,584 contracts) with Steel (12 contracts) also having a positive week.
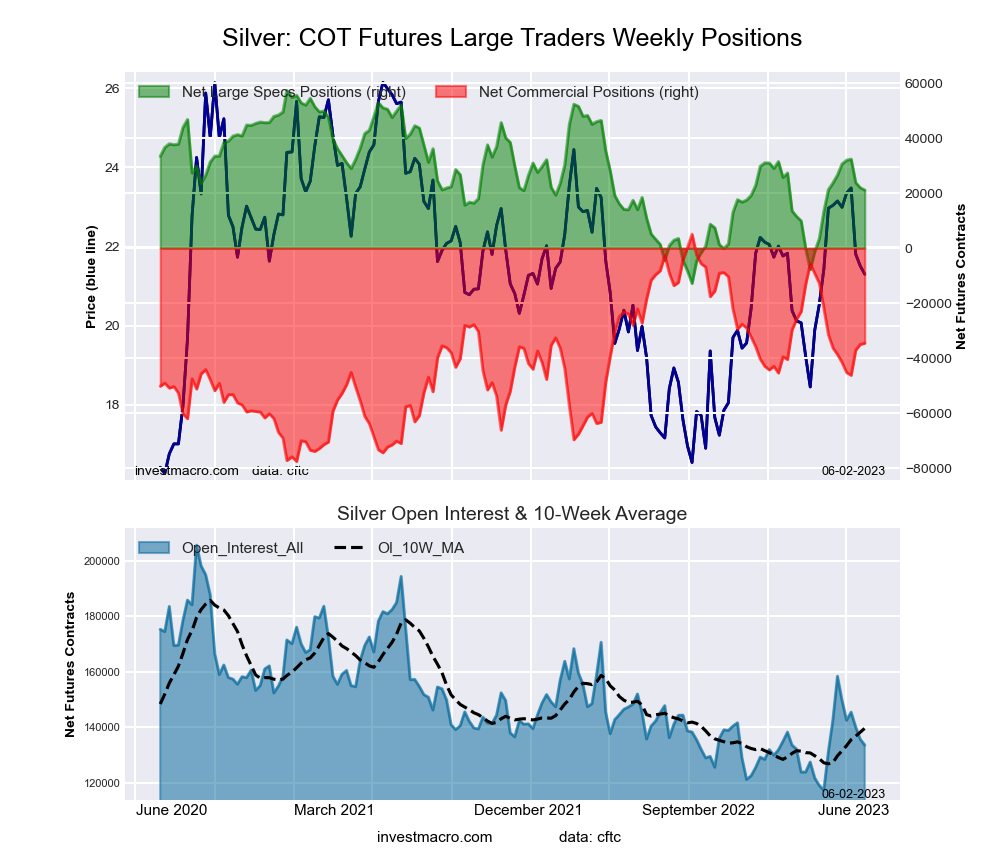
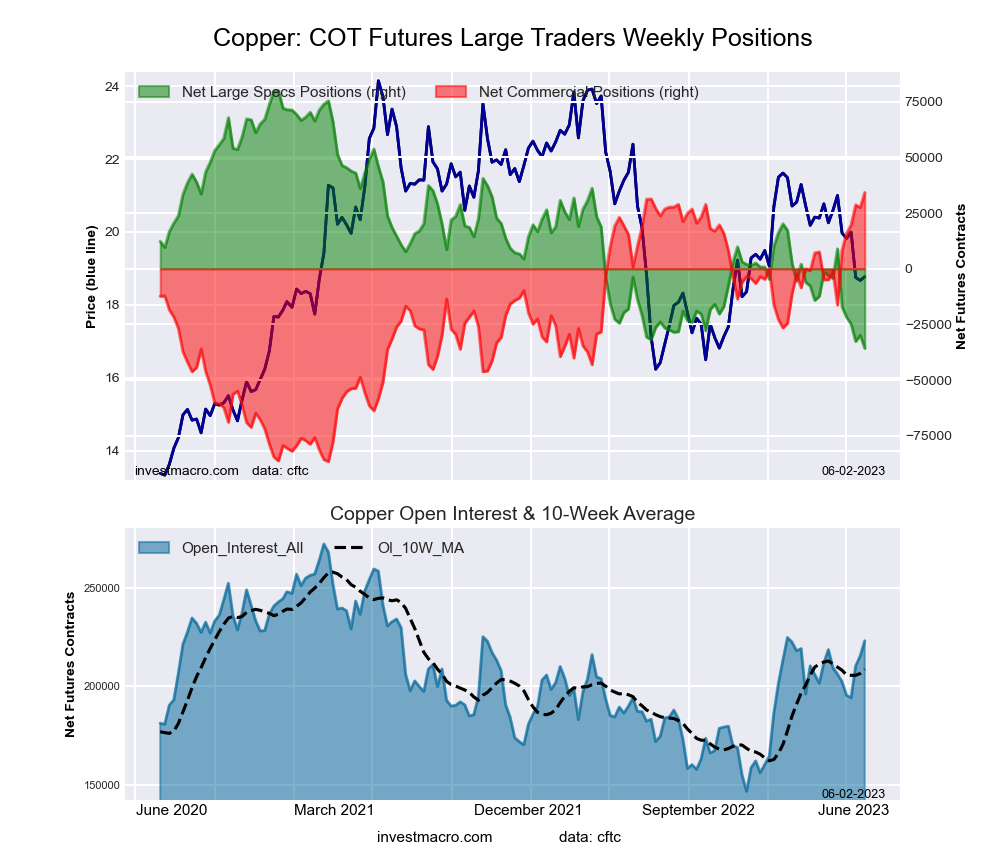
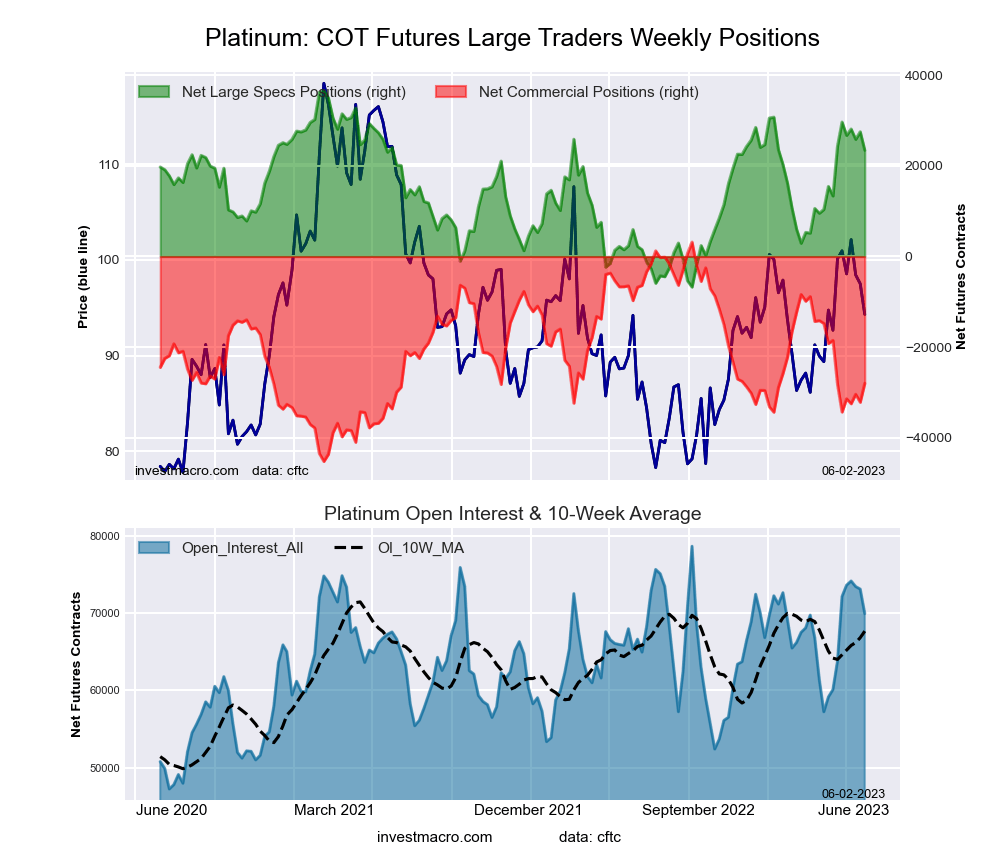
The markets with declines in speculator bets for the week were Copper (-5,894 contracts), Silver (-834 contracts), Palladium (-761 contracts) and Platinum (-4,073 contracts) also registering lower bets on the week.
Highlighting the COT metals data this week is the continued slide for the Copper speculative positions.
The large speculator position in Copper futures fell by -5,894 contracts this week and have now declined in five out of the past six weeks. The decrease in Copper bets has taken the current net contracts from a standing of +8,934 contracts on April 18th to a total of -35,702 contracts this week for an overall 6-week decline by -44,636 contracts.
This week’s standing marks the most bearish level of the past 167-weeks, dating back to March 17th of 2020 when bearish positions were -38,055 contracts.
Copper prices have been on the decline since last year with prices down by a little over 25 percent since the highs of March 2022. Recent weakness in China’s economy is continuing to weigh on Copper’s outlook. The futures price closed higher this week at $3.72 and bounced off the 200-week moving average which coincides with a $3.65 support level. Futures prices had fallen in five out of the previous six weeks before this week’s slight rebound.
| May-30-2023 | OI | OI-Index | Spec-Net | Spec-Index | Com-Net | COM-Index | Smalls-Net | Smalls-Index |
|---|---|---|---|---|---|---|---|---|
| Gold | 449,515 | 13 | 169,316 | 52 | -190,005 | 51 | 20,689 | 32 |
| Silver | 133,619 | 18 | 21,124 | 48 | -34,536 | 52 | 13,412 | 41 |
| Copper | 223,185 | 61 | -35,702 | 0 | 34,259 | 100 | 1,443 | 28 |
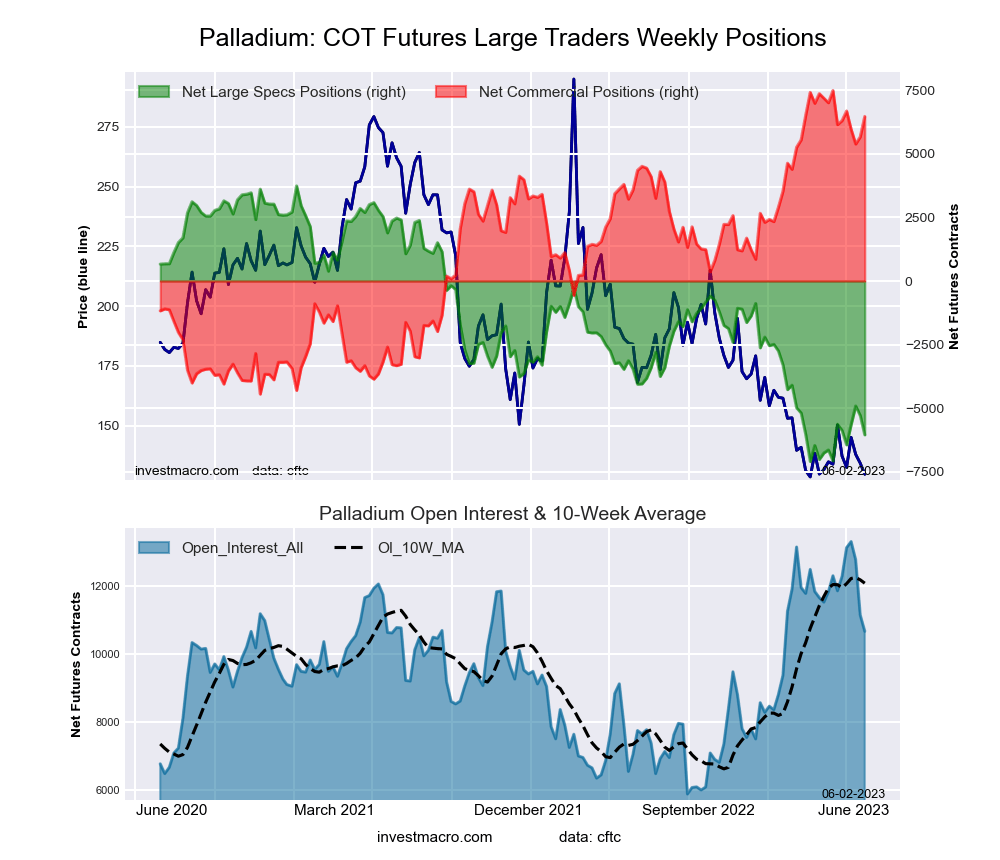
| Palladium | 10,658 | 64 | -6,050 | 10 | 6,472 | 91 | -422 | 16 |
| Platinum | 69,929 | 72 | 23,406 | 70 | -27,973 | 36 | 4,567 | 29 |
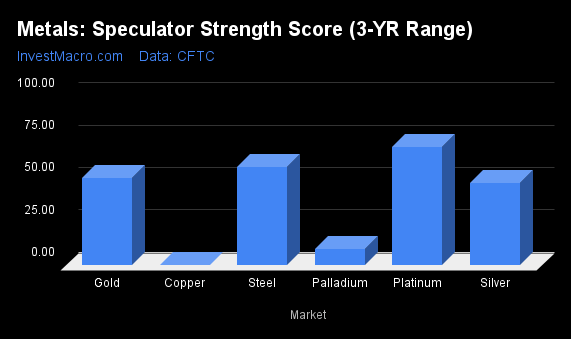
COT Strength Scores (a normalized measure of Speculator positions over a 3-Year range, from 0 to 100 where above 80 is Extreme-Bullish and below 20 is Extreme-Bearish) showed that Platinum (70 percent) and Steel (58 percent) lead the metals markets this week. comes in as the next highest in the weekly strength scores.
On the downside, Copper (0 percent) and Palladium (10 percent) come in at the lowest strength level currently and are in Extreme-Bearish territory (below 20 percent).
Strength Statistics:
Gold (51.6 percent) vs Gold previous week (47.8 percent)
Silver (48.4 percent) vs Silver previous week (49.6 percent)
Copper (0.0 percent) vs Copper previous week (5.1 percent)
Platinum (69.6 percent) vs Platinum previous week (79.0 percent)
Palladium (9.7 percent) vs Palladium previous week (16.7 percent)
Steel (57.8 percent) vs Palladium previous week (57.8 percent)
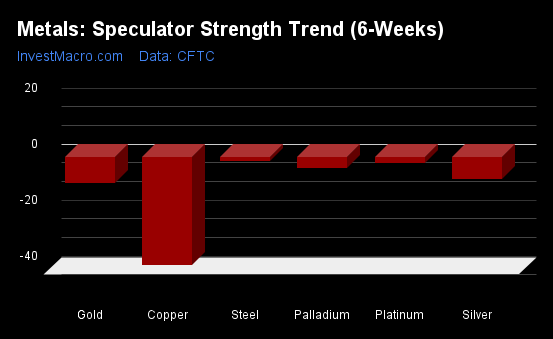
COT Strength Score Trends (or move index, calculates the 6-week changes in strength scores) showed that Platinum (-2 percent) and Steel (-2 percent) are the leaders over the past six weeks trends for metals.
Copper (-39 percent) leads the downside trend scores currently with Gold (-9 percent) as the next market with lower trend scores.
Move Statistics:
Gold (-9.1 percent) vs Gold previous week (-14.1 percent)
Silver (-7.8 percent) vs Silver previous week (-2.5 percent)
Copper (-38.6 percent) vs Copper previous week (-22.0 percent)
Platinum (-2.1 percent) vs Platinum previous week (32.6 percent)
Palladium (-3.8 percent) vs Palladium previous week (16.5 percent)
Steel (-1.5 percent) vs Steel previous week (-0.6 percent)
This week’s current strength score (the trader positioning range over the past three years, measured from 0 to 100) shows the speculators are currently Bullish with a score of 51.6 percent. The commercials are Bullish with a score of 50.6 percent and the small traders (not shown in chart) are Bearish with a score of 31.8 percent.
| Gold Futures Statistics | SPECULATORS | COMMERCIALS | SMALL TRADERS |
| – Percent of Open Interest Longs: | 52.8 | 29.7 | 9.7 |
| – Percent of Open Interest Shorts: | 15.1 | 71.9 | 5.1 |
| – Net Position: | 169,316 | -190,005 | 20,689 |
| – Gross Longs: | 237,306 | 133,329 | 43,611 |
| – Gross Shorts: | 67,990 | 323,334 | 22,922 |
| – Long to Short Ratio: | 3.5 to 1 | 0.4 to 1 | 1.9 to 1 |
| NET POSITION TREND: | |||
| – Strength Index Score (3 Year Range Pct): | 51.6 | 50.6 | 31.8 |
| – Strength Index Reading (3 Year Range): | Bullish | Bullish | Bearish |
| NET POSITION MOVEMENT INDEX: | |||
| – 6-Week Change in Strength Index: | -9.1 | 10.2 | -14.7 |
This week’s current strength score (the trader positioning range over the past three years, measured from 0 to 100) shows the speculators are currently Bearish with a score of 48.4 percent. The commercials are Bullish with a score of 52.1 percent and the small traders (not shown in chart) are Bearish with a score of 40.9 percent.
| Silver Futures Statistics | SPECULATORS | COMMERCIALS | SMALL TRADERS |
| – Percent of Open Interest Longs: | 41.0 | 31.1 | 19.1 |
| – Percent of Open Interest Shorts: | 25.2 | 57.0 | 9.0 |
| – Net Position: | 21,124 | -34,536 | 13,412 |
| – Gross Longs: | 54,837 | 41,602 | 25,484 |
| – Gross Shorts: | 33,713 | 76,138 | 12,072 |
| – Long to Short Ratio: | 1.6 to 1 | 0.5 to 1 | 2.1 to 1 |
| NET POSITION TREND: | |||
| – Strength Index Score (3 Year Range Pct): | 48.4 | 52.1 | 40.9 |
| – Strength Index Reading (3 Year Range): | Bearish | Bullish | Bearish |
| NET POSITION MOVEMENT INDEX: | |||
| – 6-Week Change in Strength Index: | -7.8 | 5.0 | 7.6 |
This week’s current strength score (the trader positioning range over the past three years, measured from 0 to 100) shows the speculators are currently Bearish-Extreme with a score of 0.0 percent. The commercials are Bullish-Extreme with a score of 100.0 percent and the small traders (not shown in chart) are Bearish with a score of 27.6 percent.
| Copper Futures Statistics | SPECULATORS | COMMERCIALS | SMALL TRADERS |
| – Percent of Open Interest Longs: | 24.7 | 48.9 | 7.3 |
| – Percent of Open Interest Shorts: | 40.7 | 33.5 | 6.7 |
| – Net Position: | -35,702 | 34,259 | 1,443 |
| – Gross Longs: | 55,099 | 109,115 | 16,379 |
| – Gross Shorts: | 90,801 | 74,856 | 14,936 |
| – Long to Short Ratio: | 0.6 to 1 | 1.5 to 1 | 1.1 to 1 |
| NET POSITION TREND: | |||
| – Strength Index Score (3 Year Range Pct): | 0.0 | 100.0 | 27.6 |
| – Strength Index Reading (3 Year Range): | Bearish-Extreme | Bullish-Extreme | Bearish |
| NET POSITION MOVEMENT INDEX: | |||
| – 6-Week Change in Strength Index: | -38.6 | 41.8 | -37.2 |
This week’s current strength score (the trader positioning range over the past three years, measured from 0 to 100) shows the speculators are currently Bullish with a score of 69.6 percent. The commercials are Bearish with a score of 35.6 percent and the small traders (not shown in chart) are Bearish with a score of 29.3 percent.
| Platinum Futures Statistics | SPECULATORS | COMMERCIALS | SMALL TRADERS |
| – Percent of Open Interest Longs: | 53.7 | 29.6 | 10.5 |
| – Percent of Open Interest Shorts: | 20.2 | 69.7 | 3.9 |
| – Net Position: | 23,406 | -27,973 | 4,567 |
| – Gross Longs: | 37,534 | 20,734 | 7,315 |
| – Gross Shorts: | 14,128 | 48,707 | 2,748 |
| – Long to Short Ratio: | 2.7 to 1 | 0.4 to 1 | 2.7 to 1 |
| NET POSITION TREND: | |||
| – Strength Index Score (3 Year Range Pct): | 69.6 | 35.6 | 29.3 |
| – Strength Index Reading (3 Year Range): | Bullish | Bearish | Bearish |
| NET POSITION MOVEMENT INDEX: | |||
| – 6-Week Change in Strength Index: | -2.1 | 0.5 | 9.1 |
This week’s current strength score (the trader positioning range over the past three years, measured from 0 to 100) shows the speculators are currently Bearish-Extreme with a score of 9.7 percent. The commercials are Bullish-Extreme with a score of 91.5 percent and the small traders (not shown in chart) are Bearish-Extreme with a score of 16.3 percent.
| Palladium Futures Statistics | SPECULATORS | COMMERCIALS | SMALL TRADERS |
| – Percent of Open Interest Longs: | 14.9 | 70.1 | 12.3 |
| – Percent of Open Interest Shorts: | 71.6 | 9.4 | 16.2 |
| – Net Position: | -6,050 | 6,472 | -422 |
| – Gross Longs: | 1,584 | 7,473 | 1,308 |
| – Gross Shorts: | 7,634 | 1,001 | 1,730 |
| – Long to Short Ratio: | 0.2 to 1 | 7.5 to 1 | 0.8 to 1 |
| NET POSITION TREND: | |||
| – Strength Index Score (3 Year Range Pct): | 9.7 | 91.5 | 16.3 |
| – Strength Index Reading (3 Year Range): | Bearish-Extreme | Bullish-Extreme | Bearish-Extreme |
| NET POSITION MOVEMENT INDEX: | |||
| – 6-Week Change in Strength Index: | -3.8 | 2.7 | 5.5 |
This week’s current strength score (the trader positioning range over the past three years, measured from 0 to 100) shows the speculators are currently Bullish with a score of 57.8 percent. The commercials are Bearish with a score of 42.8 percent and the small traders (not shown in chart) are Bearish-Extreme with a score of 5.4 percent.
| Steel Futures Statistics | SPECULATORS | COMMERCIALS | SMALL TRADERS |
| – Percent of Open Interest Longs: | 7.9 | 83.3 | 0.7 |
| – Percent of Open Interest Shorts: | 26.3 | 64.6 | 1.1 |
| – Net Position: | -5,299 | 5,413 | -114 |
| – Gross Longs: | 2,291 | 24,022 | 200 |
| – Gross Shorts: | 7,590 | 18,609 | 314 |
| – Long to Short Ratio: | 0.3 to 1 | 1.3 to 1 | 0.6 to 1 |
| NET POSITION TREND: | |||
| – Strength Index Score (3 Year Range Pct): | 57.8 | 42.8 | 5.4 |
| – Strength Index Reading (3 Year Range): | Bullish | Bearish | Bearish-Extreme |
| NET POSITION MOVEMENT INDEX: | |||
| – 6-Week Change in Strength Index: | -1.5 | 2.3 | -33.7 |
Article By InvestMacro – Receive our weekly COT Newsletter
*COT Report: The COT data, released weekly to the public each Friday, is updated through the most recent Tuesday (data is 3 days old) and shows a quick view of how large speculators or non-commercials (for-profit traders) were positioned in the futures markets.
The CFTC categorizes trader positions according to commercial hedgers (traders who use futures contracts for hedging as part of the business), non-commercials (large traders who speculate to realize trading profits) and nonreportable traders (usually small traders/speculators) as well as their open interest (contracts open in the market at time of reporting). See CFTC criteria here.
By JustMarkets The US stock indices started the week on a downbeat note. By the…
By Analytical Department RoboForex GBP/USD fell to 1.3437 on Tuesday as investors assessed the appointment…
By JustMarkets The US stock indices ended Friday’s session in the red. By the end…
By Analytical Department RoboForex USD/JPY opens the week at 162.36 on Monday. The Japanese yen…
By InvestMacro Here are the latest charts and statistics for the Commitment of Traders (COT)…
By InvestMacro The latest update for the weekly Commitment of Traders (COT) report was released…
This website uses cookies.