By InvestMacro
Here are the latest charts and statistics for the Commitment of Traders (COT) data published by the Commodities Futures Trading Commission (CFTC).
The latest COT data is updated through Tuesday April 11th and shows a quick view of how large traders (for-profit speculators and commercial entities) were positioned in the futures markets.
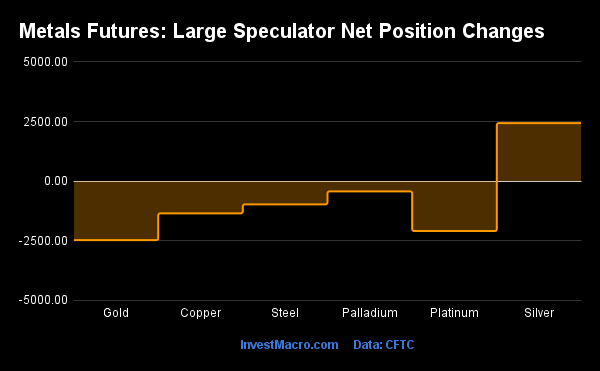
The COT metals markets speculator bets were lower this week as just one out of the six metals markets we cover had higher positioning while the other five markets had lower speculator contracts.
Free Reports:
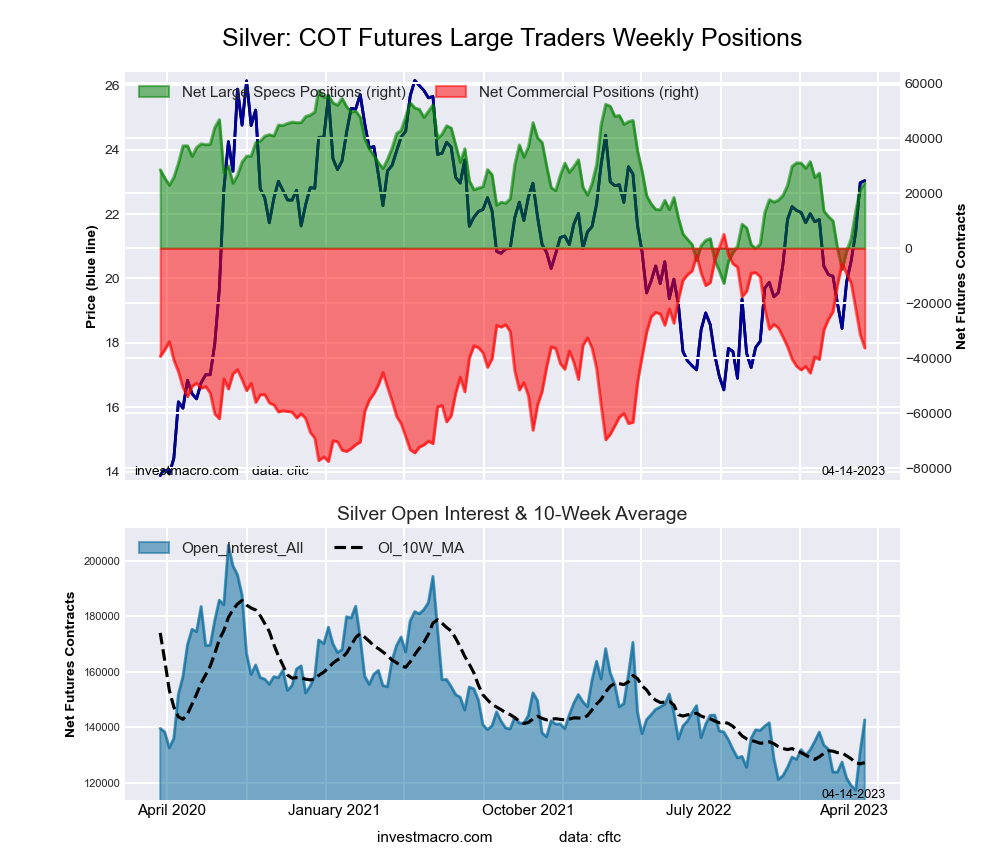
Leading the gains for the metals was Silver with a rise of 2,435 contracts this week.
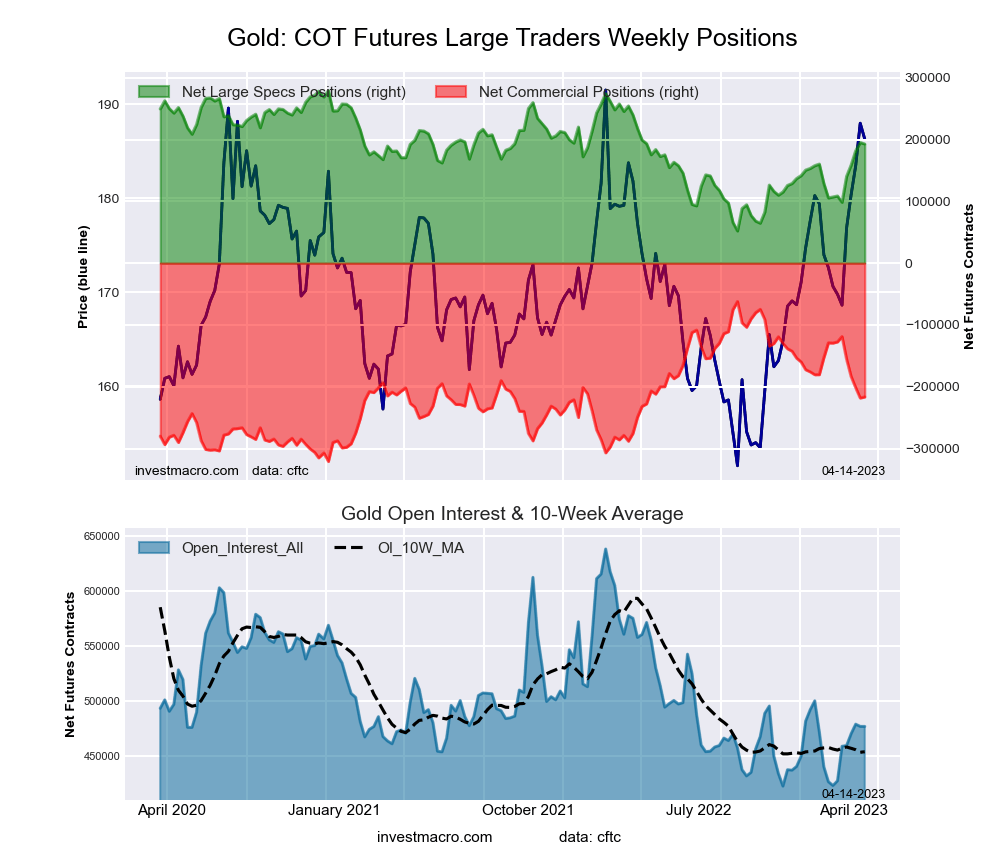
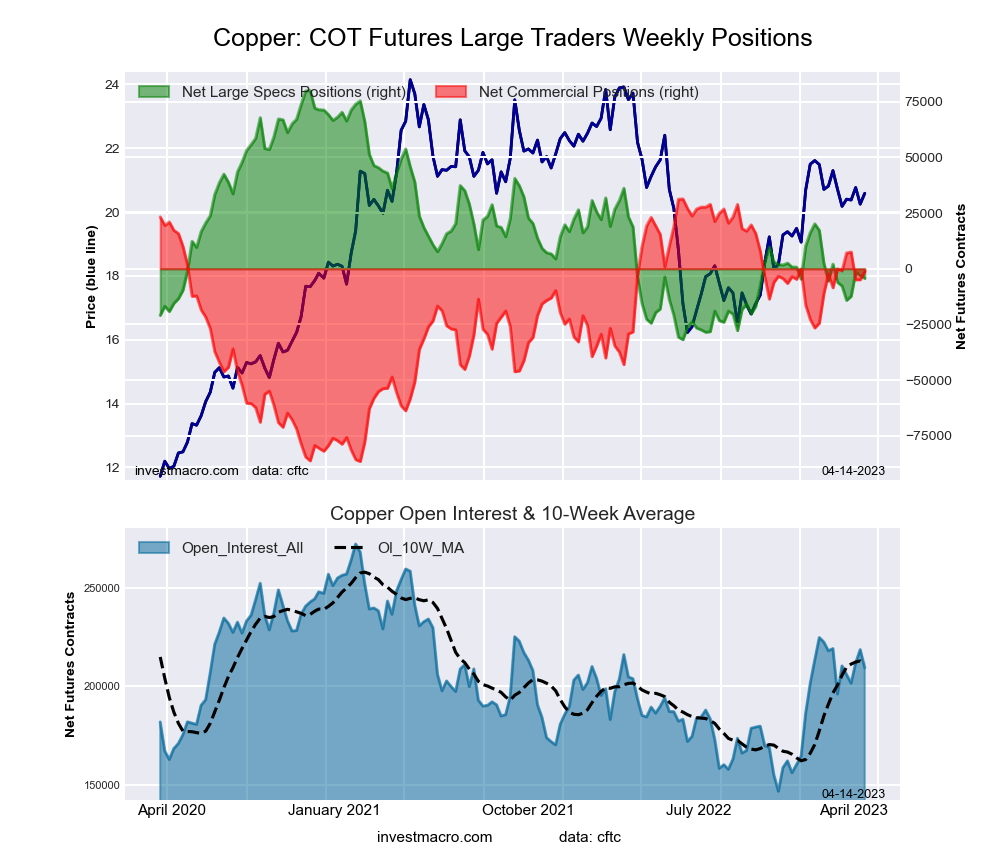
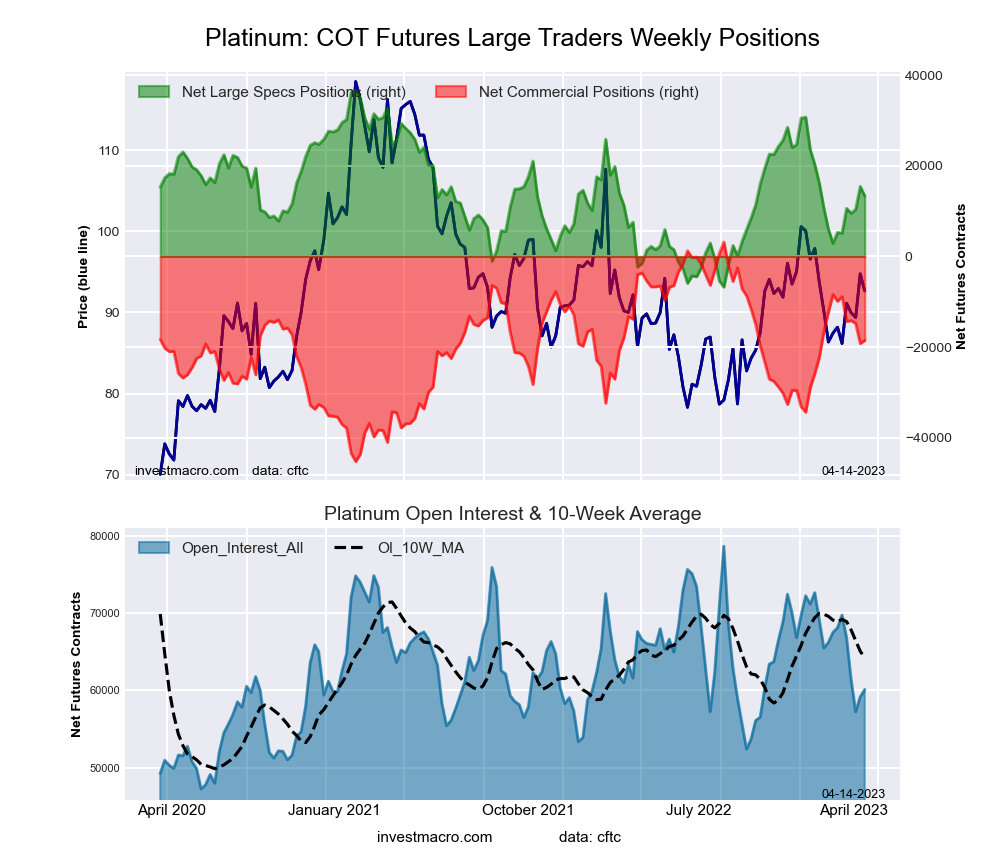
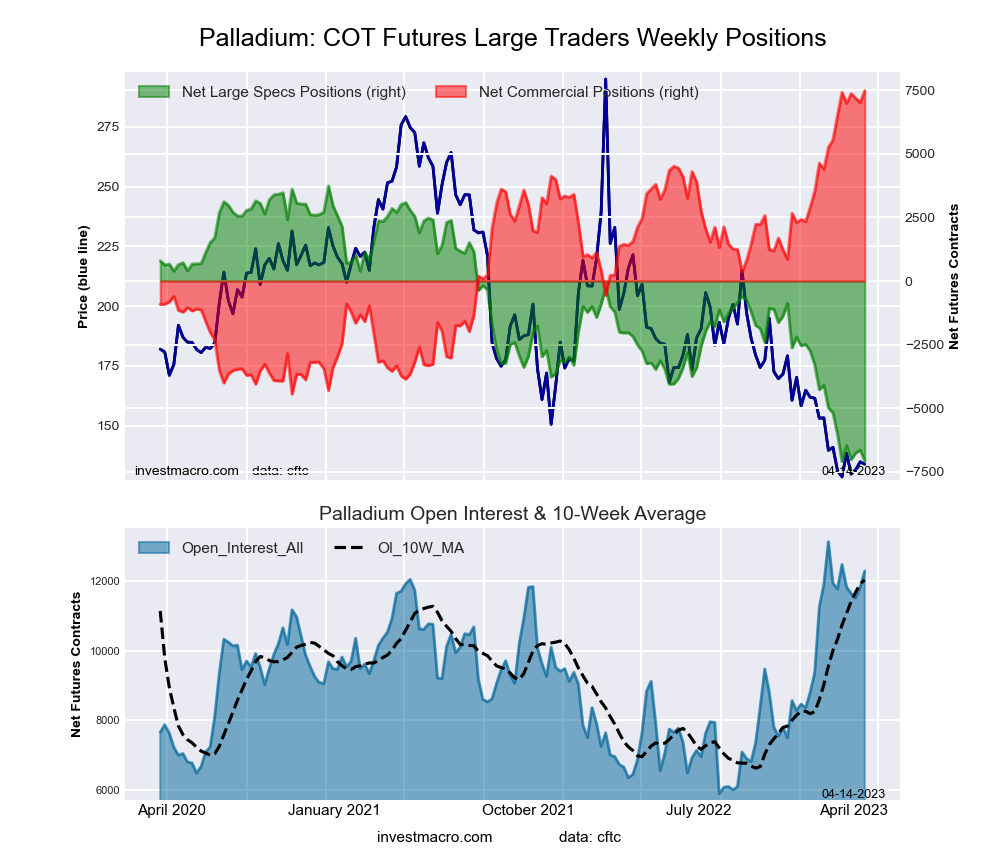
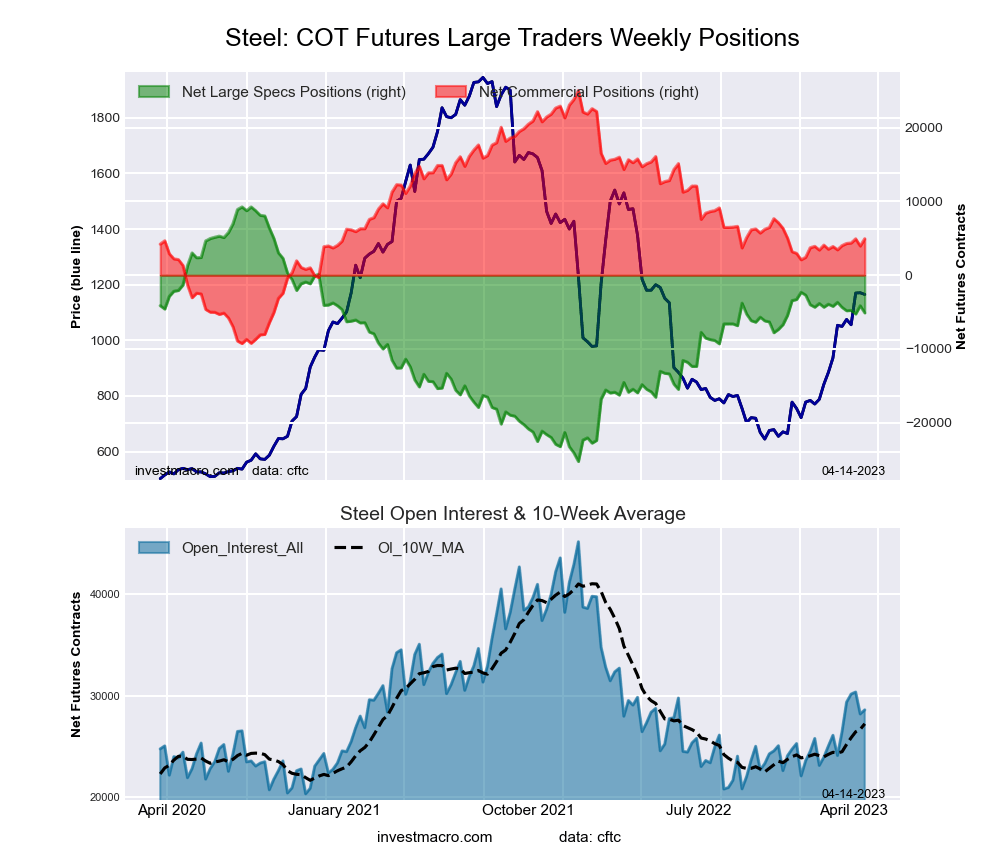
The markets with declines in speculator bets for the week were Gold (-2,471 contracts) with Platinum (-2,090 contracts), Copper (-1,349 contracts), Steel (-970 contracts) and Palladium (-427 contracts) also having lower bets on the week.
Highlighting the COT metals data this week is the continued bullishness for the Silver speculative positions. The large speculator position in Silver futures climbed this week for a fifth straight week. Silver spec bets have now jumped by a total of +31,500 contracts over the past five weeks. This recent speculator sentiment bump has taken the Silver position from a total of -1,219 contracts on March 14th to a total of +23,718 contracts this week, leveling at the most bullish standing for Silver in ten weeks.
The Silver futures price has continued to enjoy a bullish run and has now increased for five consecutive weeks. The futures price has risen by over 20 percent in these past five weeks and touched the highest level since last April before closing this week at almost $25.50.
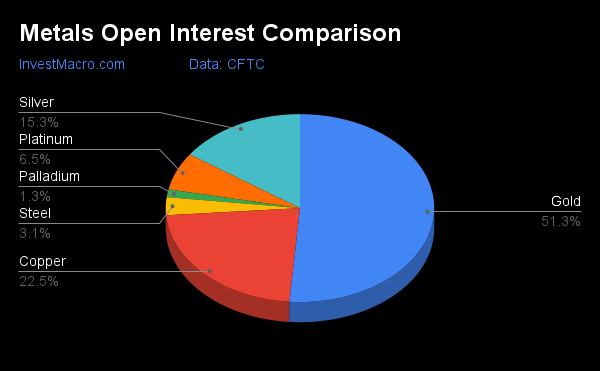
| Apr-11-2023 | OI | OI-Index | Spec-Net | Spec-Index | Com-Net | COM-Index | Smalls-Net | Smalls-Index |
|---|---|---|---|---|---|---|---|---|
| Gold | 476,567 | 25 | 192,745 | 62 | -216,548 | 40 | 23,803 | 40 |
| Silver | 142,699 | 29 | 23,718 | 52 | -36,255 | 50 | 12,537 | 36 |
| Copper | 209,501 | 50 | -4,303 | 25 | -1,217 | 72 | 5,520 | 53 |
| Palladium | 12,290 | 88 | -7,073 | 0 | 7,491 | 100 | -418 | 17 |
| Platinum | 60,115 | 41 | 13,333 | 46 | -18,511 | 55 | 5,178 | 37 |
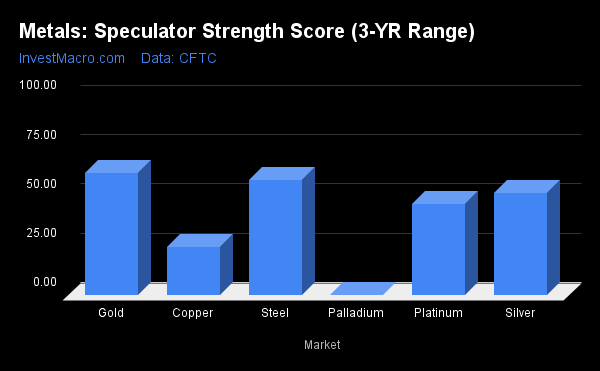
COT Strength Scores (a normalized measure of Speculator positions over a 3-Year range, from 0 to 100 where above 80 is Extreme-Bullish and below 20 is Extreme-Bearish) showed that Gold (62 percent) and Steel (58 percent) lead the metals markets this week.
On the downside, Palladium (0.2 percent) comes in at the lowest strength level currently and is in Extreme-Bearish territory (below 20 percent).
Strength Statistics:
Gold (61.9 percent) vs Gold previous week (63.0 percent)
Silver (52.1 percent) vs Silver previous week (48.6 percent)
Copper (24.6 percent) vs Copper previous week (25.8 percent)
Platinum (46.4 percent) vs Platinum previous week (51.2 percent)
Palladium (0.2 percent) vs Palladium previous week (4.2 percent)
Steel (58.4 percent) vs Palladium previous week (61.2 percent)
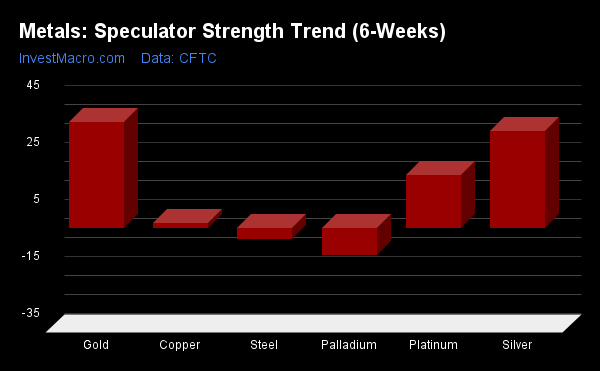
COT Strength Score Trends (or move index, calculates the 6-week changes in strength scores) showed that Gold (37 percent) and Silver (34 percent) lead the past six weeks trends for metals. Platinum (18.5 percent) is the next highest positive mover in the latest trends data.
Palladium (-10 percent) leads the downside trend scores currently with Steel (-4 percent) as the next market with lower trend scores.
Move Statistics:
Gold (37.0 percent) vs Gold previous week (38.8 percent)
Silver (33.9 percent) vs Silver previous week (16.2 percent)
Copper (1.6 percent) vs Copper previous week (-4.5 percent)
Platinum (18.5 percent) vs Platinum previous week (28.9 percent)
Palladium (-9.7 percent) vs Palladium previous week (-13.5 percent)
Steel (-4.1 percent) vs Steel previous week (0.2 percent)
This week’s current strength score (the trader positioning range over the past three years, measured from 0 to 100) shows the speculators are currently Bullish with a score of 61.9 percent. The commercials are Bearish with a score of 40.3 percent and the small traders (not shown in chart) are Bearish with a score of 39.6 percent.
| Gold Futures Statistics | SPECULATORS | COMMERCIALS | SMALL TRADERS |
| – Percent of Open Interest Longs: | 54.6 | 25.1 | 10.3 |
| – Percent of Open Interest Shorts: | 14.1 | 70.6 | 5.3 |
| – Net Position: | 192,745 | -216,548 | 23,803 |
| – Gross Longs: | 260,165 | 119,710 | 49,102 |
| – Gross Shorts: | 67,420 | 336,258 | 25,299 |
| – Long to Short Ratio: | 3.9 to 1 | 0.4 to 1 | 1.9 to 1 |
| NET POSITION TREND: | |||
| – Strength Index Score (3 Year Range Pct): | 61.9 | 40.3 | 39.6 |
| – Strength Index Reading (3 Year Range): | Bullish | Bearish | Bearish |
| NET POSITION MOVEMENT INDEX: | |||
| – 6-Week Change in Strength Index: | 37.0 | -34.4 | 12.3 |
This week’s current strength score (the trader positioning range over the past three years, measured from 0 to 100) shows the speculators are currently Bullish with a score of 52.1 percent. The commercials are Bearish with a score of 50.0 percent and the small traders (not shown in chart) are Bearish with a score of 36.0 percent.
| Silver Futures Statistics | SPECULATORS | COMMERCIALS | SMALL TRADERS |
| – Percent of Open Interest Longs: | 39.0 | 33.4 | 17.7 |
| – Percent of Open Interest Shorts: | 22.3 | 58.8 | 8.9 |
| – Net Position: | 23,718 | -36,255 | 12,537 |
| – Gross Longs: | 55,583 | 47,629 | 25,218 |
| – Gross Shorts: | 31,865 | 83,884 | 12,681 |
| – Long to Short Ratio: | 1.7 to 1 | 0.6 to 1 | 2.0 to 1 |
| NET POSITION TREND: | |||
| – Strength Index Score (3 Year Range Pct): | 52.1 | 50.0 | 36.0 |
| – Strength Index Reading (3 Year Range): | Bullish | Bearish | Bearish |
| NET POSITION MOVEMENT INDEX: | |||
| – 6-Week Change in Strength Index: | 33.9 | -28.0 | -3.7 |
This week’s current strength score (the trader positioning range over the past three years, measured from 0 to 100) shows the speculators are currently Bearish with a score of 24.6 percent. The commercials are Bullish with a score of 72.4 percent and the small traders (not shown in chart) are Bullish with a score of 53.3 percent.
| Copper Futures Statistics | SPECULATORS | COMMERCIALS | SMALL TRADERS |
| – Percent of Open Interest Longs: | 26.8 | 43.6 | 9.0 |
| – Percent of Open Interest Shorts: | 28.8 | 44.2 | 6.3 |
| – Net Position: | -4,303 | -1,217 | 5,520 |
| – Gross Longs: | 56,063 | 91,399 | 18,793 |
| – Gross Shorts: | 60,366 | 92,616 | 13,273 |
| – Long to Short Ratio: | 0.9 to 1 | 1.0 to 1 | 1.4 to 1 |
| NET POSITION TREND: | |||
| – Strength Index Score (3 Year Range Pct): | 24.6 | 72.4 | 53.3 |
| – Strength Index Reading (3 Year Range): | Bearish | Bullish | Bullish |
| NET POSITION MOVEMENT INDEX: | |||
| – 6-Week Change in Strength Index: | 1.6 | -1.0 | -3.5 |
This week’s current strength score (the trader positioning range over the past three years, measured from 0 to 100) shows the speculators are currently Bearish with a score of 46.4 percent. The commercials are Bullish with a score of 55.2 percent and the small traders (not shown in chart) are Bearish with a score of 37.4 percent.
| Platinum Futures Statistics | SPECULATORS | COMMERCIALS | SMALL TRADERS |
| – Percent of Open Interest Longs: | 49.2 | 34.5 | 12.6 |
| – Percent of Open Interest Shorts: | 27.0 | 65.3 | 4.0 |
| – Net Position: | 13,333 | -18,511 | 5,178 |
| – Gross Longs: | 29,570 | 20,768 | 7,569 |
| – Gross Shorts: | 16,237 | 39,279 | 2,391 |
| – Long to Short Ratio: | 1.8 to 1 | 0.5 to 1 | 3.2 to 1 |
| NET POSITION TREND: | |||
| – Strength Index Score (3 Year Range Pct): | 46.4 | 55.2 | 37.4 |
| – Strength Index Reading (3 Year Range): | Bearish | Bullish | Bearish |
| NET POSITION MOVEMENT INDEX: | |||
| – 6-Week Change in Strength Index: | 18.5 | -17.9 | 8.0 |
This week’s current strength score (the trader positioning range over the past three years, measured from 0 to 100) shows the speculators are currently Bearish-Extreme with a score of 0.2 percent. The commercials are Bullish-Extreme with a score of 100.0 percent and the small traders (not shown in chart) are Bearish-Extreme with a score of 16.6 percent.
| Palladium Futures Statistics | SPECULATORS | COMMERCIALS | SMALL TRADERS |
| – Percent of Open Interest Longs: | 11.9 | 71.7 | 10.7 |
| – Percent of Open Interest Shorts: | 69.5 | 10.8 | 14.1 |
| – Net Position: | -7,073 | 7,491 | -418 |
| – Gross Longs: | 1,463 | 8,814 | 1,319 |
| – Gross Shorts: | 8,536 | 1,323 | 1,737 |
| – Long to Short Ratio: | 0.2 to 1 | 6.7 to 1 | 0.8 to 1 |
| NET POSITION TREND: | |||
| – Strength Index Score (3 Year Range Pct): | 0.2 | 100.0 | 16.6 |
| – Strength Index Reading (3 Year Range): | Bearish-Extreme | Bullish-Extreme | Bearish-Extreme |
| NET POSITION MOVEMENT INDEX: | |||
| – 6-Week Change in Strength Index: | -9.7 | 8.2 | 4.2 |
This week’s current strength score (the trader positioning range over the past three years, measured from 0 to 100) shows the speculators are currently Bullish with a score of 58.4 percent. The commercials are Bearish with a score of 41.4 percent and the small traders (not shown in chart) are Bearish with a score of 39.8 percent.
| Steel Futures Statistics | SPECULATORS | COMMERCIALS | SMALL TRADERS |
| – Percent of Open Interest Longs: | 12.0 | 76.4 | 1.1 |
| – Percent of Open Interest Shorts: | 29.8 | 59.1 | 0.6 |
| – Net Position: | -5,108 | 4,951 | 157 |
| – Gross Longs: | 3,428 | 21,857 | 317 |
| – Gross Shorts: | 8,536 | 16,906 | 160 |
| – Long to Short Ratio: | 0.4 to 1 | 1.3 to 1 | 2.0 to 1 |
| NET POSITION TREND: | |||
| – Strength Index Score (3 Year Range Pct): | 58.4 | 41.4 | 39.8 |
| – Strength Index Reading (3 Year Range): | Bullish | Bearish | Bearish |
| NET POSITION MOVEMENT INDEX: | |||
| – 6-Week Change in Strength Index: | -4.1 | 4.4 | -10.3 |
Article By InvestMacro – Receive our weekly COT Newsletter
*COT Report: The COT data, released weekly to the public each Friday, is updated through the most recent Tuesday (data is 3 days old) and shows a quick view of how large speculators or non-commercials (for-profit traders) were positioned in the futures markets.
The CFTC categorizes trader positions according to commercial hedgers (traders who use futures contracts for hedging as part of the business), non-commercials (large traders who speculate to realize trading profits) and nonreportable traders (usually small traders/speculators) as well as their open interest (contracts open in the market at time of reporting). See CFTC criteria here.
By JustMarkets The US stock indices started the week on a downbeat note. By the…
By Analytical Department RoboForex GBP/USD fell to 1.3437 on Tuesday as investors assessed the appointment…
By JustMarkets The US stock indices ended Friday’s session in the red. By the end…
By Analytical Department RoboForex USD/JPY opens the week at 162.36 on Monday. The Japanese yen…
By InvestMacro Here are the latest charts and statistics for the Commitment of Traders (COT)…
By InvestMacro The latest update for the weekly Commitment of Traders (COT) report was released…
This website uses cookies.