By InvestMacro
Here are the latest charts and statistics for the Commitment of Traders (COT) reports data published by the Commodities Futures Trading Commission (CFTC).
The latest COT data is updated through Tuesday October 18th and shows a quick view of how large traders (for-profit speculators and commercial entities) were positioned in the futures markets.
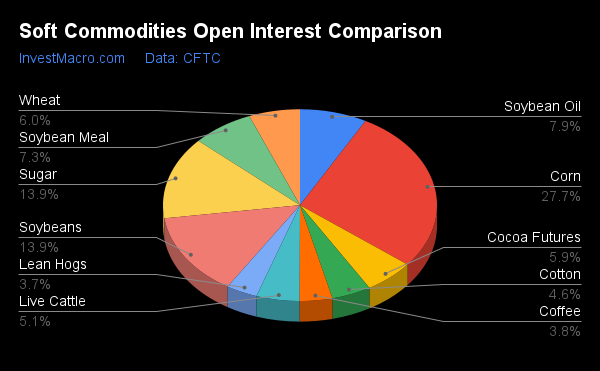
The COT soft commodities speculator bets were slightly lower this week as five out of the eleven soft commodities markets we cover had higher positioning this week while the other six markets had decreases in contracts.
Free Reports:
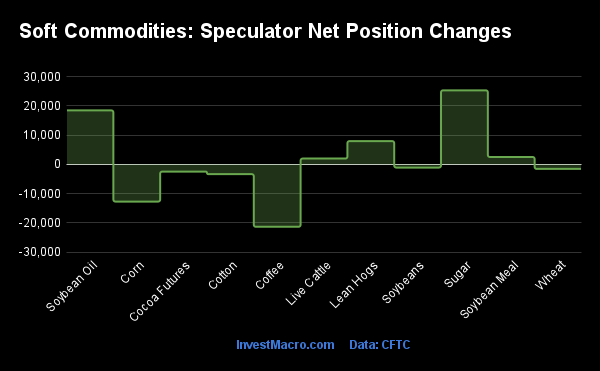
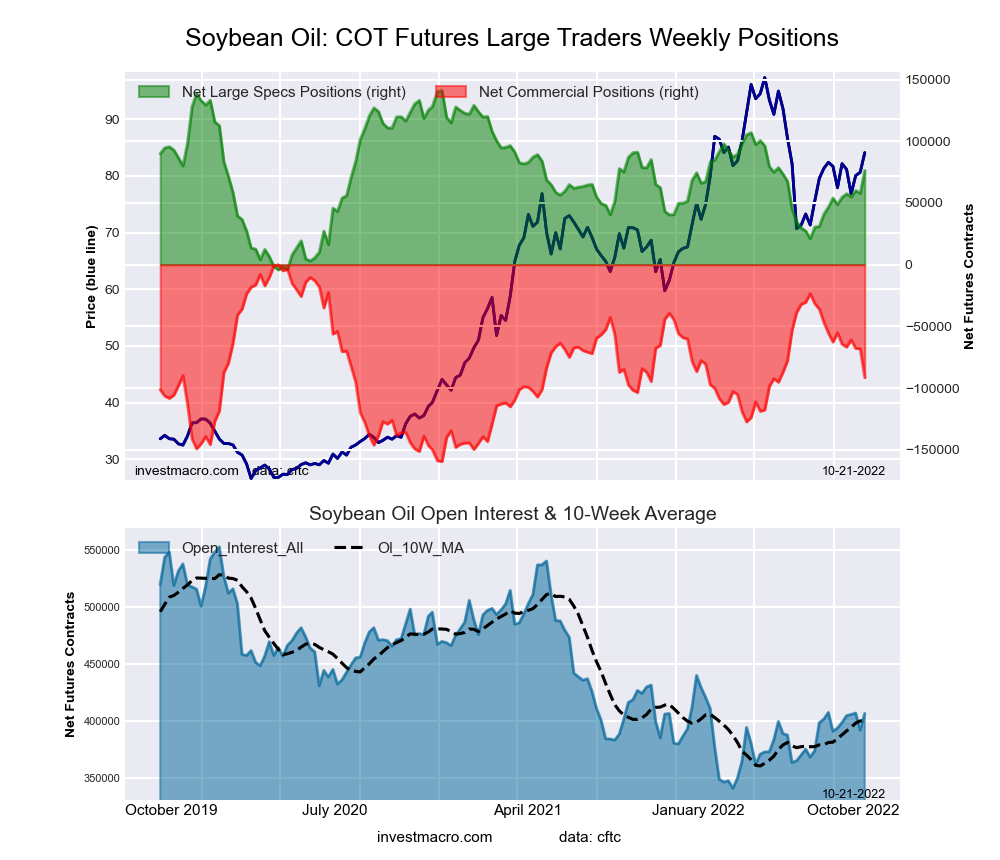
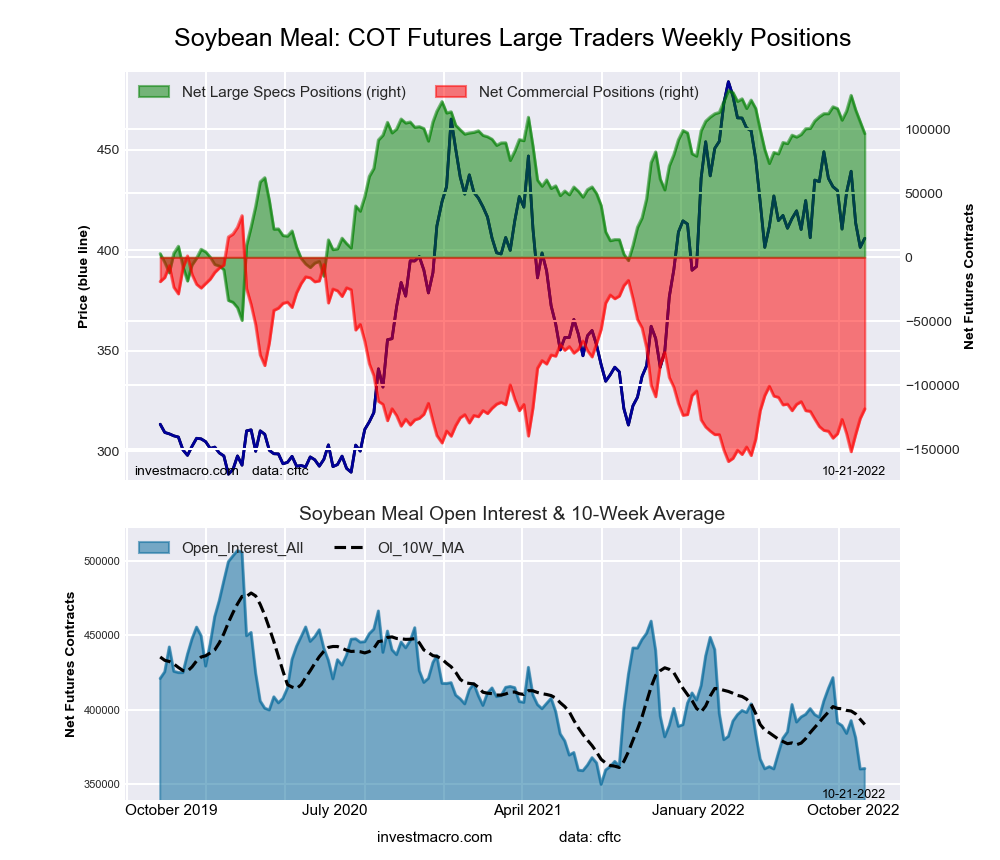
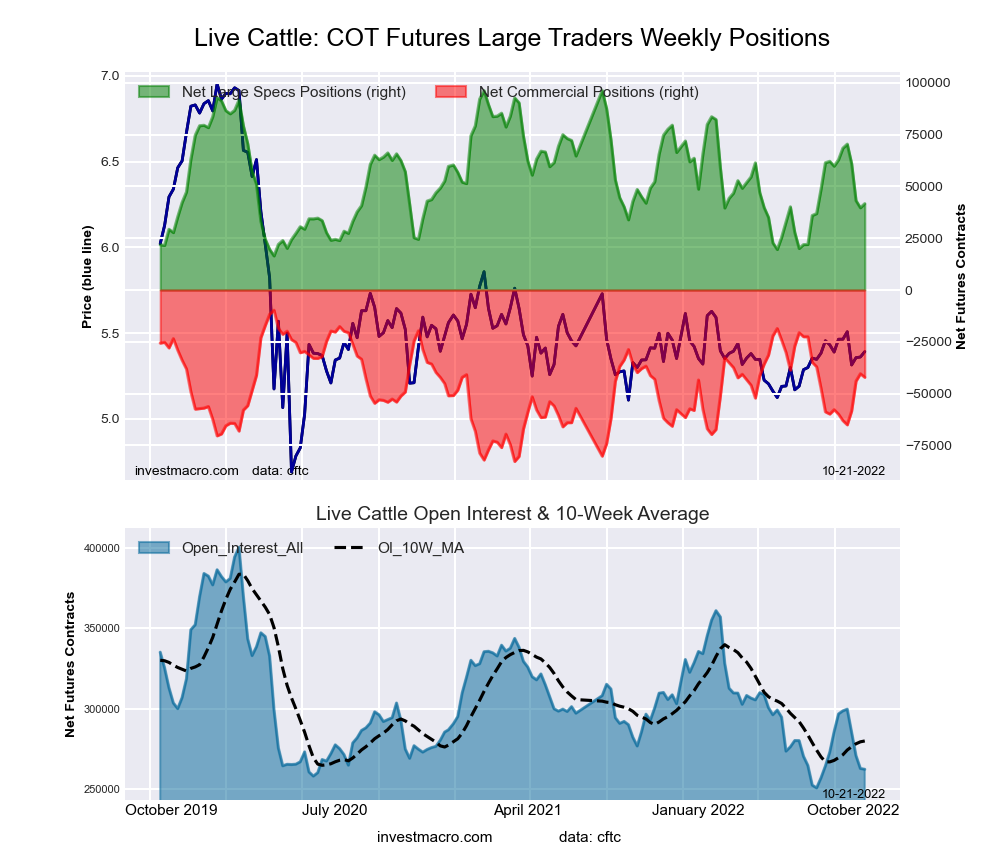
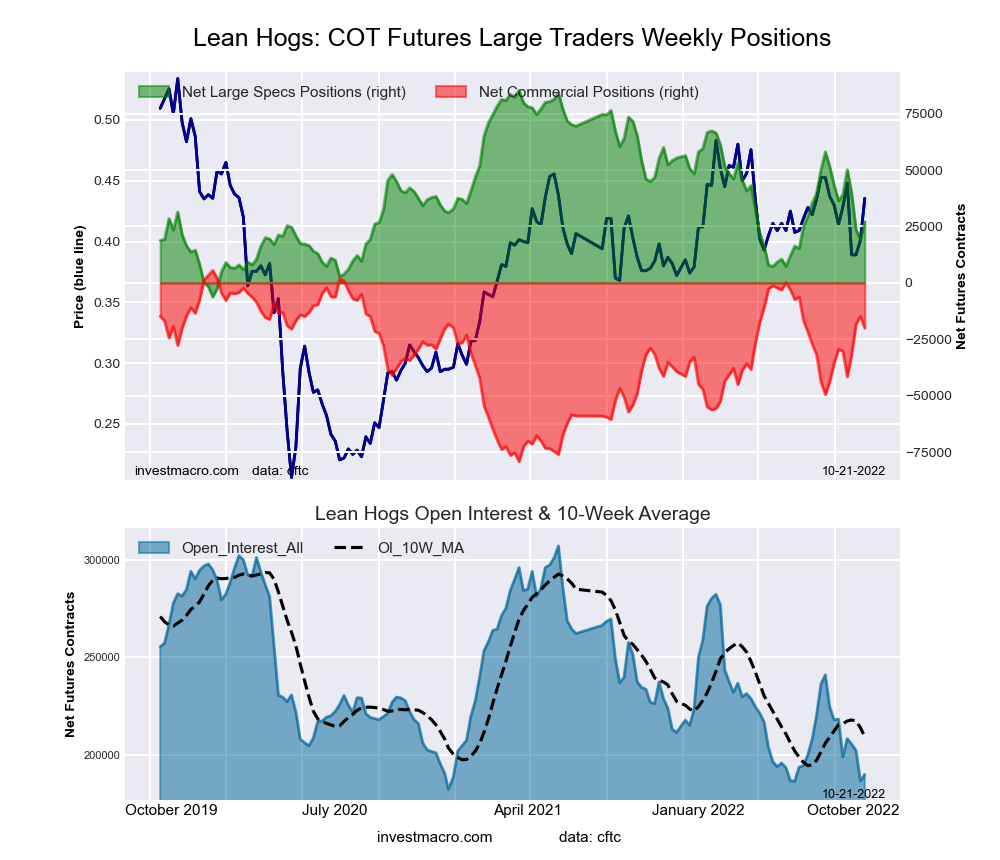
Leading the gains for soft commodities markets was Sugar (25,297 contracts) with Soybean Oil (18,444 contracts), Lean Hogs (7,948 contracts), Soybean Meal (2,531 contracts) and Live Cattle (1,991 contracts) also showing positive weeks.
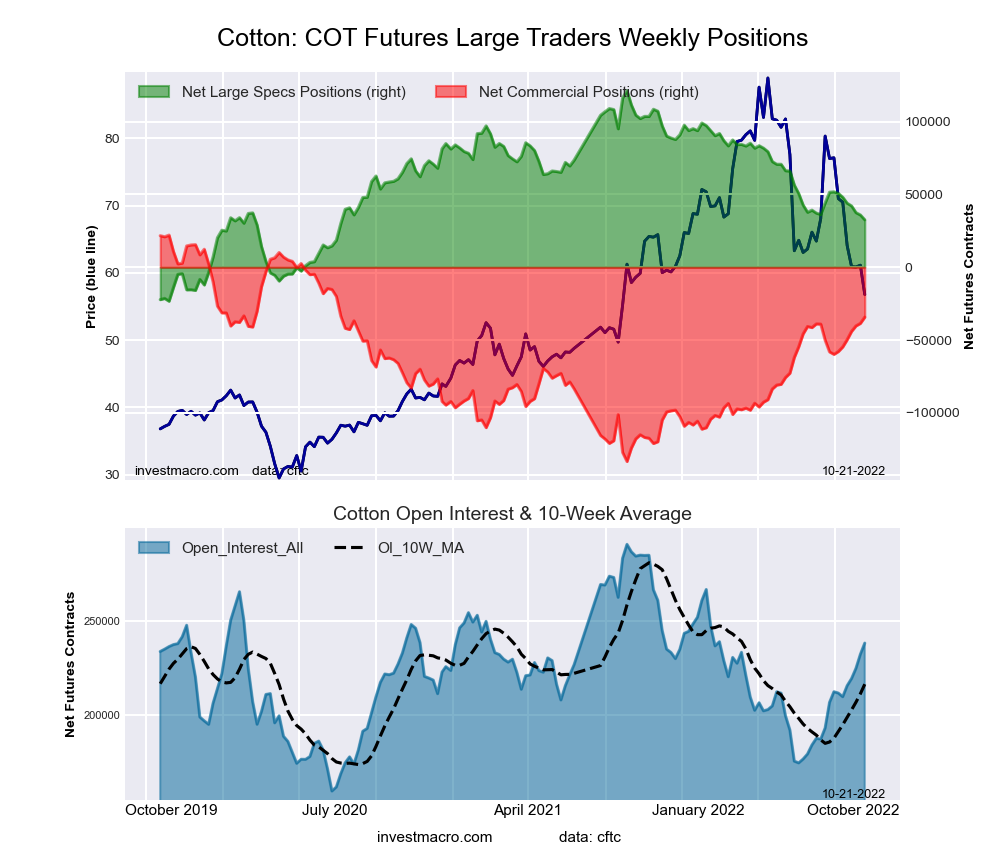
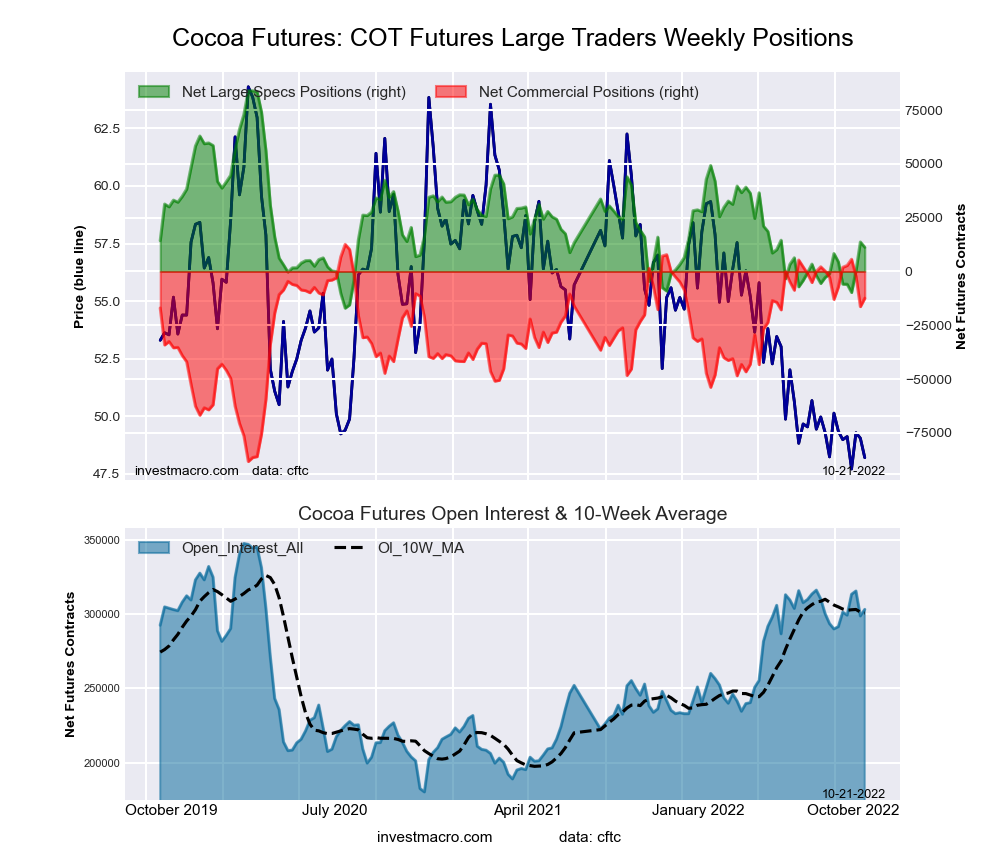
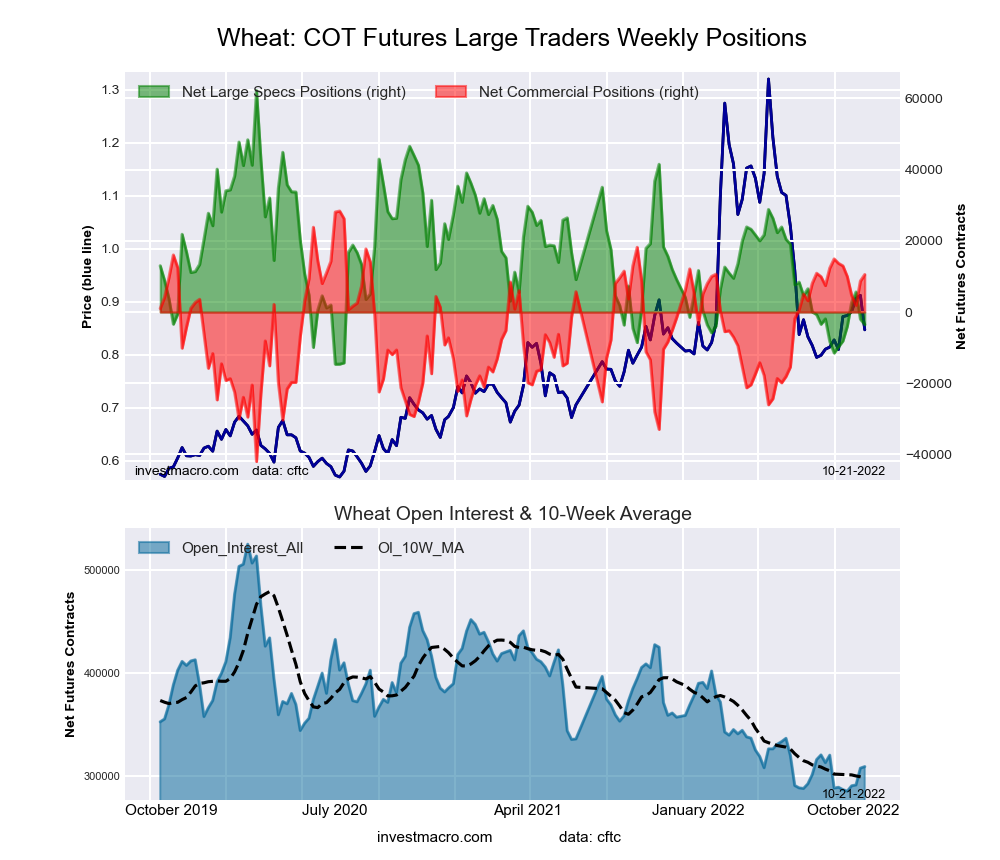
The softs market leading the declines in speculator bets this week was Coffee (-21,311 contracts) with Corn (-12,702 contracts), Cotton (-3,338 contracts), Cocoa (-2,468 contracts), Wheat (-1,551 contracts) and Soybeans (-1,086 contracts) also registering lower bets on the week.
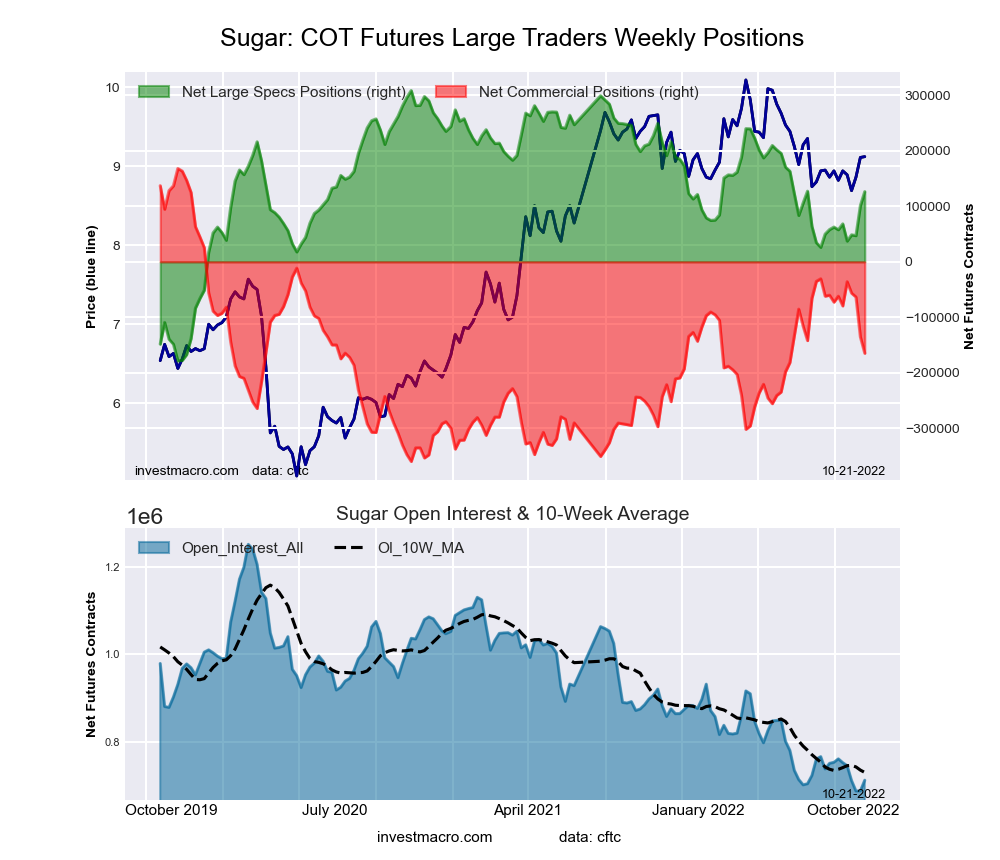
Highlighting the COT soft commodities data this week was the speculator positions in Sugar. The large speculative position for Sugar has risen sharply for two straight weeks and has advanced in seven out of the past ten weeks. This trader bullishness has brought a gain of +100,347 contracts over just the last ten-week period and pushed overall bullish standing back above the +100,000 net contract level for the first time since July.
Sugar prices and sentiment have been boosted higher by lower production numbers and higher prices out of Europe as well as Brazil this year. Prices closed this week around the 18.40 level and have been in a range between 17 and 20.70 since July of 2021.
| Oct-18-2022 | OI | OI-Index | Spec-Net | Spec-Index | Com-Net | COM-Index | Smalls-Net | Smalls-Index |
|---|---|---|---|---|---|---|---|---|
| WTI Crude | 1,454,431 | 0 | 251,545 | 11 | -273,757 | 90 | 22,212 | 37 |
| Gold | 434,701 | 1 | 76,956 | 8 | -90,030 | 91 | 13,074 | 12 |
| Silver | 136,055 | 9 | 1,267 | 15 | -9,085 | 87 | 7,818 | 8 |
| Copper | 178,730 | 17 | -20,302 | 20 | 19,696 | 82 | 606 | 29 |
| Palladium | 6,805 | 4 | -1,209 | 16 | 1,444 | 82 | -235 | 30 |
| Platinum | 53,728 | 11 | 8,494 | 21 | -11,632 | 81 | 3,138 | 10 |
| Natural Gas | 963,792 | 3 | -154,734 | 32 | 126,760 | 71 | 27,974 | 46 |
| Brent | 163,296 | 11 | -41,847 | 41 | 38,681 | 58 | 3,166 | 52 |
| Heating Oil | 283,702 | 29 | 24,555 | 79 | -44,031 | 24 | 19,476 | 66 |
| Soybeans | 714,532 | 30 | 54,683 | 30 | -30,595 | 77 | -24,088 | 30 |
| Corn | 1,419,087 | 22 | 312,419 | 70 | -249,255 | 36 | -63,164 | 7 |
| Coffee | 196,729 | 9 | 19,223 | 53 | -21,605 | 52 | 2,382 | 24 |
| Sugar | 711,664 | 4 | 126,412 | 63 | -164,671 | 37 | 38,259 | 55 |
| Wheat | 309,429 | 10 | -3,541 | 14 | 10,534 | 75 | -6,993 | 74 |
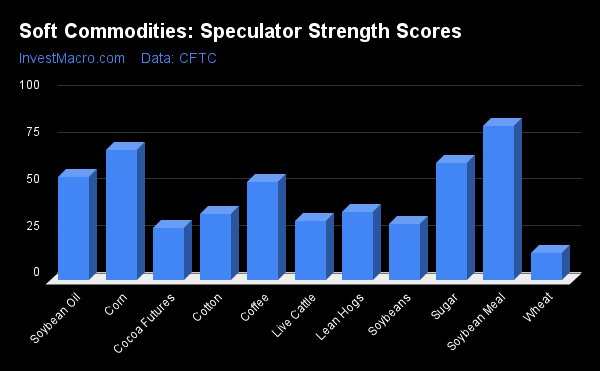
Strength Scores (a normalized measure of Speculator positions over a 3-Year range, from 0 to 100 where above 80 is extreme bullish and below 20 is extreme bearish) showed that Soybean Meal (82.7 percent) and the XXXX lead the soft commodity markets and remains in a bullish extreme position (above 80 percent). Corn (69.9 percent) and Sugar (62.5 percent) come in as the next highest soft commodity markets in strength scores.
On the downside, Wheat (14.4 percent) comes in at the lowest strength level currently and is a bearish extreme level (below 20 percent).
Strength Statistics:
Corn (69.9 percent) vs Corn previous week (71.6 percent)
Sugar (62.5 percent) vs Sugar previous week (57.3 percent)
Coffee (52.5 percent) vs Coffee previous week (72.1 percent)
Soybeans (30.2 percent) vs Soybeans previous week (30.5 percent)
Soybean Oil (55.4 percent) vs Soybean Oil previous week (42.7 percent)
Soybean Meal (82.7 percent) vs Soybean Meal previous week (81.3 percent)
Live Cattle (31.6 percent) vs Live Cattle previous week (29.1 percent)
Lean Hogs (36.3 percent) vs Lean Hogs previous week (27.6 percent)
Cotton (35.3 percent) vs Cotton previous week (37.7 percent)
Cocoa (27.9 percent) vs Cocoa previous week (30.4 percent)
Wheat (14.4 percent) vs Wheat previous week (16.5 percent)
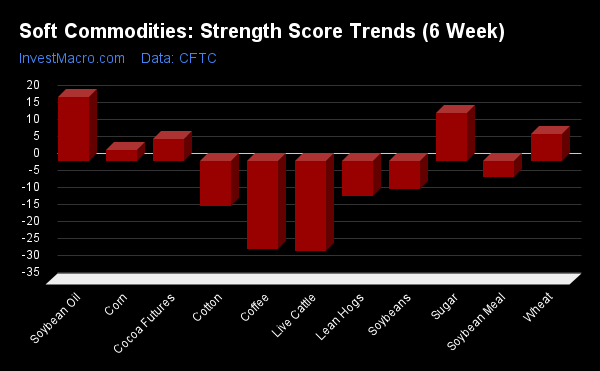
Strength Score Trends (or move index, calculates the 6-week changes in strength scores) show that Soybean Oil (18.9 percent) leads the past six weeks trends for soft commodity markets this week. Sugar (14.1 percent), Wheat (8.1 percent), Cocoa (6.7 percent) and Corn (3.3 percent) fill out the other positive movers in the latest trends data.
Live Cattle (-26.5 percent) and Coffee (-25.7 percent) lead the downside trend scores currently while the next market with lower trend scores was Cotton (-13.2 percent) followed by Lean Hogs (-10.1 percent).
Strength Trend Statistics:
Corn (3.3 percent) vs Corn previous week (5.3 percent)
Sugar (14.1 percent) vs Sugar previous week (7.9 percent)
Coffee (-25.7 percent) vs Coffee previous week (-7.5 percent)
Soybeans (-8.2 percent) vs Soybeans previous week (-8.5 percent)
Soybean Oil (18.9 percent) vs Soybean Oil previous week (2.7 percent)
Soybean Meal (-4.5 percent) vs Soybean Meal previous week (-10.9 percent)
Live Cattle (-26.5 percent) vs Live Cattle previous week (-25.2 percent)
Lean Hogs (-10.1 percent) vs Lean Hogs previous week (-26.2 percent)
Cotton (-13.2 percent) vs Cotton previous week (-11.6 percent)
Cocoa (6.7 percent) vs Cocoa previous week (5.3 percent)
Wheat (8.1 percent) vs Wheat previous week (12.4 percent)
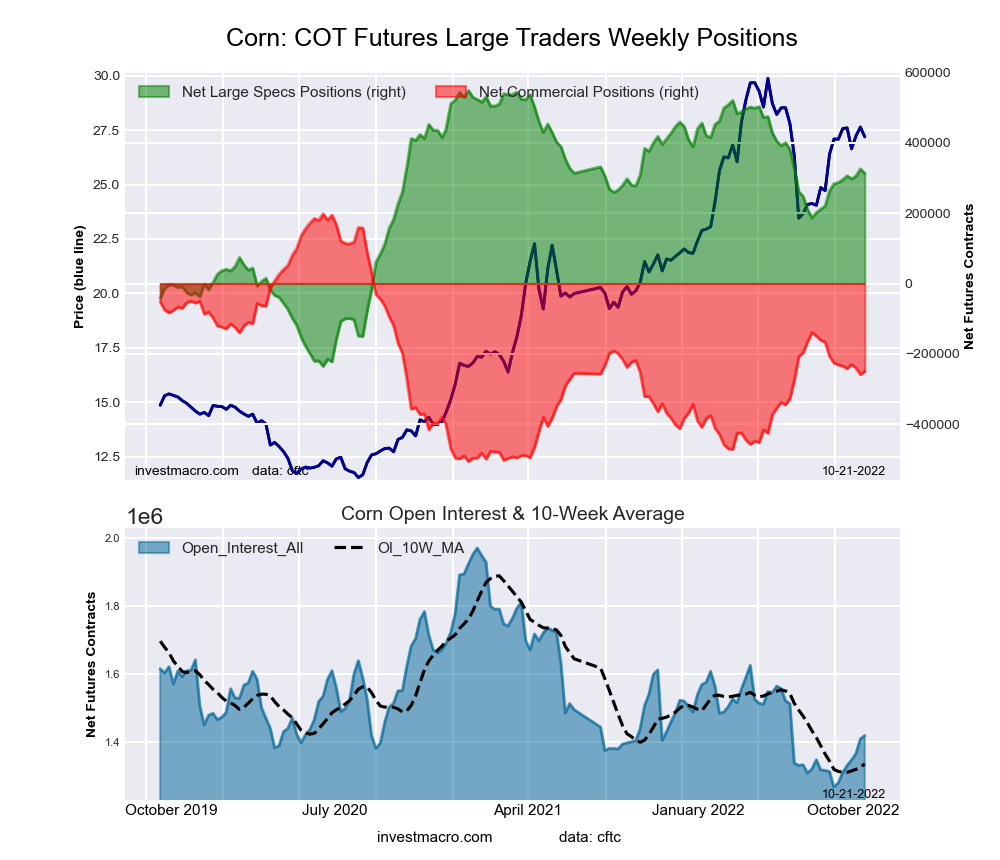
This week’s current strength score (the trader positioning range over the past three years, measured from 0 to 100) shows the speculators are currently Bullish with a score of 69.9 percent. The commercials are Bearish with a score of 36.4 percent and the small traders (not shown in chart) are Bearish-Extreme with a score of 6.7 percent.
| CORN Futures Statistics | SPECULATORS | COMMERCIALS | SMALL TRADERS |
| – Percent of Open Interest Longs: | 30.9 | 44.8 | 8.9 |
| – Percent of Open Interest Shorts: | 8.8 | 62.3 | 13.3 |
| – Net Position: | 312,419 | -249,255 | -63,164 |
| – Gross Longs: | 437,906 | 635,253 | 126,283 |
| – Gross Shorts: | 125,487 | 884,508 | 189,447 |
| – Long to Short Ratio: | 3.5 to 1 | 0.7 to 1 | 0.7 to 1 |
| NET POSITION TREND: | |||
| – Strength Index Score (3 Year Range Pct): | 69.9 | 36.4 | 6.7 |
| – Strength Index Reading (3 Year Range): | Bullish | Bearish | Bearish-Extreme |
| NET POSITION MOVEMENT INDEX: | |||
| – 6-Week Change in Strength Index: | 3.3 | -2.6 | -4.2 |
This week’s current strength score (the trader positioning range over the past three years, measured from 0 to 100) shows the speculators are currently Bullish with a score of 62.5 percent. The commercials are Bearish with a score of 37.3 percent and the small traders (not shown in chart) are Bullish with a score of 55.2 percent.
| SUGAR Futures Statistics | SPECULATORS | COMMERCIALS | SMALL TRADERS |
| – Percent of Open Interest Longs: | 28.9 | 48.1 | 11.8 |
| – Percent of Open Interest Shorts: | 11.1 | 71.2 | 6.4 |
| – Net Position: | 126,412 | -164,671 | 38,259 |
| – Gross Longs: | 205,568 | 342,150 | 83,657 |
| – Gross Shorts: | 79,156 | 506,821 | 45,398 |
| – Long to Short Ratio: | 2.6 to 1 | 0.7 to 1 | 1.8 to 1 |
| NET POSITION TREND: | |||
| – Strength Index Score (3 Year Range Pct): | 62.5 | 37.3 | 55.2 |
| – Strength Index Reading (3 Year Range): | Bullish | Bearish | Bullish |
| NET POSITION MOVEMENT INDEX: | |||
| – 6-Week Change in Strength Index: | 14.1 | -19.6 | 42.1 |
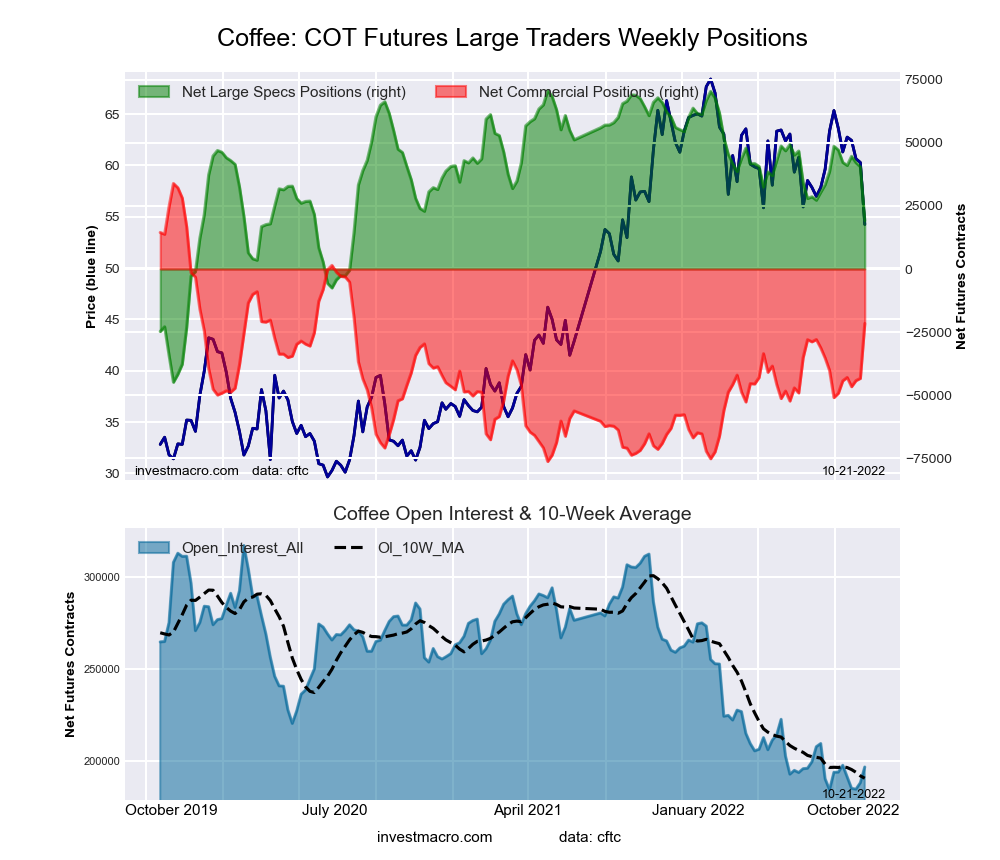
This week’s current strength score (the trader positioning range over the past three years, measured from 0 to 100) shows the speculators are currently Bullish with a score of 52.5 percent. The commercials are Bullish with a score of 52.4 percent and the small traders (not shown in chart) are Bearish with a score of 24.4 percent.
| COFFEE Futures Statistics | SPECULATORS | COMMERCIALS | SMALL TRADERS |
| – Percent of Open Interest Longs: | 20.9 | 51.5 | 4.6 |
| – Percent of Open Interest Shorts: | 11.1 | 62.4 | 3.4 |
| – Net Position: | 19,223 | -21,605 | 2,382 |
| – Gross Longs: | 41,151 | 101,222 | 9,017 |
| – Gross Shorts: | 21,928 | 122,827 | 6,635 |
| – Long to Short Ratio: | 1.9 to 1 | 0.8 to 1 | 1.4 to 1 |
| NET POSITION TREND: | |||
| – Strength Index Score (3 Year Range Pct): | 52.5 | 52.4 | 24.4 |
| – Strength Index Reading (3 Year Range): | Bullish | Bullish | Bearish |
| NET POSITION MOVEMENT INDEX: | |||
| – 6-Week Change in Strength Index: | -25.7 | 26.5 | 2.9 |
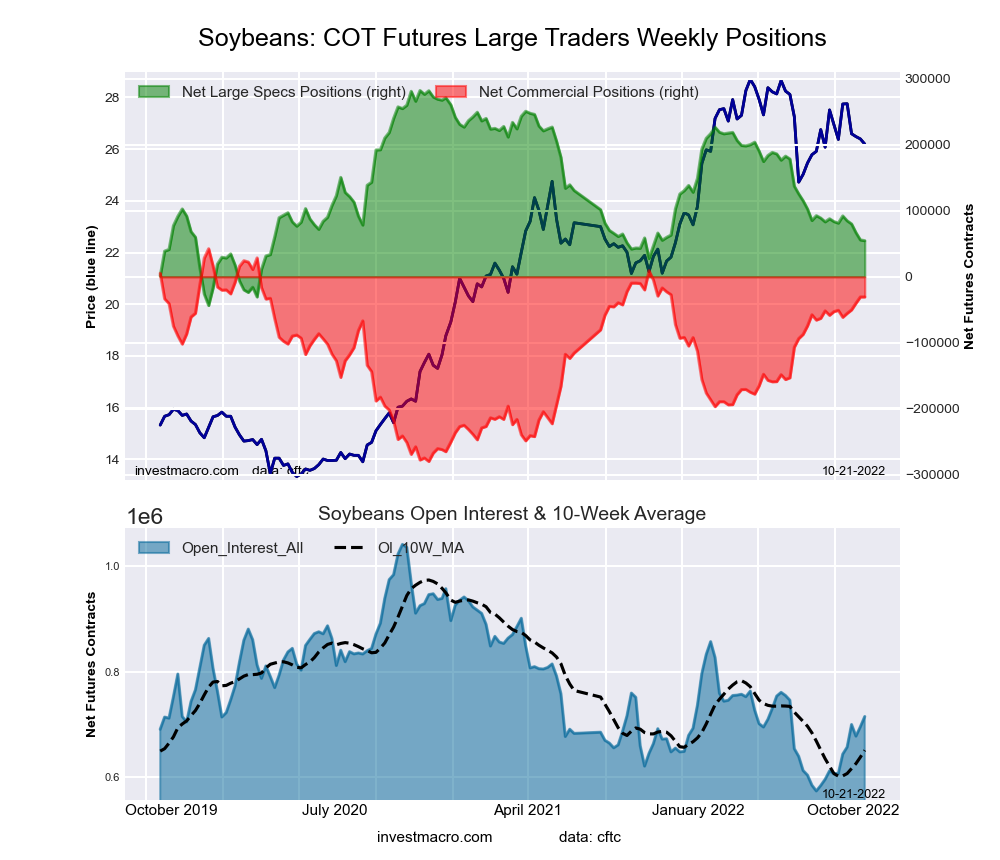
This week’s current strength score (the trader positioning range over the past three years, measured from 0 to 100) shows the speculators are currently Bearish with a score of 30.2 percent. The commercials are Bullish with a score of 77.3 percent and the small traders (not shown in chart) are Bearish with a score of 30.4 percent.
| SOYBEANS Futures Statistics | SPECULATORS | COMMERCIALS | SMALL TRADERS |
| – Percent of Open Interest Longs: | 18.5 | 54.5 | 7.1 |
| – Percent of Open Interest Shorts: | 10.8 | 58.8 | 10.5 |
| – Net Position: | 54,683 | -30,595 | -24,088 |
| – Gross Longs: | 132,144 | 389,695 | 50,829 |
| – Gross Shorts: | 77,461 | 420,290 | 74,917 |
| – Long to Short Ratio: | 1.7 to 1 | 0.9 to 1 | 0.7 to 1 |
| NET POSITION TREND: | |||
| – Strength Index Score (3 Year Range Pct): | 30.2 | 77.3 | 30.4 |
| – Strength Index Reading (3 Year Range): | Bearish | Bullish | Bearish |
| NET POSITION MOVEMENT INDEX: | |||
| – 6-Week Change in Strength Index: | -8.2 | 6.3 | 10.7 |
This week’s current strength score (the trader positioning range over the past three years, measured from 0 to 100) shows the speculators are currently Bullish with a score of 55.4 percent. The commercials are Bearish with a score of 42.7 percent and the small traders (not shown in chart) are Bullish with a score of 70.2 percent.
| SOYBEAN OIL Futures Statistics | SPECULATORS | COMMERCIALS | SMALL TRADERS |
| – Percent of Open Interest Longs: | 26.0 | 45.1 | 9.1 |
| – Percent of Open Interest Shorts: | 7.2 | 67.6 | 5.3 |
| – Net Position: | 76,323 | -91,542 | 15,219 |
| – Gross Longs: | 105,679 | 183,264 | 36,918 |
| – Gross Shorts: | 29,356 | 274,806 | 21,699 |
| – Long to Short Ratio: | 3.6 to 1 | 0.7 to 1 | 1.7 to 1 |
| NET POSITION TREND: | |||
| – Strength Index Score (3 Year Range Pct): | 55.4 | 42.7 | 70.2 |
| – Strength Index Reading (3 Year Range): | Bullish | Bearish | Bullish |
| NET POSITION MOVEMENT INDEX: | |||
| – 6-Week Change in Strength Index: | 18.9 | -22.8 | 33.0 |
This week’s current strength score (the trader positioning range over the past three years, measured from 0 to 100) shows the speculators are currently Bullish-Extreme with a score of 82.7 percent. The commercials are Bearish-Extreme with a score of 19.5 percent and the small traders (not shown in chart) are Bullish with a score of 52.0 percent.
| SOYBEAN MEAL Futures Statistics | SPECULATORS | COMMERCIALS | SMALL TRADERS |
| – Percent of Open Interest Longs: | 32.1 | 41.0 | 13.0 |
| – Percent of Open Interest Shorts: | 5.5 | 73.8 | 6.9 |
| – Net Position: | 99,132 | -122,110 | 22,978 |
| – Gross Longs: | 119,484 | 152,664 | 48,567 |
| – Gross Shorts: | 20,352 | 274,774 | 25,589 |
| – Long to Short Ratio: | 5.9 to 1 | 0.6 to 1 | 1.9 to 1 |
| NET POSITION TREND: | |||
| – Strength Index Score (3 Year Range Pct): | 82.7 | 19.5 | 52.0 |
| – Strength Index Reading (3 Year Range): | Bullish-Extreme | Bearish-Extreme | Bullish |
| NET POSITION MOVEMENT INDEX: | |||
| – 6-Week Change in Strength Index: | -4.5 | 2.4 | 17.9 |
This week’s current strength score (the trader positioning range over the past three years, measured from 0 to 100) shows the speculators are currently Bearish with a score of 31.6 percent. The commercials are Bullish with a score of 55.6 percent and the small traders (not shown in chart) are Bullish-Extreme with a score of 98.4 percent.
| LIVE CATTLE Futures Statistics | SPECULATORS | COMMERCIALS | SMALL TRADERS |
| – Percent of Open Interest Longs: | 32.4 | 36.3 | 12.7 |
| – Percent of Open Interest Shorts: | 16.5 | 52.4 | 12.5 |
| – Net Position: | 41,656 | -42,115 | 459 |
| – Gross Longs: | 85,057 | 95,288 | 33,243 |
| – Gross Shorts: | 43,401 | 137,403 | 32,784 |
| – Long to Short Ratio: | 2.0 to 1 | 0.7 to 1 | 1.0 to 1 |
| NET POSITION TREND: | |||
| – Strength Index Score (3 Year Range Pct): | 31.6 | 55.6 | 98.4 |
| – Strength Index Reading (3 Year Range): | Bearish | Bullish | Bullish-Extreme |
| NET POSITION MOVEMENT INDEX: | |||
| – 6-Week Change in Strength Index: | -26.5 | 24.4 | 13.9 |
This week’s current strength score (the trader positioning range over the past three years, measured from 0 to 100) shows the speculators are currently Bearish with a score of 36.3 percent. The commercials are Bullish with a score of 69.8 percent and the small traders (not shown in chart) are Bullish with a score of 59.7 percent.
| LEAN HOGS Futures Statistics | SPECULATORS | COMMERCIALS | SMALL TRADERS |
| – Percent of Open Interest Longs: | 37.4 | 36.6 | 10.0 |
| – Percent of Open Interest Shorts: | 23.1 | 47.2 | 13.7 |
| – Net Position: | 27,089 | -19,993 | -7,096 |
| – Gross Longs: | 70,919 | 69,501 | 18,957 |
| – Gross Shorts: | 43,830 | 89,494 | 26,053 |
| – Long to Short Ratio: | 1.6 to 1 | 0.8 to 1 | 0.7 to 1 |
| NET POSITION TREND: | |||
| – Strength Index Score (3 Year Range Pct): | 36.3 | 69.8 | 59.7 |
| – Strength Index Reading (3 Year Range): | Bearish | Bullish | Bullish |
| NET POSITION MOVEMENT INDEX: | |||
| – 6-Week Change in Strength Index: | -10.1 | 11.1 | -0.8 |
This week’s current strength score (the trader positioning range over the past three years, measured from 0 to 100) shows the speculators are currently Bearish with a score of 35.3 percent. The commercials are Bullish with a score of 66.6 percent and the small traders (not shown in chart) are Bearish with a score of 21.1 percent.
| COTTON Futures Statistics | SPECULATORS | COMMERCIALS | SMALL TRADERS |
| – Percent of Open Interest Longs: | 29.9 | 50.2 | 5.4 |
| – Percent of Open Interest Shorts: | 16.3 | 64.5 | 4.7 |
| – Net Position: | 32,563 | -34,238 | 1,675 |
| – Gross Longs: | 71,299 | 119,480 | 12,911 |
| – Gross Shorts: | 38,736 | 153,718 | 11,236 |
| – Long to Short Ratio: | 1.8 to 1 | 0.8 to 1 | 1.1 to 1 |
| NET POSITION TREND: | |||
| – Strength Index Score (3 Year Range Pct): | 35.3 | 66.6 | 21.1 |
| – Strength Index Reading (3 Year Range): | Bearish | Bullish | Bearish |
| NET POSITION MOVEMENT INDEX: | |||
| – 6-Week Change in Strength Index: | -13.2 | 15.9 | -35.4 |
This week’s current strength score (the trader positioning range over the past three years, measured from 0 to 100) shows the speculators are currently Bearish with a score of 27.9 percent. The commercials are Bullish with a score of 75.2 percent and the small traders (not shown in chart) are Bearish-Extreme with a score of 8.7 percent.
| COCOA Futures Statistics | SPECULATORS | COMMERCIALS | SMALL TRADERS |
| – Percent of Open Interest Longs: | 31.7 | 46.2 | 4.0 |
| – Percent of Open Interest Shorts: | 28.0 | 50.3 | 3.6 |
| – Net Position: | 11,218 | -12,445 | 1,227 |
| – Gross Longs: | 95,953 | 140,015 | 12,138 |
| – Gross Shorts: | 84,735 | 152,460 | 10,911 |
| – Long to Short Ratio: | 1.1 to 1 | 0.9 to 1 | 1.1 to 1 |
| NET POSITION TREND: | |||
| – Strength Index Score (3 Year Range Pct): | 27.9 | 75.2 | 8.7 |
| – Strength Index Reading (3 Year Range): | Bearish | Bullish | Bearish-Extreme |
| NET POSITION MOVEMENT INDEX: | |||
| – 6-Week Change in Strength Index: | 6.7 | -5.2 | -15.4 |
This week’s current strength score (the trader positioning range over the past three years, measured from 0 to 100) shows the speculators are currently Bearish-Extreme with a score of 14.4 percent. The commercials are Bullish with a score of 74.6 percent and the small traders (not shown in chart) are Bullish with a score of 74.1 percent.
| WHEAT Futures Statistics | SPECULATORS | COMMERCIALS | SMALL TRADERS |
| – Percent of Open Interest Longs: | 27.8 | 40.6 | 8.7 |
| – Percent of Open Interest Shorts: | 28.9 | 37.2 | 10.9 |
| – Net Position: | -3,541 | 10,534 | -6,993 |
| – Gross Longs: | 86,038 | 125,771 | 26,783 |
| – Gross Shorts: | 89,579 | 115,237 | 33,776 |
| – Long to Short Ratio: | 1.0 to 1 | 1.1 to 1 | 0.8 to 1 |
| NET POSITION TREND: | |||
| – Strength Index Score (3 Year Range Pct): | 14.4 | 74.6 | 74.1 |
| – Strength Index Reading (3 Year Range): | Bearish-Extreme | Bullish | Bullish |
| NET POSITION MOVEMENT INDEX: | |||
| – 6-Week Change in Strength Index: | 8.1 | -4.5 | -16.0 |
Article By InvestMacro – Receive our weekly COT Newsletter
*COT Report: The COT data, released weekly to the public each Friday, is updated through the most recent Tuesday (data is 3 days old) and shows a quick view of how large speculators or non-commercials (for-profit traders) were positioned in the futures markets.
The CFTC categorizes trader positions according to commercial hedgers (traders who use futures contracts for hedging as part of the business), non-commercials (large traders who speculate to realize trading profits) and nonreportable traders (usually small traders/speculators) as well as their open interest (contracts open in the market at time of reporting). See CFTC criteria here.
By JustMarkets The US stock indices started the week on a downbeat note. By the…
By Analytical Department RoboForex GBP/USD fell to 1.3437 on Tuesday as investors assessed the appointment…
By JustMarkets The US stock indices ended Friday’s session in the red. By the end…
By Analytical Department RoboForex USD/JPY opens the week at 162.36 on Monday. The Japanese yen…
By InvestMacro Here are the latest charts and statistics for the Commitment of Traders (COT)…
By InvestMacro The latest update for the weekly Commitment of Traders (COT) report was released…
This website uses cookies.