By InvestMacro | COT | Data Tables | COT Leaders | Downloads | COT Newsletter
Here are the latest charts and statistics for the Commitment of Traders (COT) data published by the Commodities Futures Trading Commission (CFTC).
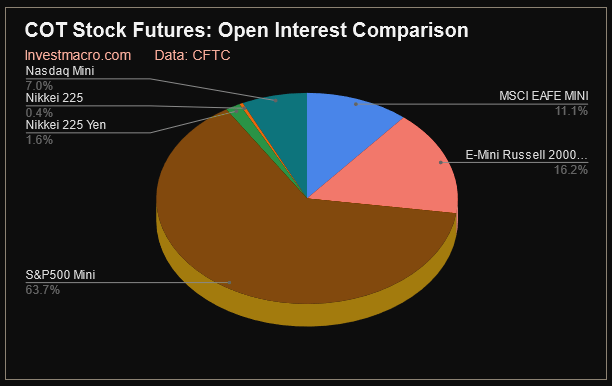
The latest COT data is updated through Tuesday June 28th and shows a quick view of how large traders (for-profit speculators and commercial entities) were positioned in the futures markets.
The stock market speculator bets were mostly lower this week as three out of the eight stock markets we cover had very small gains in positioning this week while five markets had lower contracts.
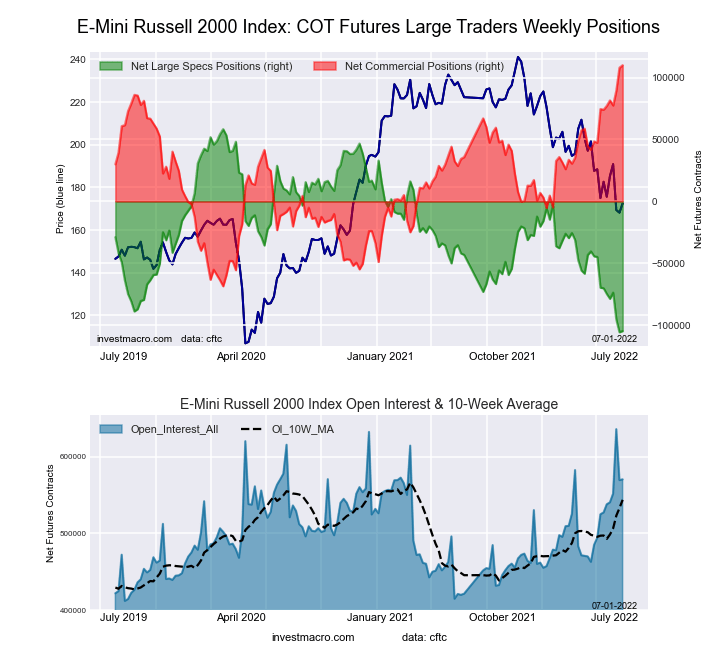
Leading the gains for stock markets was Russell 2000 Mini (976 contracts) with the Dow Jones Industrial Average Mini (400 contracts) and VIX (354 contracts) also showing a positive weeks.
Free Reports:
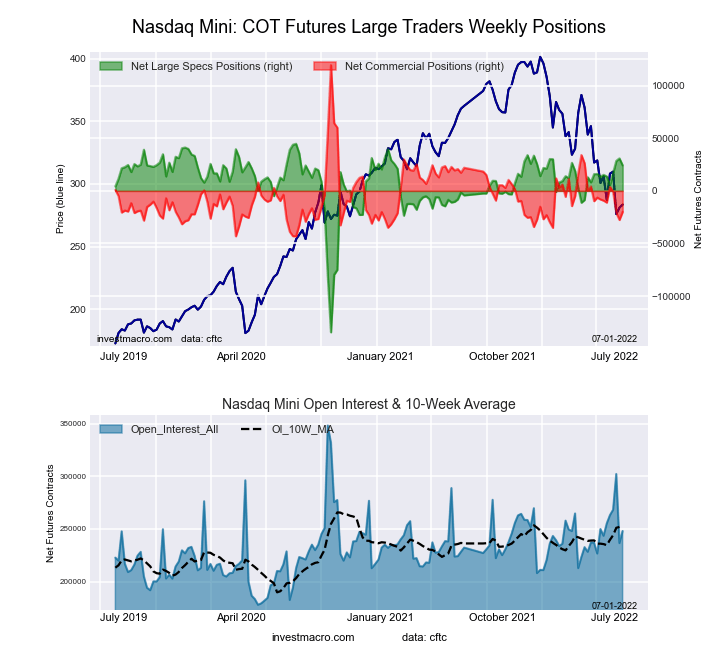
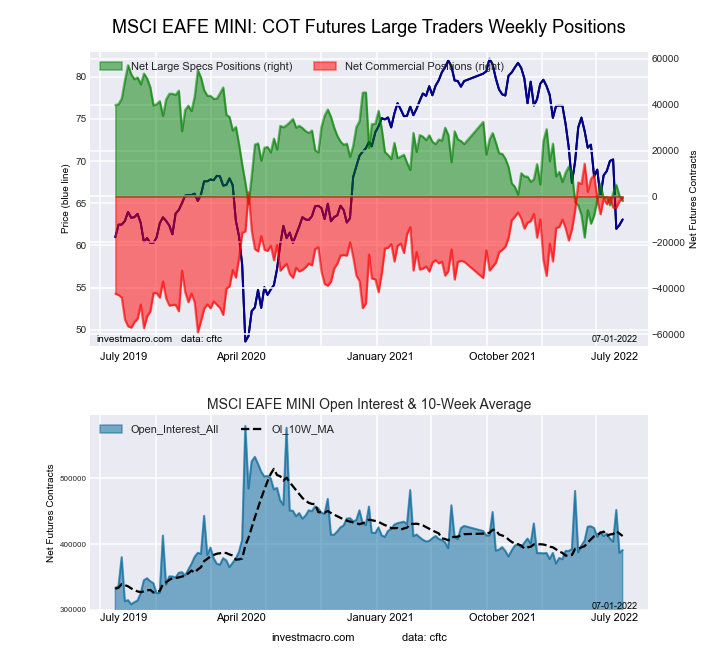
Meanwhile, leading the decreases in speculator bets this week were the S&P500 Mini (-24,907 contracts) and the Nasdaq Mini (-6,616 contracts) with the MSCI Emerging Markets Mini (-6,141 contracts), MSCI EAFE Mini (-2,182 contracts) and Nikkei 225 USD (-23 contracts) also registering lower bets on the week.
Strength scores (3-Year range of Speculator positions, from 0 to 100 where above 80 percent is extreme bullish and below 20 percent is extreme bearish) show that the Nasdaq Mini leads currently with an extreme bullish score of 89 percent. The VIX is also at an extreme bullish score of 84.4 percent while on the downside, the Russell 2000 Mini (1 percent) and the Dow Jones Mini (4.6 percent) are both in extreme bearish positions.
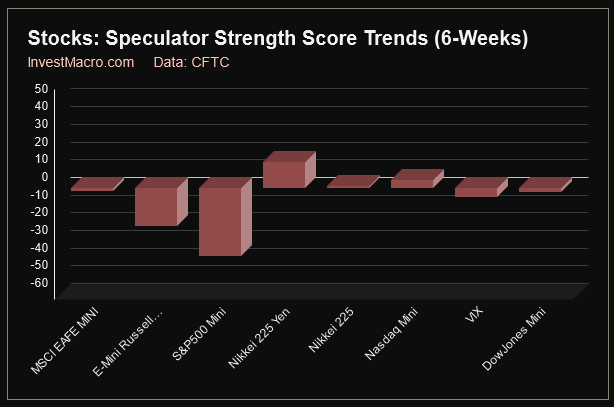
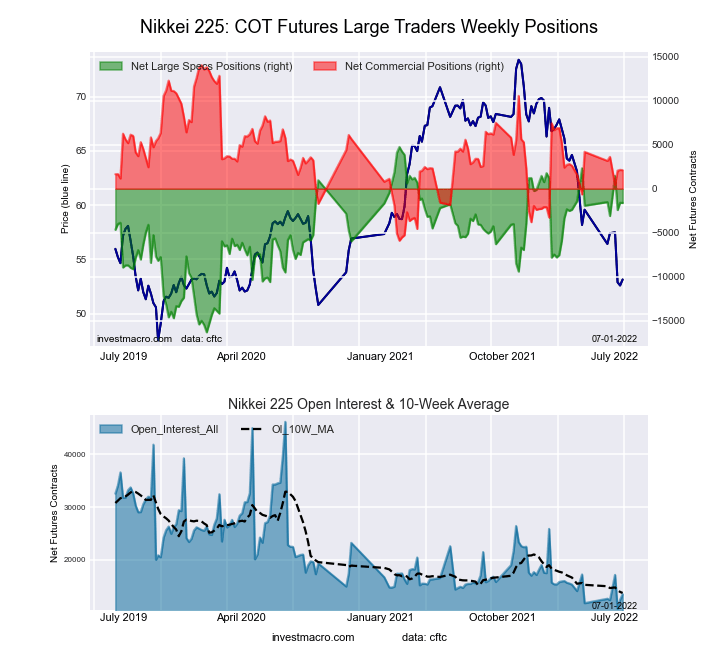
Strength score trends (or move index, that calculates the 6-week changes in strength scores) show that the Nikkei 225 Yen (15 percent), Nasdaq Mini (5 percent) and the Nikkei 225 USD (2 percent) are the only markets with rising scores over the past six weeks. The S&P Mini (-38 percent) and the Russell 2000 Mini (-21 percent) lead the downward trends of strength scores.
| Jun-28-2022 | OI | OI-Index | Spec-Net | Spec-Index | Com-Net | COM-Index | Smalls-Net | Smalls-Index |
|---|---|---|---|---|---|---|---|---|
| S&P500-Mini | 2,248,771 | 6 | -139,226 | 30 | 168,405 | 96 | -29,179 | 20 |
| Nikkei 225 | 13,442 | 8 | -1,615 | 70 | 2,101 | 40 | -486 | 22 |
| Nasdaq-Mini | 248,045 | 41 | 24,190 | 89 | -19,930 | 14 | -4,260 | 40 |
| DowJones-Mini | 66,759 | 23 | -25,073 | 5 | 29,675 | 99 | -4,602 | 14 |
| VIX | 257,123 | 14 | -49,569 | 84 | 56,789 | 17 | -7,220 | 56 |
| Nikkei 225 Yen | 56,111 | 38 | 2,330 | 41 | 24,398 | 87 | -26,728 | 20 |
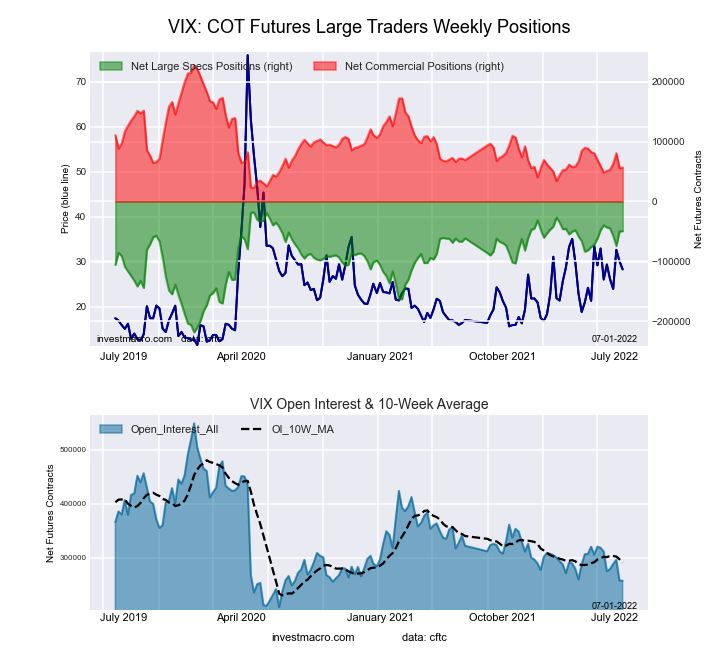
This week’s current strength score (the trader positioning range over the past three years, measured from 0 to 100) shows the speculators are currently Bullish-Extreme with a score of 84.4 percent. The commercials are Bearish-Extreme with a score of 16.7 percent and the small traders (not shown in chart) are Bullish with a score of 56.3 percent.
| VIX Volatility Futures Statistics | SPECULATORS | COMMERCIALS | SMALL TRADERS |
| – Percent of Open Interest Longs: | 17.4 | 54.5 | 8.6 |
| – Percent of Open Interest Shorts: | 36.7 | 32.4 | 11.4 |
| – Net Position: | -49,569 | 56,789 | -7,220 |
| – Gross Longs: | 44,726 | 140,039 | 22,123 |
| – Gross Shorts: | 94,295 | 83,250 | 29,343 |
| – Long to Short Ratio: | 0.5 to 1 | 1.7 to 1 | 0.8 to 1 |
| NET POSITION TREND: | |||
| – Strength Index Score (3 Year Range Pct): | 84.4 | 16.7 | 56.3 |
| – Strength Index Reading (3 Year Range): | Bullish-Extreme | Bearish-Extreme | Bullish |
| NET POSITION MOVEMENT INDEX: | |||
| – 6-Week Change in Strength Index: | -5.0 | 4.2 | 6.6 |
This week’s current strength score (the trader positioning range over the past three years, measured from 0 to 100) shows the speculators are currently Bearish with a score of 30.4 percent. The commercials are Bullish-Extreme with a score of 96.1 percent and the small traders (not shown in chart) are Bearish with a score of 20.2 percent.
| S&P500 Mini Futures Statistics | SPECULATORS | COMMERCIALS | SMALL TRADERS |
| – Percent of Open Interest Longs: | 11.0 | 76.8 | 10.0 |
| – Percent of Open Interest Shorts: | 17.2 | 69.3 | 11.3 |
| – Net Position: | -139,226 | 168,405 | -29,179 |
| – Gross Longs: | 248,313 | 1,726,190 | 223,854 |
| – Gross Shorts: | 387,539 | 1,557,785 | 253,033 |
| – Long to Short Ratio: | 0.6 to 1 | 1.1 to 1 | 0.9 to 1 |
| NET POSITION TREND: | |||
| – Strength Index Score (3 Year Range Pct): | 30.4 | 96.1 | 20.2 |
| – Strength Index Reading (3 Year Range): | Bearish | Bullish-Extreme | Bearish |
| NET POSITION MOVEMENT INDEX: | |||
| – 6-Week Change in Strength Index: | -38.1 | 39.6 | -3.2 |
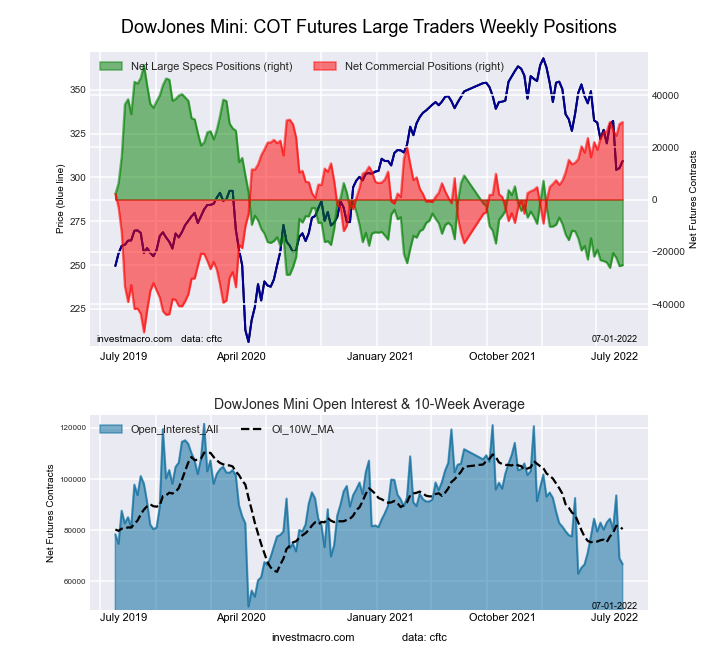
The Dow Jones Mini large speculator standing this week resulted in a net position of -25,073 contracts in the data reported through Tuesday. This was a weekly lift of 400 contracts from the previous week which had a total of -25,473 net contracts.
This week’s current strength score (the trader positioning range over the past three years, measured from 0 to 100) shows the speculators are currently Bearish-Extreme with a score of 4.6 percent. The commercials are Bullish-Extreme with a score of 98.9 percent and the small traders (not shown in chart) are Bearish-Extreme with a score of 13.8 percent.
| Dow Jones Mini Futures Statistics | SPECULATORS | COMMERCIALS | SMALL TRADERS |
| – Percent of Open Interest Longs: | 13.5 | 70.5 | 14.9 |
| – Percent of Open Interest Shorts: | 51.1 | 26.1 | 21.8 |
| – Net Position: | -25,073 | 29,675 | -4,602 |
| – Gross Longs: | 9,011 | 47,089 | 9,948 |
| – Gross Shorts: | 34,084 | 17,414 | 14,550 |
| – Long to Short Ratio: | 0.3 to 1 | 2.7 to 1 | 0.7 to 1 |
| NET POSITION TREND: | |||
| – Strength Index Score (3 Year Range Pct): | 4.6 | 98.9 | 13.8 |
| – Strength Index Reading (3 Year Range): | Bearish-Extreme | Bullish-Extreme | Bearish-Extreme |
| NET POSITION MOVEMENT INDEX: | |||
| – 6-Week Change in Strength Index: | -2.0 | 4.9 | -12.8 |
This week’s current strength score (the trader positioning range over the past three years, measured from 0 to 100) shows the speculators are currently Bullish-Extreme with a score of 88.5 percent. The commercials are Bearish-Extreme with a score of 14.2 percent and the small traders (not shown in chart) are Bearish with a score of 39.7 percent.
| Nasdaq Mini Futures Statistics | SPECULATORS | COMMERCIALS | SMALL TRADERS |
| – Percent of Open Interest Longs: | 31.8 | 51.9 | 14.3 |
| – Percent of Open Interest Shorts: | 22.1 | 59.9 | 16.0 |
| – Net Position: | 24,190 | -19,930 | -4,260 |
| – Gross Longs: | 78,987 | 128,769 | 35,528 |
| – Gross Shorts: | 54,797 | 148,699 | 39,788 |
| – Long to Short Ratio: | 1.4 to 1 | 0.9 to 1 | 0.9 to 1 |
| NET POSITION TREND: | |||
| – Strength Index Score (3 Year Range Pct): | 88.5 | 14.2 | 39.7 |
| – Strength Index Reading (3 Year Range): | Bullish-Extreme | Bearish-Extreme | Bearish |
| NET POSITION MOVEMENT INDEX: | |||
| – 6-Week Change in Strength Index: | 5.0 | -6.6 | 3.5 |
This week’s current strength score (the trader positioning range over the past three years, measured from 0 to 100) shows the speculators are currently Bearish-Extreme with a score of 0.6 percent. The commercials are Bullish-Extreme with a score of 100.0 percent and the small traders (not shown in chart) are Bearish-Extreme with a score of 11.0 percent.
| Russell 2000 Mini Futures Statistics | SPECULATORS | COMMERCIALS | SMALL TRADERS |
| – Percent of Open Interest Longs: | 7.2 | 88.3 | 3.3 |
| – Percent of Open Interest Shorts: | 25.6 | 69.0 | 4.2 |
| – Net Position: | -104,620 | 109,982 | -5,362 |
| – Gross Longs: | 41,196 | 503,528 | 18,674 |
| – Gross Shorts: | 145,816 | 393,546 | 24,036 |
| – Long to Short Ratio: | 0.3 to 1 | 1.3 to 1 | 0.8 to 1 |
| NET POSITION TREND: | |||
| – Strength Index Score (3 Year Range Pct): | 0.6 | 100.0 | 11.0 |
| – Strength Index Reading (3 Year Range): | Bearish-Extreme | Bullish-Extreme | Bearish-Extreme |
| NET POSITION MOVEMENT INDEX: | |||
| – 6-Week Change in Strength Index: | -21.1 | 20.1 | -4.1 |
This week’s current strength score (the trader positioning range over the past three years, measured from 0 to 100) shows the speculators are currently Bullish with a score of 69.8 percent. The commercials are Bearish with a score of 40.1 percent and the small traders (not shown in chart) are Bearish with a score of 22.2 percent.
| Nikkei Stock Average Futures Statistics | SPECULATORS | COMMERCIALS | SMALL TRADERS |
| – Percent of Open Interest Longs: | 31.4 | 52.1 | 16.2 |
| – Percent of Open Interest Shorts: | 43.4 | 36.5 | 19.8 |
| – Net Position: | -1,615 | 2,101 | -486 |
| – Gross Longs: | 4,220 | 7,007 | 2,177 |
| – Gross Shorts: | 5,835 | 4,906 | 2,663 |
| – Long to Short Ratio: | 0.7 to 1 | 1.4 to 1 | 0.8 to 1 |
| NET POSITION TREND: | |||
| – Strength Index Score (3 Year Range Pct): | 69.8 | 40.1 | 22.2 |
| – Strength Index Reading (3 Year Range): | Bullish | Bearish | Bearish |
| NET POSITION MOVEMENT INDEX: | |||
| – 6-Week Change in Strength Index: | 1.5 | -10.4 | 22.2 |
This week’s current strength score (the trader positioning range over the past three years, measured from 0 to 100) shows the speculators are currently Bearish with a score of 21.8 percent. The commercials are Bullish with a score of 79.9 percent and the small traders (not shown in chart) are Bearish with a score of 40.7 percent.
| MSCI EAFE Mini Futures Statistics | SPECULATORS | COMMERCIALS | SMALL TRADERS |
| – Percent of Open Interest Longs: | 5.1 | 92.2 | 2.0 |
| – Percent of Open Interest Shorts: | 5.6 | 92.3 | 1.3 |
| – Net Position: | -1,986 | -510 | 2,496 |
| – Gross Longs: | 19,973 | 360,111 | 7,717 |
| – Gross Shorts: | 21,959 | 360,621 | 5,221 |
| – Long to Short Ratio: | 0.9 to 1 | 1.0 to 1 | 1.5 to 1 |
| NET POSITION TREND: | |||
| – Strength Index Score (3 Year Range Pct): | 21.8 | 79.9 | 40.7 |
| – Strength Index Reading (3 Year Range): | Bearish | Bullish | Bearish |
| NET POSITION MOVEMENT INDEX: | |||
| – 6-Week Change in Strength Index: | -1.5 | 0.5 | 6.8 |
Article By InvestMacro – Receive our weekly COT Reports by Email
*COT Report: The COT data, released weekly to the public each Friday, is updated through the most recent Tuesday (data is 3 days old) and shows a quick view of how large speculators or non-commercials (for-profit traders) were positioned in the futures markets.
The CFTC categorizes trader positions according to commercial hedgers (traders who use futures contracts for hedging as part of the business), non-commercials (large traders who speculate to realize trading profits) and nonreportable traders (usually small traders/speculators) as well as their open interest (contracts open in the market at time of reporting).See CFTC criteria here.
By JustMarkets The US stock indices started the week on a downbeat note. By the…
By Analytical Department RoboForex GBP/USD fell to 1.3437 on Tuesday as investors assessed the appointment…
By JustMarkets The US stock indices ended Friday’s session in the red. By the end…
By Analytical Department RoboForex USD/JPY opens the week at 162.36 on Monday. The Japanese yen…
By InvestMacro Here are the latest charts and statistics for the Commitment of Traders (COT)…
By InvestMacro The latest update for the weekly Commitment of Traders (COT) report was released…
This website uses cookies.