By InvestMacro | COT | Data Tables | COT Leaders | Downloads | COT Newsletter
Here are the latest charts and statistics for the Commitment of Traders (COT) data published by the Commodities Futures Trading Commission (CFTC).
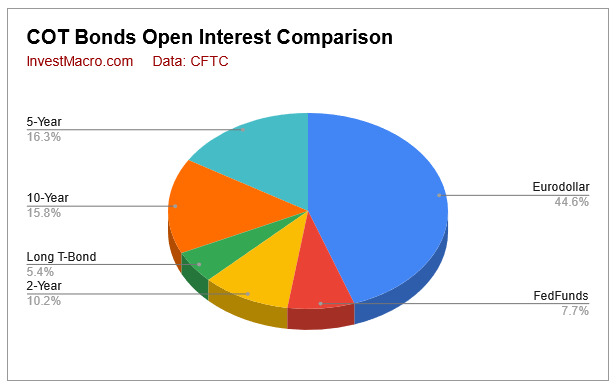
The latest COT data is updated through Tuesday May 17th and shows a quick view of how large traders (for-profit speculators and commercial entities) were positioned in the futures markets.
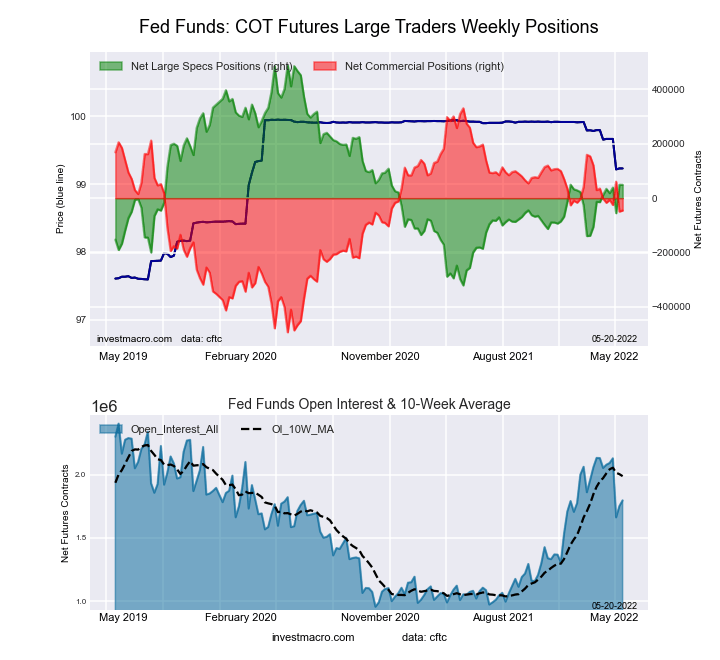
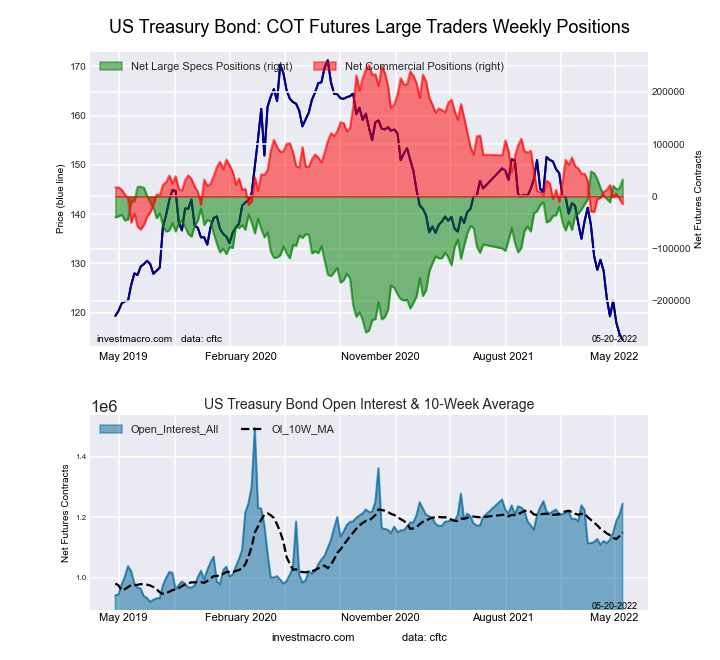
Bonds market speculator bets were mostly lower this week as five out of the eight bond markets we cover had lower positioning this week. Most of these markets remain bearish (speculator levels and price levels) in the higher interest rate environment of 2022. The exceptions in the COT speculator positioning are the Fed Funds positions which recently turned positive in early April and have maintained a small bullish level in six out of the past seven weeks. The US Treasury Bond positions also turned positive in early March and have also had a small bullish position in nine out of the past eleven weeks.
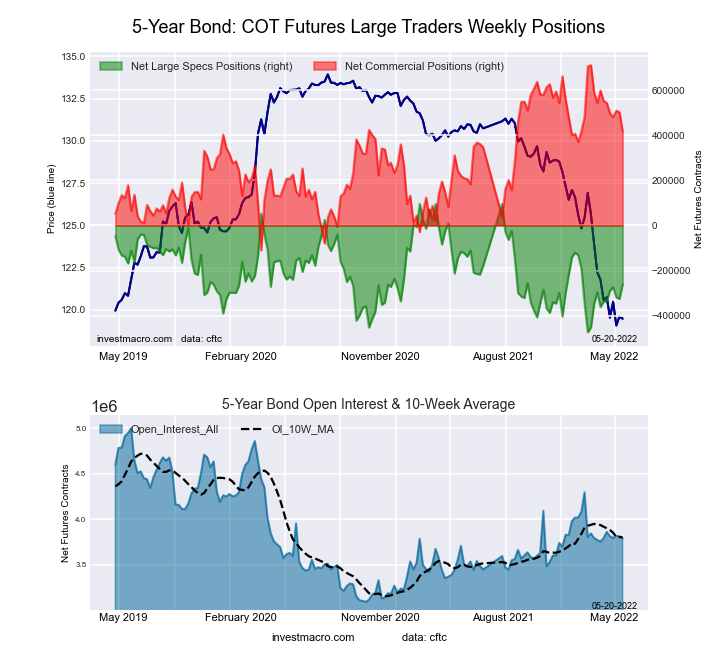
Overall, the bond markets with higher speculator bets for this week were Long US Bond (16,554 contracts), 5-Year Bond (65,450 contracts) and the Ultra US Bond (16,954 contracts).
Free Reports:
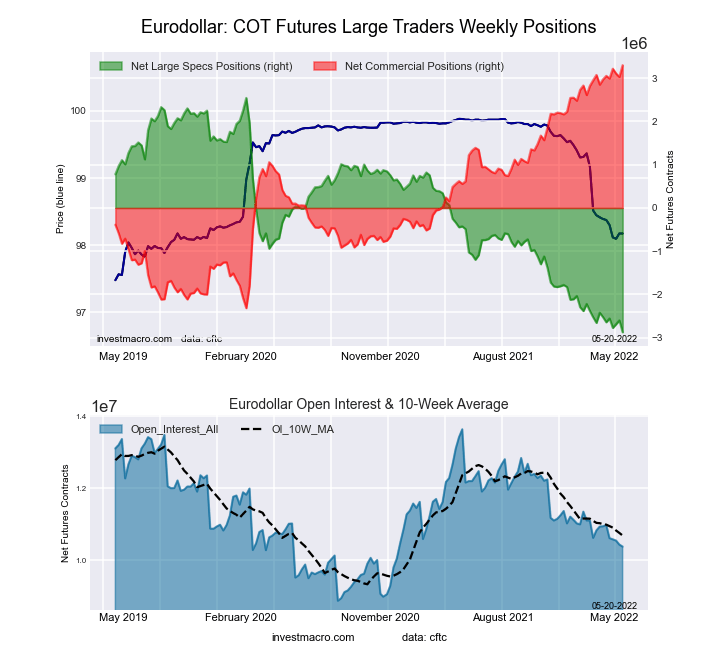
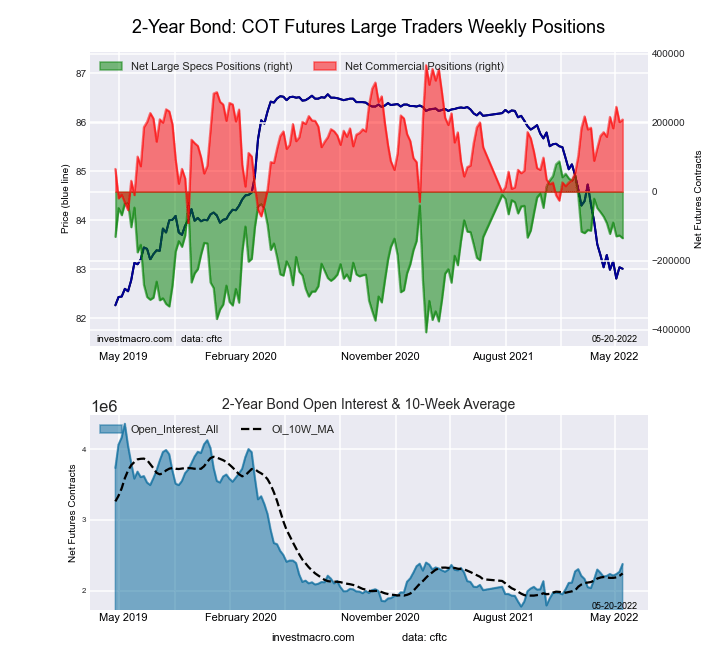
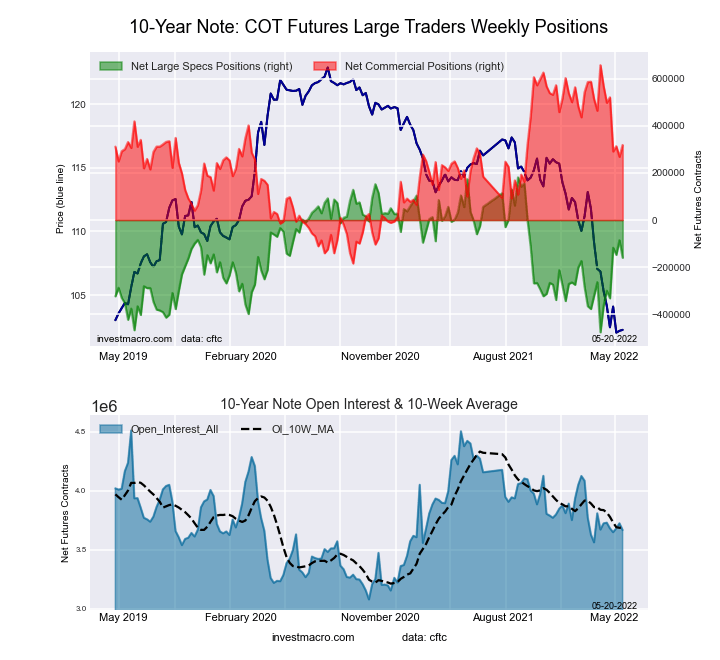
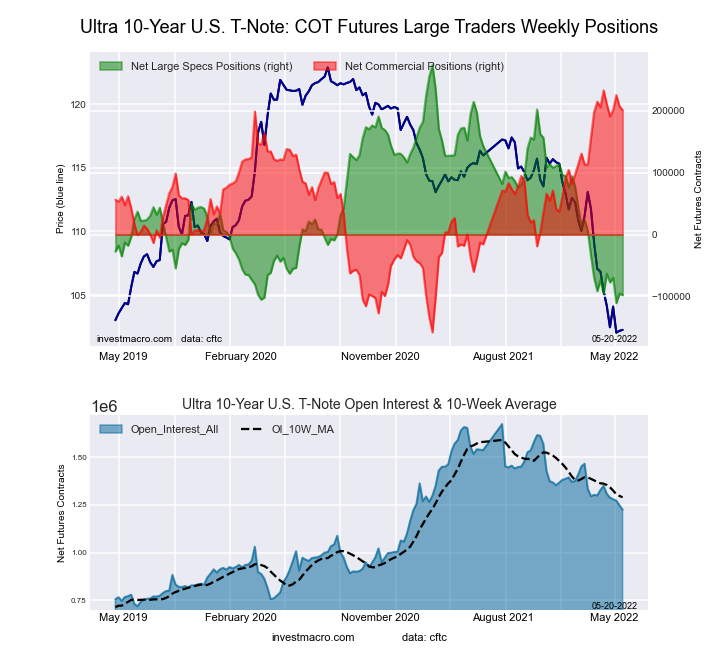
The markets with declining speculator bets this week were the 2-Year Bond (-7,808 contracts), Eurodollar (-273,864 contracts), 10-Year Bond (-74,119 contracts), Ultra 10-Year (-2,421 contracts) and the Fed Funds (-147 contracts).
Speculator strength standings for each Commodity where strength index is current net position compared to past three years, above 80 is bullish extreme, below 20 is bearish extreme OI Strength = Current Open Interest level compared to last 3 years range Spec Strength = Current Net Speculator level compared to last 3 years range Strength Move = Six week change of Spec Strength
| May-17-2022 | OI | OI-Index | Spec-Net | Spec-Index | Com-Net | COM-Index | Smalls-Net | Smalls-Index |
|---|---|---|---|---|---|---|---|---|
| Eurodollar | 10,381,883 | 32 | -2,874,451 | 0 | 3,300,959 | 100 | -426,508 | 11 |
| FedFunds | 1,796,405 | 58 | 49,015 | 46 | -45,484 | 54 | -3,531 | 51 |
| 2-Year | 2,376,024 | 26 | -134,637 | 55 | 209,074 | 66 | -74,437 | 18 |
| Long T-Bond | 1,244,823 | 57 | 32,007 | 95 | -14,575 | 15 | -17,432 | 39 |
| 10-Year | 3,666,416 | 41 | -160,091 | 48 | 318,592 | 60 | -158,501 | 42 |
| 5-Year | 3,791,540 | 37 | -260,224 | 38 | 417,629 | 64 | -157,405 | 38 |
This week’s current strength score (the trader positioning range over the past three years, measured from 0 to 100) shows the speculators are currently Bearish-Extreme with a score of 0.0 percent. The commercials are Bullish-Extreme with a score of 100.0 percent and the small traders (not shown in chart) are Bearish-Extreme with a score of 10.6 percent.
| 3-Month Eurodollars Statistics | SPECULATORS | COMMERCIALS | SMALL TRADERS |
| – Percent of Open Interest Longs: | 3.2 | 76.0 | 3.7 |
| – Percent of Open Interest Shorts: | 30.9 | 44.2 | 7.8 |
| – Net Position: | -2,874,451 | 3,300,959 | -426,508 |
| – Gross Longs: | 336,958 | 7,889,274 | 386,384 |
| – Gross Shorts: | 3,211,409 | 4,588,315 | 812,892 |
| – Long to Short Ratio: | 0.1 to 1 | 1.7 to 1 | 0.5 to 1 |
| NET POSITION TREND: | |||
| – Strength Index Score (3 Year Range Pct): | 0.0 | 100.0 | 10.6 |
| – Strength Index Reading (3 Year Range): | Bearish-Extreme | Bullish-Extreme | Bearish-Extreme |
| NET POSITION MOVEMENT INDEX: | |||
| – 6-Week Change in Strength Index: | -6.5 | 5.9 | 4.6 |
This week’s current strength score (the trader positioning range over the past three years, measured from 0 to 100) shows the speculators are currently Bearish with a score of 45.7 percent. The commercials are Bullish with a score of 54.4 percent and the small traders (not shown in chart) are Bullish with a score of 50.7 percent.
| 30-Day Federal Funds Statistics | SPECULATORS | COMMERCIALS | SMALL TRADERS |
| – Percent of Open Interest Longs: | 5.6 | 75.5 | 2.1 |
| – Percent of Open Interest Shorts: | 2.8 | 78.0 | 2.3 |
| – Net Position: | 49,015 | -45,484 | -3,531 |
| – Gross Longs: | 100,043 | 1,355,889 | 37,674 |
| – Gross Shorts: | 51,028 | 1,401,373 | 41,205 |
| – Long to Short Ratio: | 2.0 to 1 | 1.0 to 1 | 0.9 to 1 |
| NET POSITION TREND: | |||
| – Strength Index Score (3 Year Range Pct): | 45.7 | 54.4 | 50.7 |
| – Strength Index Reading (3 Year Range): | Bearish | Bullish | Bullish |
| NET POSITION MOVEMENT INDEX: | |||
| – 6-Week Change in Strength Index: | 4.6 | -5.3 | 16.5 |
This week’s current strength score (the trader positioning range over the past three years, measured from 0 to 100) shows the speculators are currently Bullish with a score of 55.1 percent. The commercials are Bullish with a score of 65.6 percent and the small traders (not shown in chart) are Bearish-Extreme with a score of 17.6 percent.
| 2-Year Treasury Note Statistics | SPECULATORS | COMMERCIALS | SMALL TRADERS |
| – Percent of Open Interest Longs: | 13.0 | 76.6 | 5.8 |
| – Percent of Open Interest Shorts: | 18.6 | 67.8 | 8.9 |
| – Net Position: | -134,637 | 209,074 | -74,437 |
| – Gross Longs: | 307,951 | 1,818,876 | 137,690 |
| – Gross Shorts: | 442,588 | 1,609,802 | 212,127 |
| – Long to Short Ratio: | 0.7 to 1 | 1.1 to 1 | 0.6 to 1 |
| NET POSITION TREND: | |||
| – Strength Index Score (3 Year Range Pct): | 55.1 | 65.6 | 17.6 |
| – Strength Index Reading (3 Year Range): | Bullish | Bullish | Bearish-Extreme |
| NET POSITION MOVEMENT INDEX: | |||
| – 6-Week Change in Strength Index: | -12.6 | 8.0 | 10.7 |
This week’s current strength score (the trader positioning range over the past three years, measured from 0 to 100) shows the speculators are currently Bearish with a score of 37.5 percent. The commercials are Bullish with a score of 64.2 percent and the small traders (not shown in chart) are Bearish with a score of 37.8 percent.
| 5-Year Treasury Note Statistics | SPECULATORS | COMMERCIALS | SMALL TRADERS |
| – Percent of Open Interest Longs: | 7.9 | 81.1 | 7.5 |
| – Percent of Open Interest Shorts: | 14.7 | 70.1 | 11.7 |
| – Net Position: | -260,224 | 417,629 | -157,405 |
| – Gross Longs: | 298,615 | 3,074,092 | 284,595 |
| – Gross Shorts: | 558,839 | 2,656,463 | 442,000 |
| – Long to Short Ratio: | 0.5 to 1 | 1.2 to 1 | 0.6 to 1 |
| NET POSITION TREND: | |||
| – Strength Index Score (3 Year Range Pct): | 37.5 | 64.2 | 37.8 |
| – Strength Index Reading (3 Year Range): | Bearish | Bullish | Bearish |
| NET POSITION MOVEMENT INDEX: | |||
| – 6-Week Change in Strength Index: | 13.7 | -16.5 | 15.8 |
This week’s current strength score (the trader positioning range over the past three years, measured from 0 to 100) shows the speculators are currently Bearish with a score of 48.1 percent. The commercials are Bullish with a score of 59.7 percent and the small traders (not shown in chart) are Bearish with a score of 42.1 percent.
| 10-Year Treasury Note Statistics | SPECULATORS | COMMERCIALS | SMALL TRADERS |
| – Percent of Open Interest Longs: | 8.6 | 76.9 | 8.9 |
| – Percent of Open Interest Shorts: | 12.9 | 68.2 | 13.2 |
| – Net Position: | -160,091 | 318,592 | -158,501 |
| – Gross Longs: | 314,613 | 2,819,008 | 325,049 |
| – Gross Shorts: | 474,704 | 2,500,416 | 483,550 |
| – Long to Short Ratio: | 0.7 to 1 | 1.1 to 1 | 0.7 to 1 |
| NET POSITION TREND: | |||
| – Strength Index Score (3 Year Range Pct): | 48.1 | 59.7 | 42.1 |
| – Strength Index Reading (3 Year Range): | Bearish | Bullish | Bearish |
| NET POSITION MOVEMENT INDEX: | |||
| – 6-Week Change in Strength Index: | 30.8 | -29.7 | 11.0 |
This week’s current strength score (the trader positioning range over the past three years, measured from 0 to 100) shows the speculators are currently Bearish-Extreme with a score of 3.4 percent. The commercials are Bullish-Extreme with a score of 91.8 percent and the small traders (not shown in chart) are Bullish with a score of 53.8 percent.
| Ultra 10-Year Notes Statistics | SPECULATORS | COMMERCIALS | SMALL TRADERS |
| – Percent of Open Interest Longs: | 4.6 | 81.6 | 12.2 |
| – Percent of Open Interest Shorts: | 12.6 | 65.2 | 20.7 |
| – Net Position: | -97,837 | 200,995 | -103,158 |
| – Gross Longs: | 56,209 | 1,000,137 | 150,063 |
| – Gross Shorts: | 154,046 | 799,142 | 253,221 |
| – Long to Short Ratio: | 0.4 to 1 | 1.3 to 1 | 0.6 to 1 |
| NET POSITION TREND: | |||
| – Strength Index Score (3 Year Range Pct): | 3.4 | 91.8 | 53.8 |
| – Strength Index Reading (3 Year Range): | Bearish-Extreme | Bullish-Extreme | Bullish |
| NET POSITION MOVEMENT INDEX: | |||
| – 6-Week Change in Strength Index: | -0.6 | -8.2 | 20.7 |
This week’s current strength score (the trader positioning range over the past three years, measured from 0 to 100) shows the speculators are currently Bullish-Extreme with a score of 95.0 percent. The commercials are Bearish-Extreme with a score of 15.5 percent and the small traders (not shown in chart) are Bearish with a score of 38.8 percent.
| US Treasury Bonds Statistics | SPECULATORS | COMMERCIALS | SMALL TRADERS |
| – Percent of Open Interest Longs: | 11.7 | 72.5 | 12.3 |
| – Percent of Open Interest Shorts: | 9.2 | 73.6 | 13.7 |
| – Net Position: | 32,007 | -14,575 | -17,432 |
| – Gross Longs: | 146,002 | 902,140 | 152,520 |
| – Gross Shorts: | 113,995 | 916,715 | 169,952 |
| – Long to Short Ratio: | 1.3 to 1 | 1.0 to 1 | 0.9 to 1 |
| NET POSITION TREND: | |||
| – Strength Index Score (3 Year Range Pct): | 95.0 | 15.5 | 38.8 |
| – Strength Index Reading (3 Year Range): | Bullish-Extreme | Bearish-Extreme | Bearish |
| NET POSITION MOVEMENT INDEX: | |||
| – 6-Week Change in Strength Index: | 10.0 | -7.4 | -6.1 |
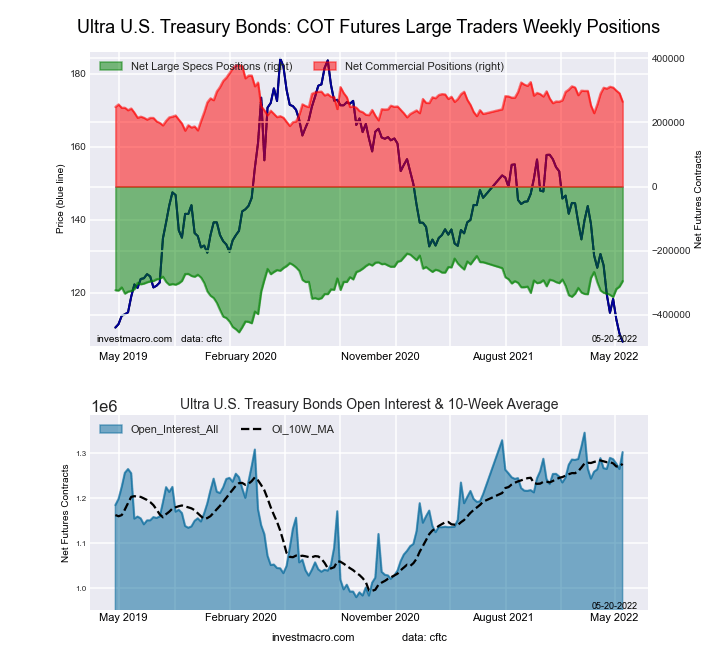
This week’s current strength score (the trader positioning range over the past three years, measured from 0 to 100) shows the speculators are currently Bullish with a score of 65.1 percent. The commercials are Bearish with a score of 44.2 percent and the small traders (not shown in chart) are Bullish with a score of 50.1 percent.
| Ultra US Treasury Bonds Statistics | SPECULATORS | COMMERCIALS | SMALL TRADERS |
| – Percent of Open Interest Longs: | 3.7 | 81.8 | 11.6 |
| – Percent of Open Interest Shorts: | 26.3 | 61.5 | 9.3 |
| – Net Position: | -294,559 | 264,222 | 30,337 |
| – Gross Longs: | 48,033 | 1,065,877 | 151,667 |
| – Gross Shorts: | 342,592 | 801,655 | 121,330 |
| – Long to Short Ratio: | 0.1 to 1 | 1.3 to 1 | 1.3 to 1 |
| NET POSITION TREND: | |||
| – Strength Index Score (3 Year Range Pct): | 65.1 | 44.2 | 50.1 |
| – Strength Index Reading (3 Year Range): | Bullish | Bearish | Bullish |
| NET POSITION MOVEMENT INDEX: | |||
| – 6-Week Change in Strength Index: | 14.8 | -21.4 | 5.2 |
Article By InvestMacro – Receive our weekly COT Reports by Email
*COT Report: The COT data, released weekly to the public each Friday, is updated through the most recent Tuesday (data is 3 days old) and shows a quick view of how large speculators or non-commercials (for-profit traders) were positioned in the futures markets.
The CFTC categorizes trader positions according to commercial hedgers (traders who use futures contracts for hedging as part of the business), non-commercials (large traders who speculate to realize trading profits) and nonreportable traders (usually small traders/speculators) as well as their open interest (contracts open in the market at time of reporting).See CFTC criteria here.
By Jeffrey Young, Georgia Institute of Technology You’ve probably heard artificial intelligence models described as…
Source: Barry Dawes (7/23/26) Barry Dawes of Martin Place Securities shares his analysis of the…
By JustMarkets The US stock indices ended Thursday’s session with a notable decline amid a…
By Analytical Department RoboForex USD/JPY soared to 163.81 on Friday, marking a new 40-year high.…
By JustMarkets The US equities ended Wednesday’s session lower amid investor caution ahead of the…
By Analytical Department RoboForex EUR/USD rose to 1.1429 on Thursday, with the US dollar continuing…
This website uses cookies.