By InvestMacro | COT | Data Tables | COT Leaders | Downloads | COT Newsletter
Here are the latest charts and statistics for the Commitment of Traders (COT) data published by the Commodities Futures Trading Commission (CFTC).
The latest COT data is updated through Tuesday May 10th and shows a quick view of how large traders (for-profit speculators and commercial entities) were positioned in the futures markets.
Bonds market speculator bets mostly rose this week as seven out of the eight bond markets we cover saw higher positioning this week. Most of these markets are deeply bearish (speculator levels and price levels) as bond markets have been declining mightily in this higher interest rate environment this year. This week’s rise in bond speculator bets will likely be short-lived although there have been increasing calls that bond markets may have hit or are approaching a short term bottom.
Overall, the markets with higher speculator bets this week were 2-Year Bond (2,342 contracts), Eurodollar (87,521 contracts), 10-Year Bond (61,565 contracts), Ultra 10-Year (15,302 contracts), Long US Bond (1,942 contracts), Fed Funds (104,415 contracts) and the Ultra US Bond (7,666 contracts).
Free Reports:
The only market with declining speculator bets this week was the 5-Year Bond (-6,738 contracts).
Speculator strength standings for each Commodity where strength index is current net position compared to past three years, above 80 is bullish extreme, below 20 is bearish extreme OI Strength = Current Open Interest level compared to last 3 years range Spec Strength = Current Net Speculator level compared to last 3 years range Strength Move = Six week change of Spec Strength
| May-10-2022 | OI | OI-Index | Spec-Net | Spec-Index | Com-Net | COM-Index | Smalls-Net | Smalls-Index |
|---|---|---|---|---|---|---|---|---|
| Eurodollar | 10,439,124 | 33 | -2,600,587 | 3 | 3,030,504 | 97 | -429,917 | 10 |
| FedFunds | 1,750,404 | 55 | 49,162 | 46 | -49,266 | 54 | 104 | 60 |
| 2-Year | 2,264,774 | 21 | -126,829 | 57 | 201,609 | 64 | -74,780 | 17 |
| Long T-Bond | 1,207,560 | 50 | 15,453 | 90 | -4,991 | 19 | -10,462 | 44 |
| 10-Year | 3,722,697 | 45 | -85,972 | 59 | 268,376 | 54 | -182,404 | 36 |
| 5-Year | 3,813,677 | 38 | -325,674 | 26 | 502,383 | 75 | -176,709 | 32 |
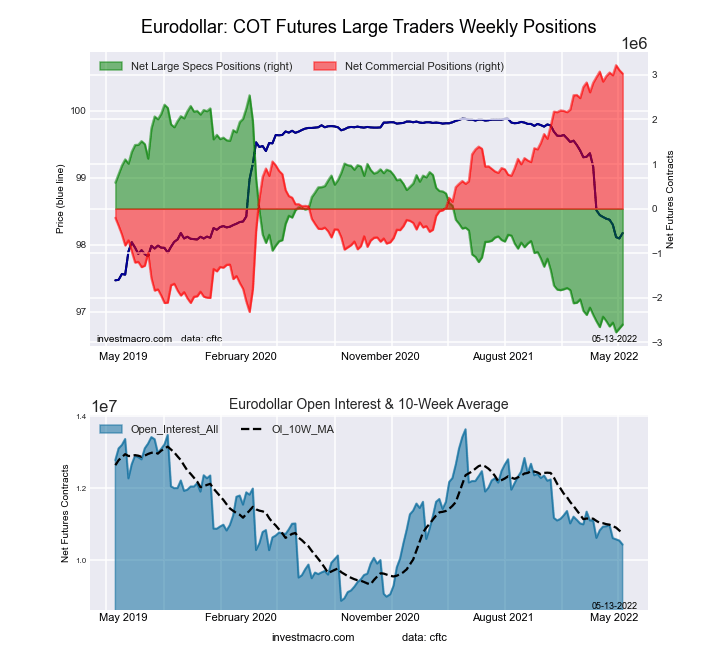
This week’s current strength score (the trader positioning range over the past three years, measured from 0 to 100) shows the speculators are currently Bearish-Extreme with a score of 3.3 percent. The commercials are Bullish-Extreme with a score of 96.6 percent and the small traders (not shown in chart) are Bearish-Extreme with a score of 9.8 percent.
| 3-Month Eurodollars Statistics | SPECULATORS | COMMERCIALS | SMALL TRADERS |
| – Percent of Open Interest Longs: | 3.4 | 75.3 | 4.1 |
| – Percent of Open Interest Shorts: | 28.3 | 46.3 | 8.2 |
| – Net Position: | -2,600,587 | 3,030,504 | -429,917 |
| – Gross Longs: | 356,101 | 7,861,403 | 422,820 |
| – Gross Shorts: | 2,956,688 | 4,830,899 | 852,737 |
| – Long to Short Ratio: | 0.1 to 1 | 1.6 to 1 | 0.5 to 1 |
| NET POSITION TREND: | |||
| – Strength Index Score (3 Year Range Pct): | 3.3 | 96.6 | 9.8 |
| – Strength Index Reading (3 Year Range): | Bearish-Extreme | Bullish-Extreme | Bearish-Extreme |
| NET POSITION MOVEMENT INDEX: | |||
| – 6-Week Change in Strength Index: | -3.3 | 3.2 | -0.4 |
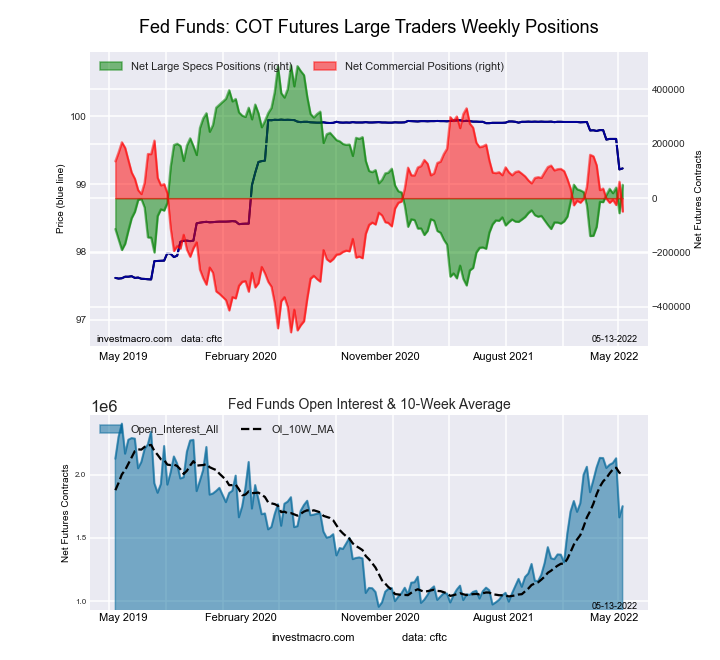
This week’s current strength score (the trader positioning range over the past three years, measured from 0 to 100) shows the speculators are currently Bearish with a score of 45.7 percent. The commercials are Bullish with a score of 53.9 percent and the small traders (not shown in chart) are Bullish with a score of 60.0 percent.
| 30-Day Federal Funds Statistics | SPECULATORS | COMMERCIALS | SMALL TRADERS |
| – Percent of Open Interest Longs: | 5.9 | 75.2 | 2.3 |
| – Percent of Open Interest Shorts: | 3.1 | 78.0 | 2.3 |
| – Net Position: | 49,162 | -49,266 | 104 |
| – Gross Longs: | 103,238 | 1,316,147 | 39,627 |
| – Gross Shorts: | 54,076 | 1,365,413 | 39,523 |
| – Long to Short Ratio: | 1.9 to 1 | 1.0 to 1 | 1.0 to 1 |
| NET POSITION TREND: | |||
| – Strength Index Score (3 Year Range Pct): | 45.7 | 53.9 | 60.0 |
| – Strength Index Reading (3 Year Range): | Bearish | Bullish | Bullish |
| NET POSITION MOVEMENT INDEX: | |||
| – 6-Week Change in Strength Index: | 7.8 | -10.3 | 53.3 |
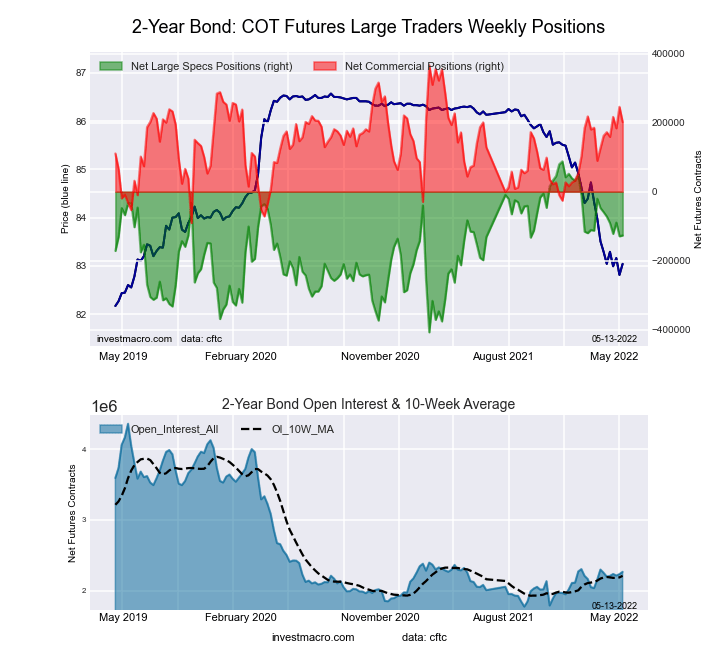
This week’s current strength score (the trader positioning range over the past three years, measured from 0 to 100) shows the speculators are currently Bullish with a score of 56.7 percent. The commercials are Bullish with a score of 63.9 percent and the small traders (not shown in chart) are Bearish-Extreme with a score of 17.4 percent.
| 2-Year Treasury Note Statistics | SPECULATORS | COMMERCIALS | SMALL TRADERS |
| – Percent of Open Interest Longs: | 12.1 | 77.3 | 6.2 |
| – Percent of Open Interest Shorts: | 17.7 | 68.4 | 9.5 |
| – Net Position: | -126,829 | 201,609 | -74,780 |
| – Gross Longs: | 275,153 | 1,751,572 | 140,782 |
| – Gross Shorts: | 401,982 | 1,549,963 | 215,562 |
| – Long to Short Ratio: | 0.7 to 1 | 1.1 to 1 | 0.7 to 1 |
| NET POSITION TREND: | |||
| – Strength Index Score (3 Year Range Pct): | 56.7 | 63.9 | 17.4 |
| – Strength Index Reading (3 Year Range): | Bullish | Bullish | Bearish-Extreme |
| NET POSITION MOVEMENT INDEX: | |||
| – 6-Week Change in Strength Index: | -13.7 | 8.7 | 11.6 |
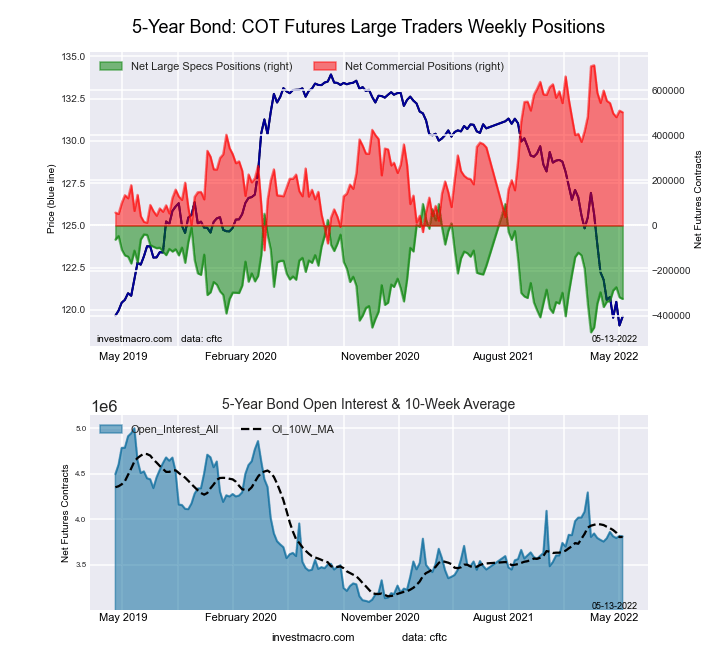
This week’s current strength score (the trader positioning range over the past three years, measured from 0 to 100) shows the speculators are currently Bearish with a score of 26.1 percent. The commercials are Bullish with a score of 74.5 percent and the small traders (not shown in chart) are Bearish with a score of 32.5 percent.
| 5-Year Treasury Note Statistics | SPECULATORS | COMMERCIALS | SMALL TRADERS |
| – Percent of Open Interest Longs: | 7.6 | 83.0 | 7.1 |
| – Percent of Open Interest Shorts: | 16.2 | 69.9 | 11.8 |
| – Net Position: | -325,674 | 502,383 | -176,709 |
| – Gross Longs: | 291,527 | 3,167,247 | 271,640 |
| – Gross Shorts: | 617,201 | 2,664,864 | 448,349 |
| – Long to Short Ratio: | 0.5 to 1 | 1.2 to 1 | 0.6 to 1 |
| NET POSITION TREND: | |||
| – Strength Index Score (3 Year Range Pct): | 26.1 | 74.5 | 32.5 |
| – Strength Index Reading (3 Year Range): | Bearish | Bullish | Bearish |
| NET POSITION MOVEMENT INDEX: | |||
| – 6-Week Change in Strength Index: | 6.3 | -11.7 | 16.6 |
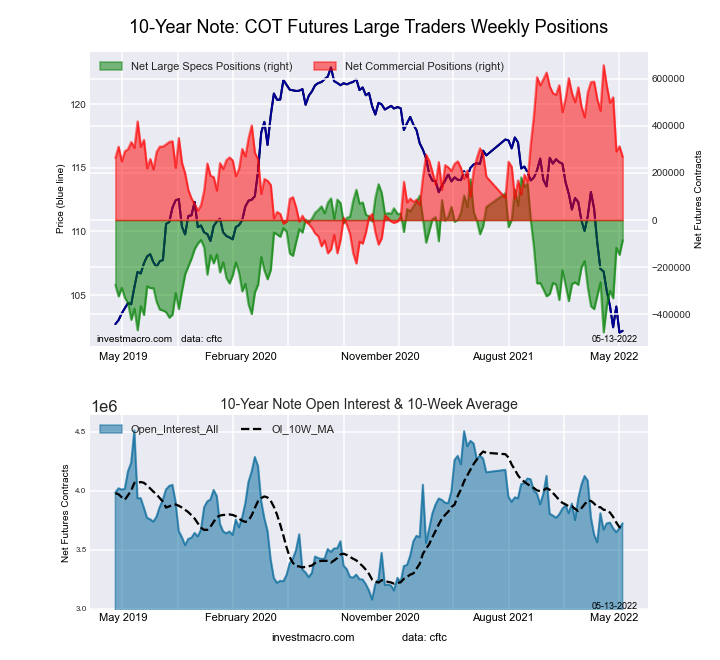
This week’s current strength score (the trader positioning range over the past three years, measured from 0 to 100) shows the speculators are currently Bullish with a score of 59.4 percent. The commercials are Bullish with a score of 53.8 percent and the small traders (not shown in chart) are Bearish with a score of 36.2 percent.
| 10-Year Treasury Note Statistics | SPECULATORS | COMMERCIALS | SMALL TRADERS |
| – Percent of Open Interest Longs: | 10.9 | 76.5 | 8.4 |
| – Percent of Open Interest Shorts: | 13.2 | 69.2 | 13.3 |
| – Net Position: | -85,972 | 268,376 | -182,404 |
| – Gross Longs: | 406,123 | 2,846,309 | 313,590 |
| – Gross Shorts: | 492,095 | 2,577,933 | 495,994 |
| – Long to Short Ratio: | 0.8 to 1 | 1.1 to 1 | 0.6 to 1 |
| NET POSITION TREND: | |||
| – Strength Index Score (3 Year Range Pct): | 59.4 | 53.8 | 36.2 |
| – Strength Index Reading (3 Year Range): | Bullish | Bullish | Bearish |
| NET POSITION MOVEMENT INDEX: | |||
| – 6-Week Change in Strength Index: | 59.4 | -46.2 | -0.3 |
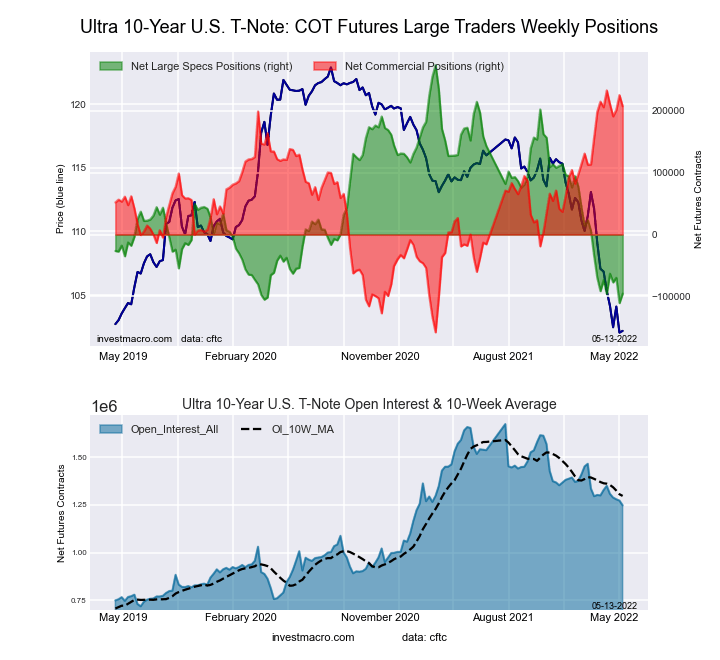
This week’s current strength score (the trader positioning range over the past three years, measured from 0 to 100) shows the speculators are currently Bearish-Extreme with a score of 4.0 percent. The commercials are Bullish-Extreme with a score of 93.4 percent and the small traders (not shown in chart) are Bearish with a score of 48.6 percent.
| Ultra 10-Year Notes Statistics | SPECULATORS | COMMERCIALS | SMALL TRADERS |
| – Percent of Open Interest Longs: | 4.5 | 82.9 | 11.3 |
| – Percent of Open Interest Shorts: | 12.2 | 66.3 | 20.3 |
| – Net Position: | -95,416 | 207,218 | -111,802 |
| – Gross Longs: | 56,783 | 1,034,536 | 141,487 |
| – Gross Shorts: | 152,199 | 827,318 | 253,289 |
| – Long to Short Ratio: | 0.4 to 1 | 1.3 to 1 | 0.6 to 1 |
| NET POSITION TREND: | |||
| – Strength Index Score (3 Year Range Pct): | 4.0 | 93.4 | 48.6 |
| – Strength Index Reading (3 Year Range): | Bearish-Extreme | Bullish-Extreme | Bearish |
| NET POSITION MOVEMENT INDEX: | |||
| – 6-Week Change in Strength Index: | -5.7 | 0.4 | 12.4 |
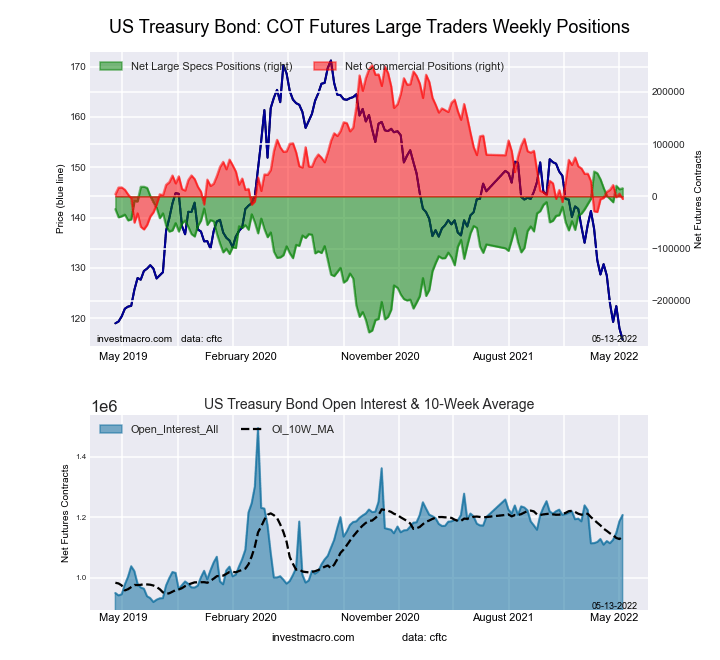
This week’s current strength score (the trader positioning range over the past three years, measured from 0 to 100) shows the speculators are currently Bullish-Extreme with a score of 89.6 percent. The commercials are Bearish-Extreme with a score of 18.5 percent and the small traders (not shown in chart) are Bearish with a score of 44.3 percent.
| US Treasury Bonds Statistics | SPECULATORS | COMMERCIALS | SMALL TRADERS |
| – Percent of Open Interest Longs: | 10.9 | 72.1 | 13.0 |
| – Percent of Open Interest Shorts: | 9.6 | 72.5 | 13.8 |
| – Net Position: | 15,453 | -4,991 | -10,462 |
| – Gross Longs: | 131,916 | 870,932 | 156,698 |
| – Gross Shorts: | 116,463 | 875,923 | 167,160 |
| – Long to Short Ratio: | 1.1 to 1 | 1.0 to 1 | 0.9 to 1 |
| NET POSITION TREND: | |||
| – Strength Index Score (3 Year Range Pct): | 89.6 | 18.5 | 44.3 |
| – Strength Index Reading (3 Year Range): | Bullish-Extreme | Bearish-Extreme | Bearish |
| NET POSITION MOVEMENT INDEX: | |||
| – 6-Week Change in Strength Index: | -0.2 | -0.6 | 1.9 |
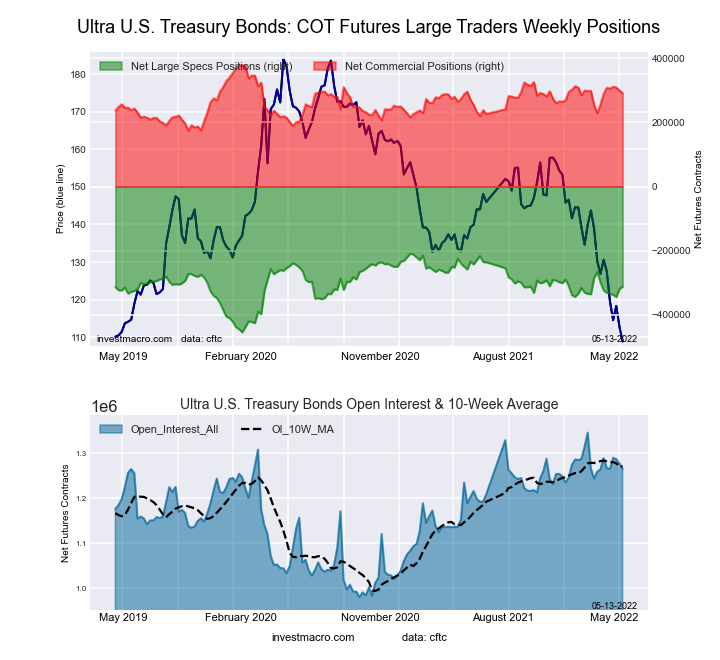
This week’s current strength score (the trader positioning range over the past three years, measured from 0 to 100) shows the speculators are currently Bullish with a score of 58.1 percent. The commercials are Bullish with a score of 57.2 percent and the small traders (not shown in chart) are Bearish with a score of 43.2 percent.
| Ultra US Treasury Bonds Statistics | SPECULATORS | COMMERCIALS | SMALL TRADERS |
| – Percent of Open Interest Longs: | 3.6 | 84.6 | 11.4 |
| – Percent of Open Interest Shorts: | 28.2 | 61.6 | 9.8 |
| – Net Position: | -311,513 | 290,655 | 20,858 |
| – Gross Longs: | 45,084 | 1,069,894 | 144,208 |
| – Gross Shorts: | 356,597 | 779,239 | 123,350 |
| – Long to Short Ratio: | 0.1 to 1 | 1.4 to 1 | 1.2 to 1 |
| NET POSITION TREND: | |||
| – Strength Index Score (3 Year Range Pct): | 58.1 | 57.2 | 43.2 |
| – Strength Index Reading (3 Year Range): | Bullish | Bullish | Bearish |
| NET POSITION MOVEMENT INDEX: | |||
| – 6-Week Change in Strength Index: | 4.9 | 0.8 | -9.9 |
Article By InvestMacro – Receive our weekly COT Reports by Email
*COT Report: The COT data, released weekly to the public each Friday, is updated through the most recent Tuesday (data is 3 days old) and shows a quick view of how large speculators or non-commercials (for-profit traders) were positioned in the futures markets.
The CFTC categorizes trader positions according to commercial hedgers (traders who use futures contracts for hedging as part of the business), non-commercials (large traders who speculate to realize trading profits) and nonreportable traders (usually small traders/speculators) as well as their open interest (contracts open in the market at time of reporting).See CFTC criteria here.
By JustMarkets The US stock indices ended Friday’s session in the red. By the end…
By Analytical Department RoboForex USD/JPY opens the week at 162.36 on Monday. The Japanese yen…
By InvestMacro Here are the latest charts and statistics for the Commitment of Traders (COT)…
By InvestMacro The latest update for the weekly Commitment of Traders (COT) report was released…
By InvestMacro Here are the latest charts and statistics for the Commitment of Traders (COT)…
By InvestMacro Here are the latest charts and statistics for the Commitment of Traders (COT)…
This website uses cookies.