By InvestMacro | COT | Data Tables | COT Leaders | Downloads | COT Newsletter
Here are the latest charts and statistics for the Commitment of Traders (COT) data published by the Commodities Futures Trading Commission (CFTC).
The latest COT data is updated through Tuesday February 8th and shows a quick view of how large traders (for-profit speculators and commercial entities) were positioned in the futures markets.
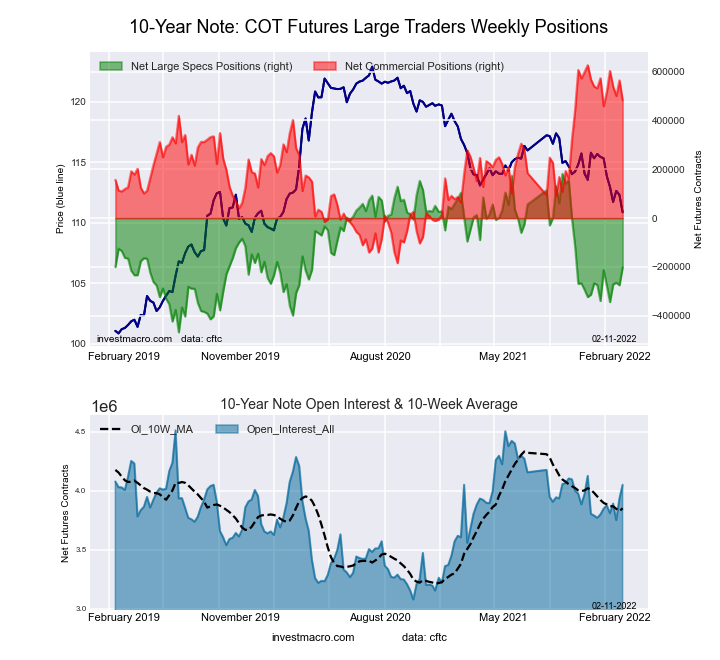
Highlighting the COT bonds data is the decrease in the 10-Year Bond futures bearish positions. The bearish speculative position in the 10-Year has declined for three out of the past four weeks and by a total of 141,929 contracts over that four-week period. The 10-Year has been on a strong bearish trend and the large speculators position fell over into bearish territory on October 19th with bets hitting a 100-week bearish high on January 11th at -343,839 contracts. Since then, bearish bets have been on the decline and this week the speculator standing reached it’s least bearish level of the past fifteen weeks at a total of -201,910 contracts.
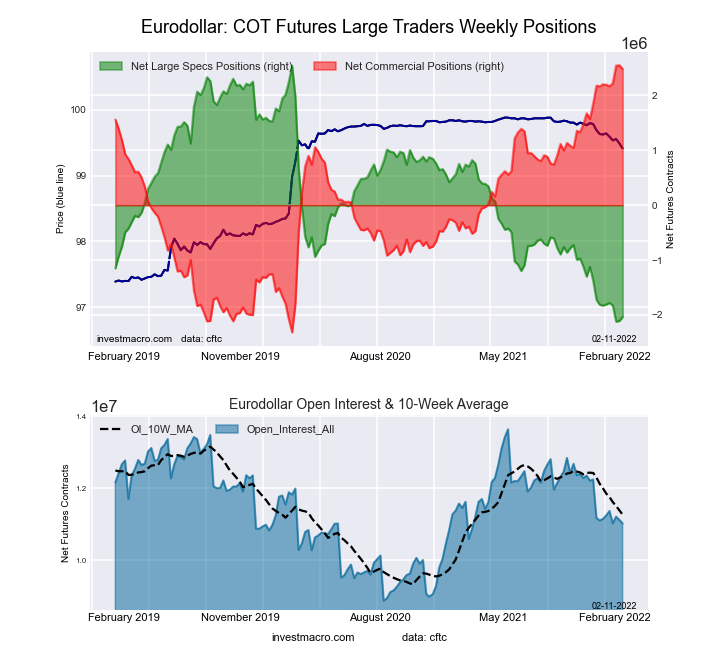
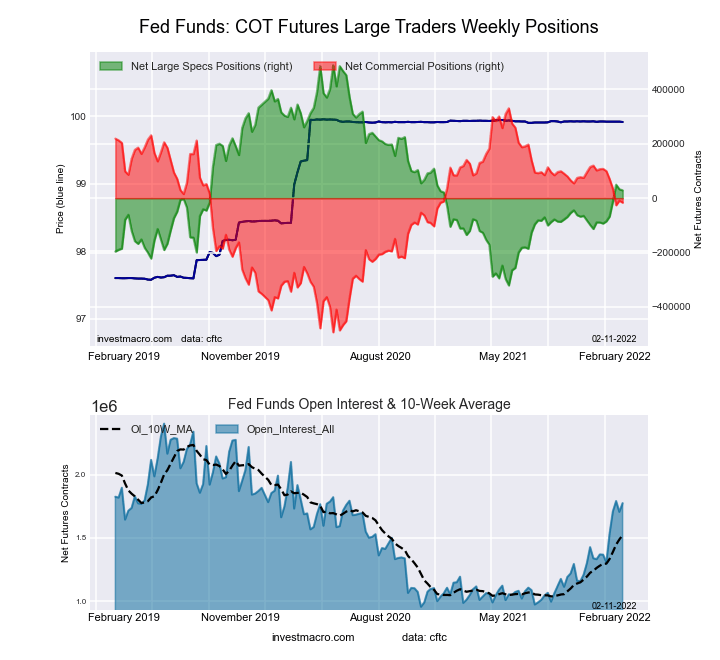
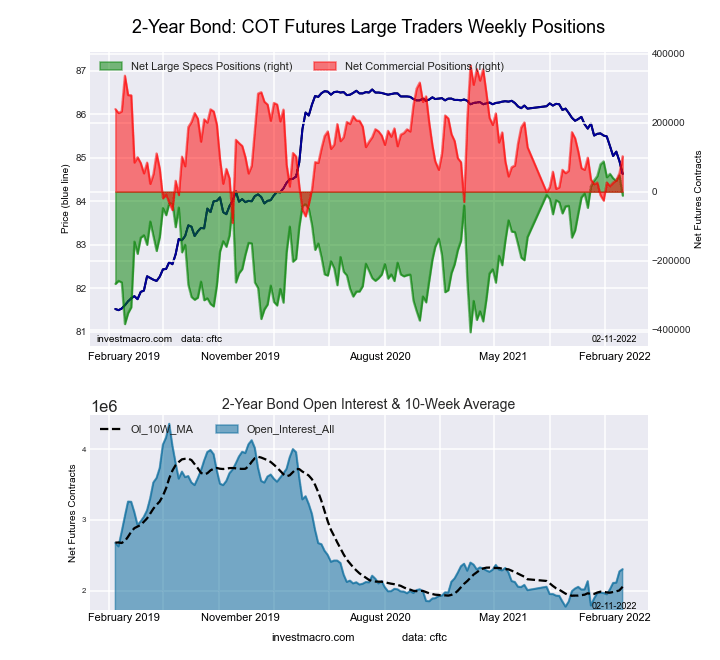
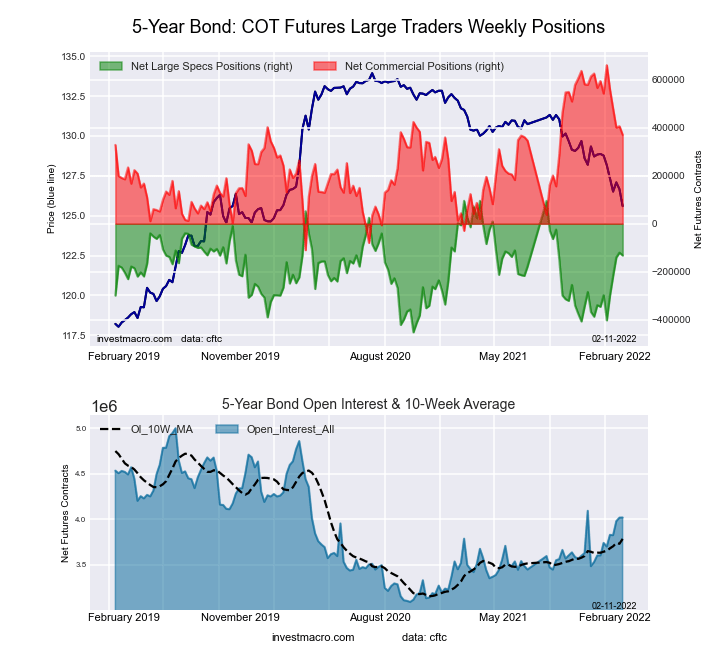
Joining the 10-Year (72,965 contracts) in gaining this week were the Eurodollar (73,184 contracts), Long US Bond (3,523 contracts) and the Ultra US Bond (17,741 contracts) while decreasing bets for the week were seen in 2-Year Bond (-58,904 contracts), Fed Funds (-3,950 contracts), Ultra 10-Year (-33,495 contracts) and the 5-Year (-11,855 contracts).
| Feb-08-2022 | OI | OI-Index | Spec-Net | Spec-Index | Com-Net | COM-Index | Smalls-Net | Smalls-Index |
|---|---|---|---|---|---|---|---|---|
| Eurodollar | 11,025,435 | 45 | -2,036,292 | 2 | 2,480,245 | 99 | -443,953 | 7 |
| FedFunds | 1,774,290 | 57 | 28,650 | 43 | -16,498 | 58 | -12,152 | 31 |
| 2-Year | 2,302,597 | 20 | -11,430 | 80 | 102,779 | 42 | -91,349 | 4 |
| Long T-Bond | 1,186,568 | 46 | -33,025 | 82 | 53,361 | 37 | -20,336 | 36 |
| 10-Year | 4,048,525 | 68 | -201,910 | 41 | 482,585 | 82 | -280,675 | 13 |
| 5-Year | 4,020,579 | 49 | -132,379 | 58 | 371,113 | 62 | -238,734 | 15 |
Free Reports:
This week’s current strength score (the trader positioning range over the past three years, measured from 0 to 100) shows the speculators are currently Bearish-Extreme with a score of 1.8 percent. The commercials are Bullish-Extreme with a score of 98.6 percent and the small traders (not shown in chart) are Bearish-Extreme with a score of 6.7 percent.
| 3-Month Eurodollars Statistics | SPECULATORS | COMMERCIALS | SMALL TRADERS |
| – Percent of Open Interest Longs: | 4.8 | 75.6 | 4.2 |
| – Percent of Open Interest Shorts: | 23.3 | 53.1 | 8.2 |
| – Net Position: | -2,036,292 | 2,480,245 | -443,953 |
| – Gross Longs: | 528,925 | 8,331,007 | 459,484 |
| – Gross Shorts: | 2,565,217 | 5,850,762 | 903,437 |
| – Long to Short Ratio: | 0.2 to 1 | 1.4 to 1 | 0.5 to 1 |
| NET POSITION TREND: | |||
| – Strength Index Score (3 Year Range Pct): | 1.8 | 98.6 | 6.7 |
| – Strength Index Reading (3 Year Range): | Bearish-Extreme | Bullish-Extreme | Bearish-Extreme |
| NET POSITION MOVEMENT INDEX: | |||
| – 6-Week Change in Strength Index: | -4.5 | 5.7 | -15.1 |
This week’s current strength score (the trader positioning range over the past three years, measured from 0 to 100) shows the speculators are currently Bearish with a score of 43.2 percent. The commercials are Bullish with a score of 57.9 percent and the small traders (not shown in chart) are Bearish with a score of 31.5 percent.
| 30-Day Federal Funds Statistics | SPECULATORS | COMMERCIALS | SMALL TRADERS |
| – Percent of Open Interest Longs: | 8.7 | 74.7 | 1.4 |
| – Percent of Open Interest Shorts: | 7.1 | 75.6 | 2.1 |
| – Net Position: | 28,650 | -16,498 | -12,152 |
| – Gross Longs: | 154,974 | 1,324,844 | 24,339 |
| – Gross Shorts: | 126,324 | 1,341,342 | 36,491 |
| – Long to Short Ratio: | 1.2 to 1 | 1.0 to 1 | 0.7 to 1 |
| NET POSITION TREND: | |||
| – Strength Index Score (3 Year Range Pct): | 43.2 | 57.9 | 31.5 |
| – Strength Index Reading (3 Year Range): | Bearish | Bullish | Bearish |
| NET POSITION MOVEMENT INDEX: | |||
| – 6-Week Change in Strength Index: | 15.1 | -15.0 | 4.9 |
This week’s current strength score (the trader positioning range over the past three years, measured from 0 to 100) shows the speculators are currently Bullish with a score of 80.0 percent. The commercials are Bearish with a score of 42.3 percent and the small traders (not shown in chart) are Bearish-Extreme with a score of 4.5 percent.
| 2-Year Treasury Note Statistics | SPECULATORS | COMMERCIALS | SMALL TRADERS |
| – Percent of Open Interest Longs: | 19.1 | 71.0 | 5.4 |
| – Percent of Open Interest Shorts: | 19.6 | 66.5 | 9.4 |
| – Net Position: | -11,430 | 102,779 | -91,349 |
| – Gross Longs: | 439,999 | 1,634,283 | 124,882 |
| – Gross Shorts: | 451,429 | 1,531,504 | 216,231 |
| – Long to Short Ratio: | 1.0 to 1 | 1.1 to 1 | 0.6 to 1 |
| NET POSITION TREND: | |||
| – Strength Index Score (3 Year Range Pct): | 80.0 | 42.3 | 4.5 |
| – Strength Index Reading (3 Year Range): | Bullish | Bearish | Bearish-Extreme |
| NET POSITION MOVEMENT INDEX: | |||
| – 6-Week Change in Strength Index: | -20.0 | 28.1 | -13.0 |
This week’s current strength score (the trader positioning range over the past three years, measured from 0 to 100) shows the speculators are currently Bullish with a score of 58.5 percent. The commercials are Bullish with a score of 62.4 percent and the small traders (not shown in chart) are Bearish-Extreme with a score of 15.5 percent.
| 5-Year Treasury Note Statistics | SPECULATORS | COMMERCIALS | SMALL TRADERS |
| – Percent of Open Interest Longs: | 11.3 | 78.7 | 6.8 |
| – Percent of Open Interest Shorts: | 14.6 | 69.5 | 12.8 |
| – Net Position: | -132,379 | 371,113 | -238,734 |
| – Gross Longs: | 454,870 | 3,164,451 | 275,377 |
| – Gross Shorts: | 587,249 | 2,793,338 | 514,111 |
| – Long to Short Ratio: | 0.8 to 1 | 1.1 to 1 | 0.5 to 1 |
| NET POSITION TREND: | |||
| – Strength Index Score (3 Year Range Pct): | 58.5 | 62.4 | 15.5 |
| – Strength Index Reading (3 Year Range): | Bullish | Bullish | Bearish-Extreme |
| NET POSITION MOVEMENT INDEX: | |||
| – 6-Week Change in Strength Index: | 30.3 | -22.3 | 1.7 |
This week’s current strength score (the trader positioning range over the past three years, measured from 0 to 100) shows the speculators are currently Bearish with a score of 41.0 percent. The commercials are Bullish-Extreme with a score of 82.3 percent and the small traders (not shown in chart) are Bearish-Extreme with a score of 13.3 percent.
| 10-Year Treasury Note Statistics | SPECULATORS | COMMERCIALS | SMALL TRADERS |
| – Percent of Open Interest Longs: | 13.0 | 75.5 | 7.6 |
| – Percent of Open Interest Shorts: | 18.0 | 63.5 | 14.5 |
| – Net Position: | -201,910 | 482,585 | -280,675 |
| – Gross Longs: | 526,749 | 3,055,005 | 306,662 |
| – Gross Shorts: | 728,659 | 2,572,420 | 587,337 |
| – Long to Short Ratio: | 0.7 to 1 | 1.2 to 1 | 0.5 to 1 |
| NET POSITION TREND: | |||
| – Strength Index Score (3 Year Range Pct): | 41.0 | 82.3 | 13.3 |
| – Strength Index Reading (3 Year Range): | Bearish | Bullish-Extreme | Bearish-Extreme |
| NET POSITION MOVEMENT INDEX: | |||
| – 6-Week Change in Strength Index: | 1.8 | 3.0 | -8.3 |
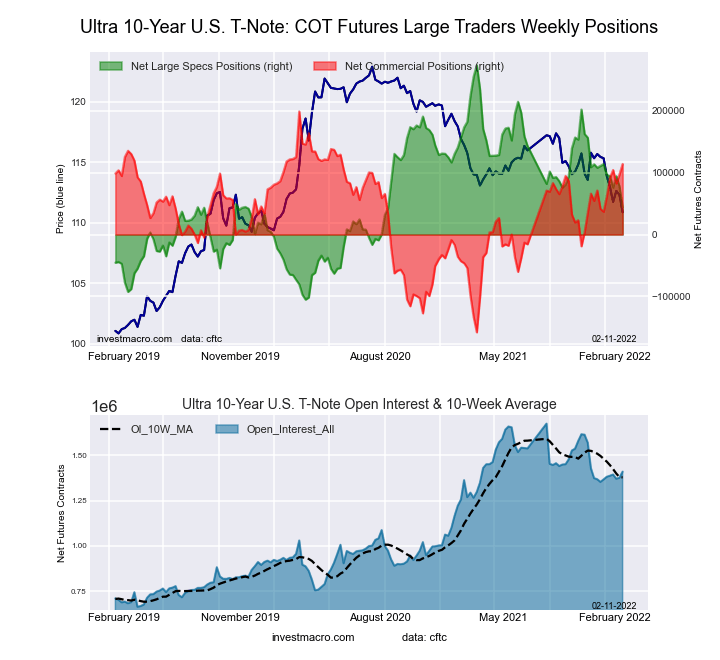
This week’s current strength score (the trader positioning range over the past three years, measured from 0 to 100) shows the speculators are currently Bearish with a score of 39.4 percent. The commercials are Bullish with a score of 76.2 percent and the small traders (not shown in chart) are Bearish with a score of 20.4 percent.
| Ultra 10-Year Notes Statistics | SPECULATORS | COMMERCIALS | SMALL TRADERS |
| – Percent of Open Interest Longs: | 17.6 | 72.5 | 8.6 |
| – Percent of Open Interest Shorts: | 14.5 | 64.4 | 19.8 |
| – Net Position: | 44,011 | 114,010 | -158,021 |
| – Gross Longs: | 248,068 | 1,022,226 | 120,720 |
| – Gross Shorts: | 204,057 | 908,216 | 278,741 |
| – Long to Short Ratio: | 1.2 to 1 | 1.1 to 1 | 0.4 to 1 |
| NET POSITION TREND: | |||
| – Strength Index Score (3 Year Range Pct): | 39.4 | 76.2 | 20.4 |
| – Strength Index Reading (3 Year Range): | Bearish | Bullish | Bearish |
| NET POSITION MOVEMENT INDEX: | |||
| – 6-Week Change in Strength Index: | -18.4 | 21.6 | -4.4 |
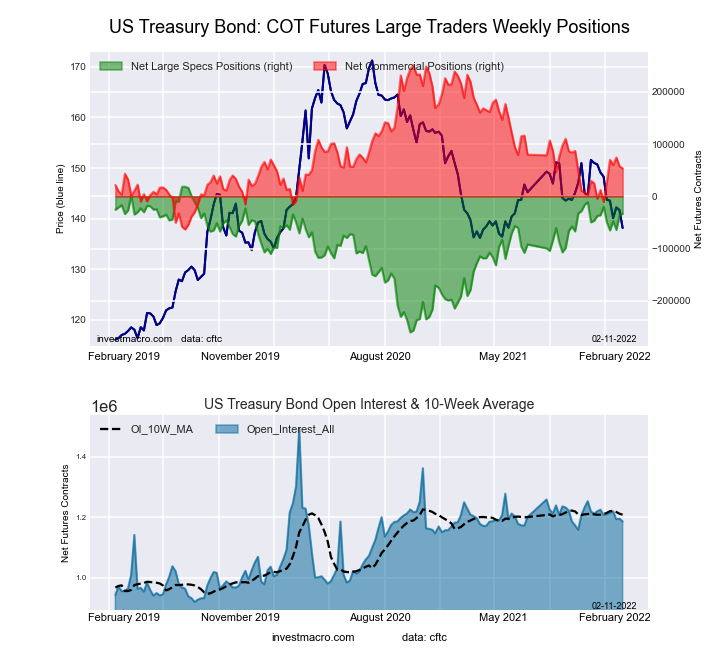
This week’s current strength score (the trader positioning range over the past three years, measured from 0 to 100) shows the speculators are currently Bullish-Extreme with a score of 81.6 percent. The commercials are Bearish with a score of 37.1 percent and the small traders (not shown in chart) are Bearish with a score of 36.4 percent.
| US Treasury Bonds Statistics | SPECULATORS | COMMERCIALS | SMALL TRADERS |
| – Percent of Open Interest Longs: | 9.4 | 75.1 | 13.5 |
| – Percent of Open Interest Shorts: | 12.2 | 70.6 | 15.2 |
| – Net Position: | -33,025 | 53,361 | -20,336 |
| – Gross Longs: | 111,888 | 891,085 | 160,408 |
| – Gross Shorts: | 144,913 | 837,724 | 180,744 |
| – Long to Short Ratio: | 0.8 to 1 | 1.1 to 1 | 0.9 to 1 |
| NET POSITION TREND: | |||
| – Strength Index Score (3 Year Range Pct): | 81.6 | 37.1 | 36.4 |
| – Strength Index Reading (3 Year Range): | Bullish-Extreme | Bearish | Bearish |
| NET POSITION MOVEMENT INDEX: | |||
| – 6-Week Change in Strength Index: | -4.7 | 20.4 | -40.4 |
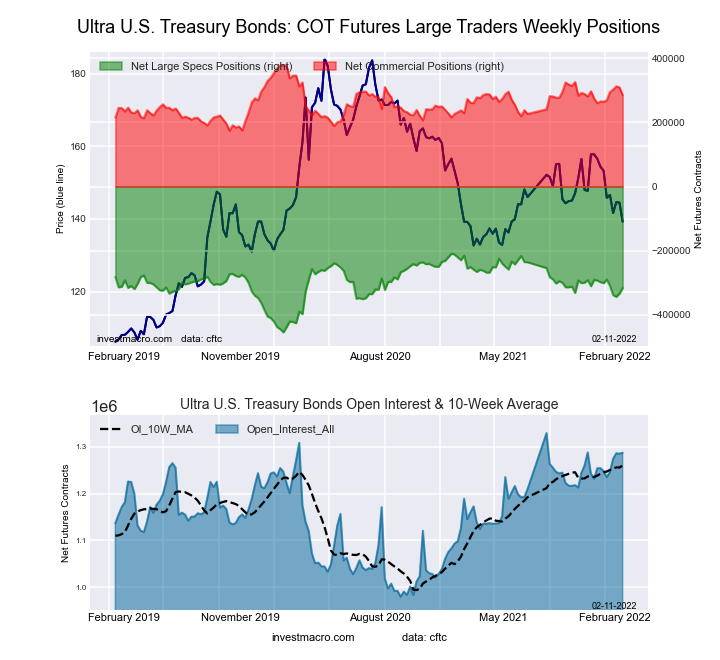
This week’s current strength score (the trader positioning range over the past three years, measured from 0 to 100) shows the speculators are currently Bullish with a score of 56.4 percent. The commercials are Bullish with a score of 54.2 percent and the small traders (not shown in chart) are Bullish with a score of 50.8 percent.
| Ultra US Treasury Bonds Statistics | SPECULATORS | COMMERCIALS | SMALL TRADERS |
| – Percent of Open Interest Longs: | 5.6 | 81.1 | 12.3 |
| – Percent of Open Interest Shorts: | 30.1 | 59.0 | 9.9 |
| – Net Position: | -315,852 | 284,470 | 31,382 |
| – Gross Longs: | 71,447 | 1,043,619 | 158,198 |
| – Gross Shorts: | 387,299 | 759,149 | 126,816 |
| – Long to Short Ratio: | 0.2 to 1 | 1.4 to 1 | 1.2 to 1 |
| NET POSITION TREND: | |||
| – Strength Index Score (3 Year Range Pct): | 56.4 | 54.2 | 50.8 |
| – Strength Index Reading (3 Year Range): | Bullish | Bullish | Bullish |
| NET POSITION MOVEMENT INDEX: | |||
| – 6-Week Change in Strength Index: | -6.2 | 9.8 | -3.5 |
Article By InvestMacro – Receive our weekly COT Reports by Email
*COT Report: The COT data, released weekly to the public each Friday, is updated through the most recent Tuesday (data is 3 days old) and shows a quick view of how large speculators or non-commercials (for-profit traders) were positioned in the futures markets.
The CFTC categorizes trader positions according to commercial hedgers (traders who use futures contracts for hedging as part of the business), non-commercials (large traders who speculate to realize trading profits) and nonreportable traders (usually small traders/speculators) as well as their open interest (contracts open in the market at time of reporting).See CFTC criteria here.
By JustMarkets On Tuesday, the US stock indices finished the session in the green, supported…
By Analytical Department RoboForex GBP/USD rose to 1.3403 on Wednesday, with British politics taking centre…
By Analytical Department RoboForex USD/JPY ended Tuesday at 162.27, with the Japanese yen remaining near…
By JustMarkets On Friday, the Dow Jones Index (US30) rose by 0.29% (weekly: -0.36%). The…
By Analytical Department RoboForex EUR/USD opens the week around 1.1433. Investors continue to assess the…
By InvestMacro Here are the latest charts and statistics for the Commitment of Traders (COT)…
This website uses cookies.