By InvestMacro | COT | Data Tables | COT Leaders | Downloads | COT Newsletter
Here are the latest charts and statistics for the Commitment of Traders (COT) data published by the Commodities Futures Trading Commission (CFTC). The latest release was delayed by the CFTC due to the New Year’s holiday.
The latest COT data is updated through Tuesday December 28th 2021 and shows a quick view of how large traders (for-profit speculators and commercial entities) were positioned in the futures markets.
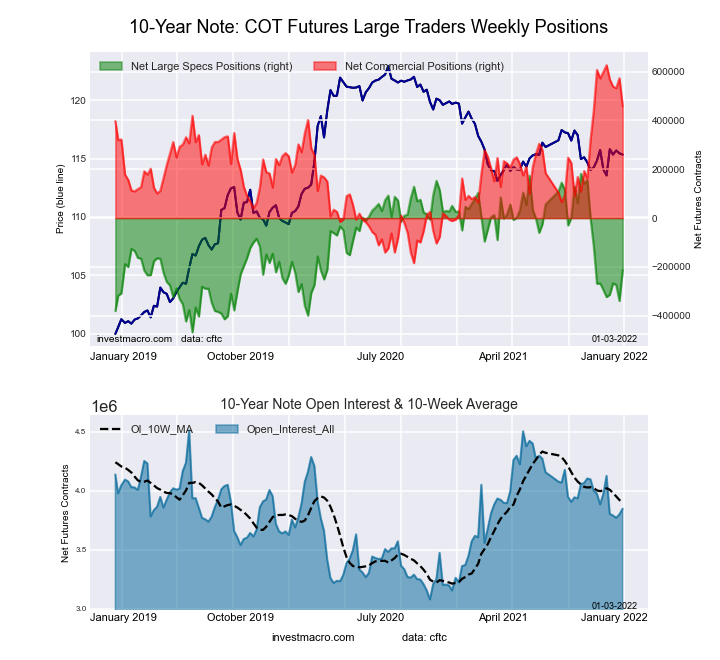
Highlighting the COT bonds data is the jump in bets for the 10-Year Bond. Speculators sharply boosted their 10-Year bets by the largest one-week amount (+125,989) of the past fifteen weeks on December 28th. This rebound strongly trimmed the overall bearish level after it had hit a 97-week bearish high on December 21st at -339,299 contracts. The 10-Year speculator standing has been in bearish territory now for eleven consecutive weeks, dating back to October 19th.
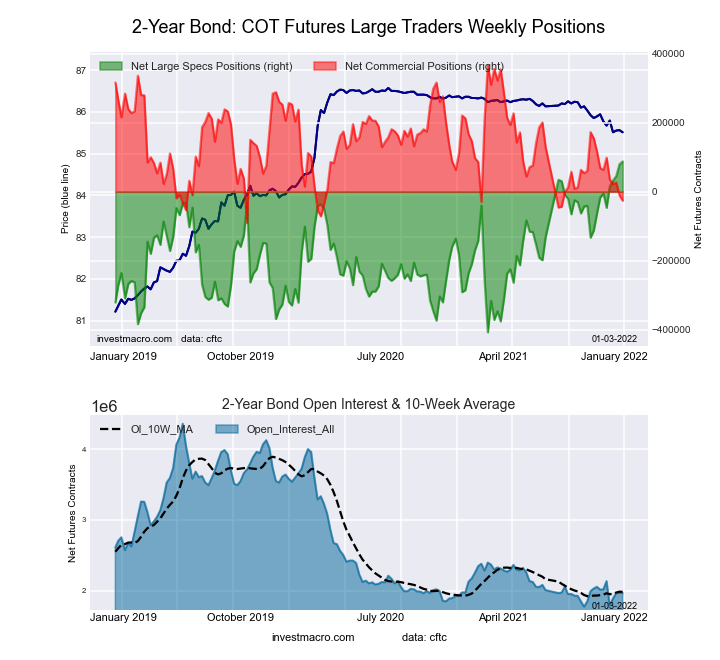
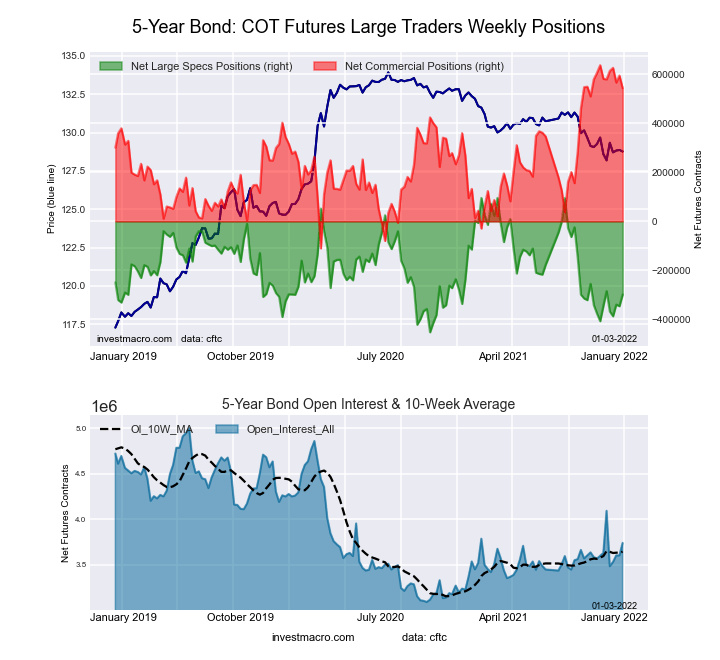
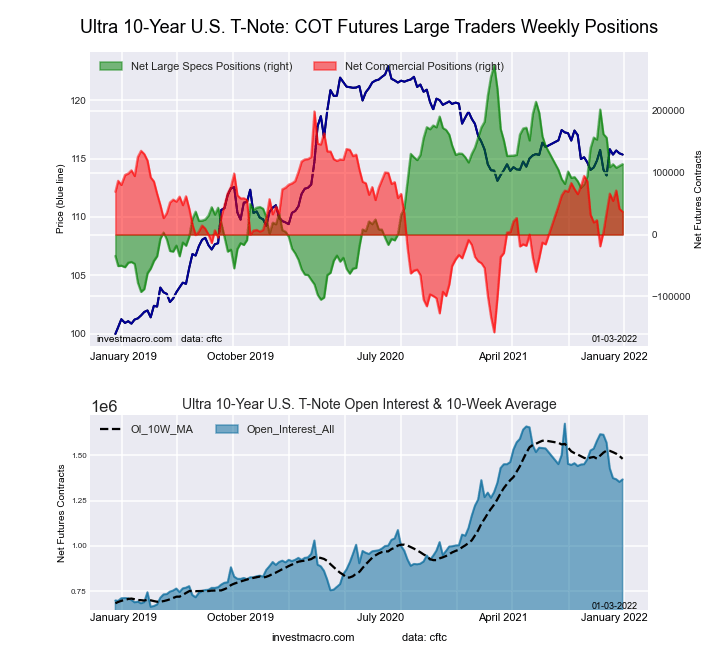
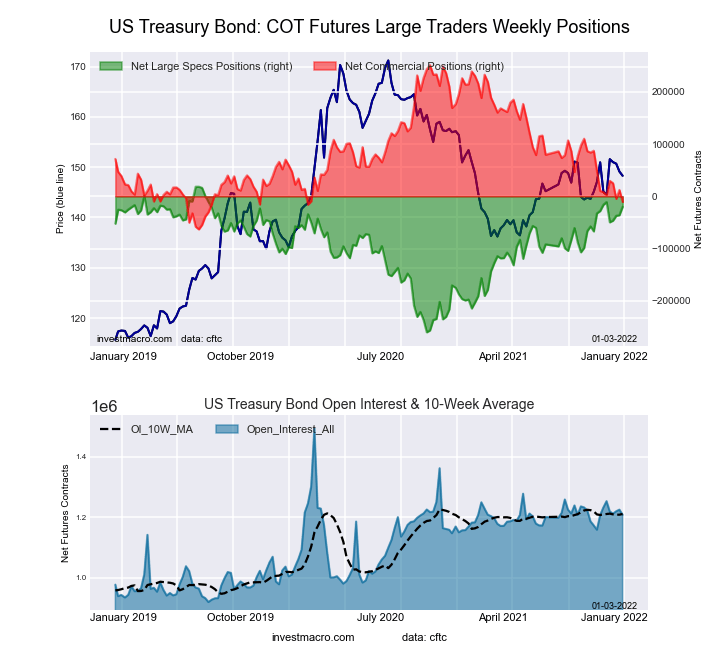
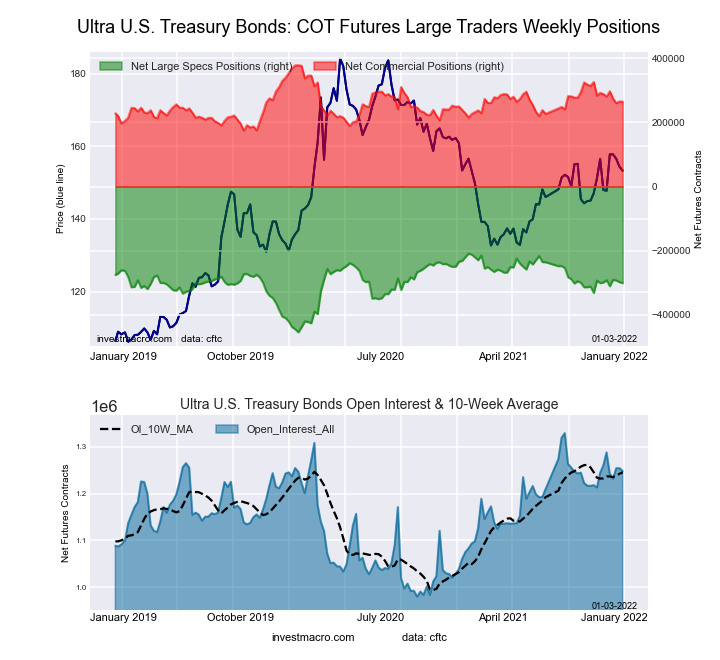
Joining the 10-Year (125,989 contracts) with gains on the week were the 2-Year Bond (8,471 contracts), Ultra 10-Year (2,904 contracts), Long US Bond (16,129 contracts) and the 5-Year (47,689 contracts) while decreasing bets for the week were seen in the Eurodollar (-13,028 contracts), FedFunds (-3,900 contracts) and the Ultra US Bond (-3,156 contracts).
| Dec-28-2021 | OI | OI-Index | Spec-Net | Spec-Index | Com-Net | COM-Index | Smalls-Net | Smalls-Index |
|---|---|---|---|---|---|---|---|---|
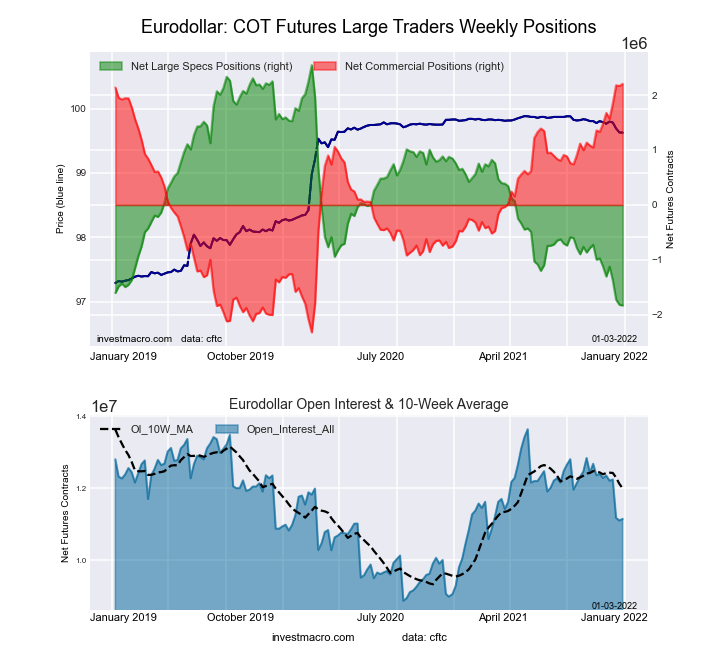
| Eurodollar | 11,150,593 | 48 | -1,827,848 | 0 | 2,203,302 | 100 | -375,454 | 31 |
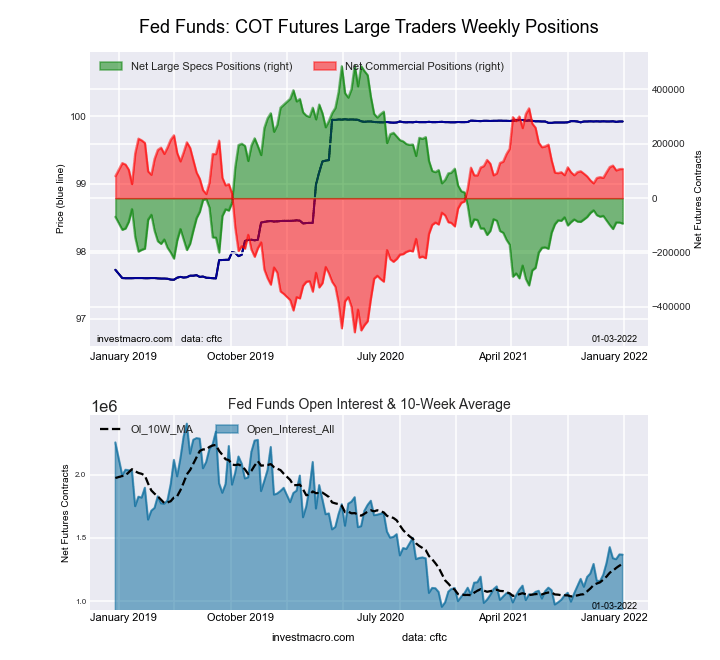
| FedFunds | 1,366,900 | 28 | -93,329 | 28 | 107,478 | 73 | -14,149 | 27 |
| 2-Year | 1,966,290 | 7 | 87,804 | 100 | -25,765 | 14 | -62,039 | 5 |
| Long T-Bond | 1,208,000 | 50 | -19,955 | 86 | -10,654 | 17 | 30,609 | 77 |
| 10-Year | 3,846,382 | 54 | -213,310 | 39 | 458,479 | 79 | -245,169 | 22 |
| 5-Year | 3,741,327 | 34 | -298,687 | 28 | 543,542 | 87 | -244,855 | 14 |
Free Reports:
This week’s current strength score (the trader positioning range over the past three years, measured from 0 to 100) shows the speculators are currently Bearish-Extreme with a score of 0.0 percent. The commercials are Bullish-Extreme with a score of 100.0 percent and the small traders (not shown in chart) are Bearish with a score of 31.1 percent.
| 3-Month Eurodollars Statistics | SPECULATORS | COMMERCIALS | SMALL TRADERS |
| – Percent of Open Interest Longs: | 7.7 | 71.9 | 3.9 |
| – Percent of Open Interest Shorts: | 24.1 | 52.1 | 7.3 |
| – Net Position: | -1,827,848 | 2,203,302 | -375,454 |
| – Gross Longs: | 854,963 | 8,015,395 | 436,619 |
| – Gross Shorts: | 2,682,811 | 5,812,093 | 812,073 |
| – Long to Short Ratio: | 0.3 to 1 | 1.4 to 1 | 0.5 to 1 |
| NET POSITION TREND: | |||
| – Strength Index Score (3 Year Range Pct): | 0.0 | 100.0 | 31.1 |
| – Strength Index Reading (3 Year Range): | Bearish-Extreme | Bullish-Extreme | Bearish |
| NET POSITION MOVEMENT INDEX: | |||
| – 6-Week Change in Strength Index: | -16.2 | 16.1 | -3.4 |
This week’s current strength score (the trader positioning range over the past three years, measured from 0 to 100) shows the speculators are currently Bearish with a score of 28.1 percent. The commercials are Bullish with a score of 72.9 percent and the small traders (not shown in chart) are Bearish with a score of 26.6 percent.
| 30-Day Federal Funds Statistics | SPECULATORS | COMMERCIALS | SMALL TRADERS |
| – Percent of Open Interest Longs: | 3.0 | 83.0 | 1.7 |
| – Percent of Open Interest Shorts: | 9.8 | 75.2 | 2.8 |
| – Net Position: | -93,329 | 107,478 | -14,149 |
| – Gross Longs: | 41,057 | 1,135,007 | 23,529 |
| – Gross Shorts: | 134,386 | 1,027,529 | 37,678 |
| – Long to Short Ratio: | 0.3 to 1 | 1.1 to 1 | 0.6 to 1 |
| NET POSITION TREND: | |||
| – Strength Index Score (3 Year Range Pct): | 28.1 | 72.9 | 26.6 |
| – Strength Index Reading (3 Year Range): | Bearish | Bullish | Bearish |
| NET POSITION MOVEMENT INDEX: | |||
| – 6-Week Change in Strength Index: | -3.5 | 4.0 | -11.1 |
This week’s current strength score (the trader positioning range over the past three years, measured from 0 to 100) shows the speculators are currently Bullish-Extreme with a score of 100.0 percent. The commercials are Bearish-Extreme with a score of 14.2 percent and the small traders (not shown in chart) are Bearish-Extreme with a score of 5.0 percent.
| 2-Year Treasury Note Statistics | SPECULATORS | COMMERCIALS | SMALL TRADERS |
| – Percent of Open Interest Longs: | 21.5 | 67.0 | 6.3 |
| – Percent of Open Interest Shorts: | 17.1 | 68.3 | 9.4 |
| – Net Position: | 87,804 | -25,765 | -62,039 |
| – Gross Longs: | 423,530 | 1,316,762 | 122,956 |
| – Gross Shorts: | 335,726 | 1,342,527 | 184,995 |
| – Long to Short Ratio: | 1.3 to 1 | 1.0 to 1 | 0.7 to 1 |
| NET POSITION TREND: | |||
| – Strength Index Score (3 Year Range Pct): | 100.0 | 14.2 | 5.0 |
| – Strength Index Reading (3 Year Range): | Bullish-Extreme | Bearish-Extreme | Bearish-Extreme |
| NET POSITION MOVEMENT INDEX: | |||
| – 6-Week Change in Strength Index: | 18.8 | -19.5 | -2.0 |
This week’s current strength score (the trader positioning range over the past three years, measured from 0 to 100) shows the speculators are currently Bearish with a score of 28.1 percent. The commercials are Bullish-Extreme with a score of 87.4 percent and the small traders (not shown in chart) are Bearish-Extreme with a score of 13.8 percent.
| 5-Year Treasury Note Statistics | SPECULATORS | COMMERCIALS | SMALL TRADERS |
| – Percent of Open Interest Longs: | 9.6 | 80.3 | 6.9 |
| – Percent of Open Interest Shorts: | 17.6 | 65.8 | 13.5 |
| – Net Position: | -298,687 | 543,542 | -244,855 |
| – Gross Longs: | 358,105 | 3,006,091 | 259,112 |
| – Gross Shorts: | 656,792 | 2,462,549 | 503,967 |
| – Long to Short Ratio: | 0.5 to 1 | 1.2 to 1 | 0.5 to 1 |
| NET POSITION TREND: | |||
| – Strength Index Score (3 Year Range Pct): | 28.1 | 87.4 | 13.8 |
| – Strength Index Reading (3 Year Range): | Bearish | Bullish-Extreme | Bearish-Extreme |
| NET POSITION MOVEMENT INDEX: | |||
| – 6-Week Change in Strength Index: | 8.4 | -5.1 | -2.0 |
This week’s current strength score (the trader positioning range over the past three years, measured from 0 to 100) shows the speculators are currently Bearish with a score of 39.2 percent. The commercials are Bullish with a score of 79.3 percent and the small traders (not shown in chart) are Bearish with a score of 21.6 percent.
| 10-Year Treasury Note Statistics | SPECULATORS | COMMERCIALS | SMALL TRADERS |
| – Percent of Open Interest Longs: | 14.2 | 75.8 | 7.6 |
| – Percent of Open Interest Shorts: | 19.7 | 63.8 | 14.0 |
| – Net Position: | -213,310 | 458,479 | -245,169 |
| – Gross Longs: | 545,337 | 2,913,736 | 291,916 |
| – Gross Shorts: | 758,647 | 2,455,257 | 537,085 |
| – Long to Short Ratio: | 0.7 to 1 | 1.2 to 1 | 0.5 to 1 |
| NET POSITION TREND: | |||
| – Strength Index Score (3 Year Range Pct): | 39.2 | 79.3 | 21.6 |
| – Strength Index Reading (3 Year Range): | Bearish | Bullish | Bearish |
| NET POSITION MOVEMENT INDEX: | |||
| – 6-Week Change in Strength Index: | 12.5 | -17.3 | 13.8 |
This week’s current strength score (the trader positioning range over the past three years, measured from 0 to 100) shows the speculators are currently Bullish with a score of 57.8 percent. The commercials are Bullish with a score of 54.6 percent and the small traders (not shown in chart) are Bearish with a score of 24.8 percent.
| Ultra 10-Year Notes Statistics | SPECULATORS | COMMERCIALS | SMALL TRADERS |
| – Percent of Open Interest Longs: | 20.1 | 70.2 | 8.7 |
| – Percent of Open Interest Shorts: | 11.7 | 67.5 | 19.7 |
| – Net Position: | 113,816 | 36,873 | -150,689 |
| – Gross Longs: | 274,231 | 959,273 | 119,235 |
| – Gross Shorts: | 160,415 | 922,400 | 269,924 |
| – Long to Short Ratio: | 1.7 to 1 | 1.0 to 1 | 0.4 to 1 |
| NET POSITION TREND: | |||
| – Strength Index Score (3 Year Range Pct): | 57.8 | 54.6 | 24.8 |
| – Strength Index Reading (3 Year Range): | Bullish | Bullish | Bearish |
| NET POSITION MOVEMENT INDEX: | |||
| – 6-Week Change in Strength Index: | -12.8 | 9.4 | 9.1 |
This week’s current strength score (the trader positioning range over the past three years, measured from 0 to 100) shows the speculators are currently Bullish-Extreme with a score of 86.3 percent. The commercials are Bearish-Extreme with a score of 16.7 percent and the small traders (not shown in chart) are Bullish with a score of 76.9 percent.
| US Treasury Bonds Statistics | SPECULATORS | COMMERCIALS | SMALL TRADERS |
| – Percent of Open Interest Longs: | 12.9 | 70.4 | 15.3 |
| – Percent of Open Interest Shorts: | 14.5 | 71.3 | 12.8 |
| – Net Position: | -19,955 | -10,654 | 30,609 |
| – Gross Longs: | 155,753 | 850,571 | 185,407 |
| – Gross Shorts: | 175,708 | 861,225 | 154,798 |
| – Long to Short Ratio: | 0.9 to 1 | 1.0 to 1 | 1.2 to 1 |
| NET POSITION TREND: | |||
| – Strength Index Score (3 Year Range Pct): | 86.3 | 16.7 | 76.9 |
| – Strength Index Reading (3 Year Range): | Bullish-Extreme | Bearish-Extreme | Bullish |
| NET POSITION MOVEMENT INDEX: | |||
| – 6-Week Change in Strength Index: | -1.3 | -6.0 | 17.9 |
This week’s current strength score (the trader positioning range over the past three years, measured from 0 to 100) shows the speculators are currently Bullish with a score of 62.5 percent. The commercials are Bearish with a score of 44.3 percent and the small traders (not shown in chart) are Bullish with a score of 54.3 percent.
| Ultra US Treasury Bonds Statistics | SPECULATORS | COMMERCIALS | SMALL TRADERS |
| – Percent of Open Interest Longs: | 6.6 | 80.1 | 12.8 |
| – Percent of Open Interest Shorts: | 30.7 | 58.9 | 9.9 |
| – Net Position: | -300,717 | 264,412 | 36,305 |
| – Gross Longs: | 82,877 | 999,528 | 159,612 |
| – Gross Shorts: | 383,594 | 735,116 | 123,307 |
| – Long to Short Ratio: | 0.2 to 1 | 1.4 to 1 | 1.3 to 1 |
| NET POSITION TREND: | |||
| – Strength Index Score (3 Year Range Pct): | 62.5 | 44.3 | 54.3 |
| – Strength Index Reading (3 Year Range): | Bullish | Bearish | Bullish |
| NET POSITION MOVEMENT INDEX: | |||
| – 6-Week Change in Strength Index: | -0.8 | -11.6 | 18.3 |
Article By InvestMacro – Receive our weekly COT Reports by Email
*COT Report: The COT data, released weekly to the public each Friday, is updated through the most recent Tuesday (data is 3 days old) and shows a quick view of how large speculators or non-commercials (for-profit traders) were positioned in the futures markets.
The CFTC categorizes trader positions according to commercial hedgers (traders who use futures contracts for hedging as part of the business), non-commercials (large traders who speculate to realize trading profits) and nonreportable traders (usually small traders/speculators) as well as their open interest (contracts open in the market at time of reporting).See CFTC criteria here.
By Jeffrey Young, Georgia Institute of Technology You’ve probably heard artificial intelligence models described as…
Source: Barry Dawes (7/23/26) Barry Dawes of Martin Place Securities shares his analysis of the…
By JustMarkets The US stock indices ended Thursday’s session with a notable decline amid a…
By Analytical Department RoboForex USD/JPY soared to 163.81 on Friday, marking a new 40-year high.…
By JustMarkets The US equities ended Wednesday’s session lower amid investor caution ahead of the…
By Analytical Department RoboForex EUR/USD rose to 1.1429 on Thursday, with the US dollar continuing…
This website uses cookies.