By InvestMacro | COT | Data Tables | COT Leaders | Downloads | COT Newsletter
Here are the latest charts and statistics for the Commitment of Traders (COT) data published by the Commodities Futures Trading Commission (CFTC).
The latest COT data is updated through Tuesday December 7th 2021 and shows a quick view of how large traders (for-profit speculators and commercial entities) were positioned in the futures markets.
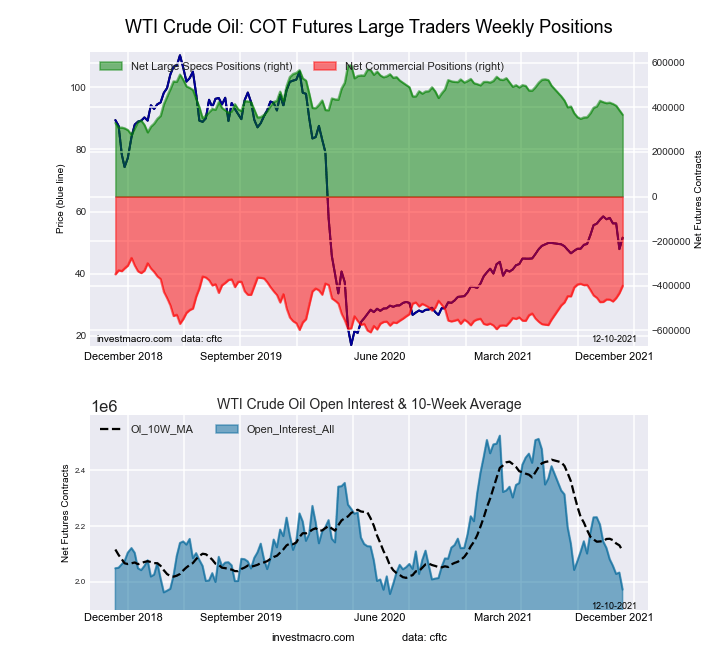
Highlighting this week’s COT energy data is the recent decline in the WTI Crude Oil futures bets. The speculative net position in the WTI Crude Oil futures has now fallen for four consecutive weeks and in six out of the past seven weeks. The spec crude position has dropped by a total of -62,362 contracts over these past seven weeks and speculators have now pushed their current net positioning to the lowest level since September 21st, a span of eleven weeks.
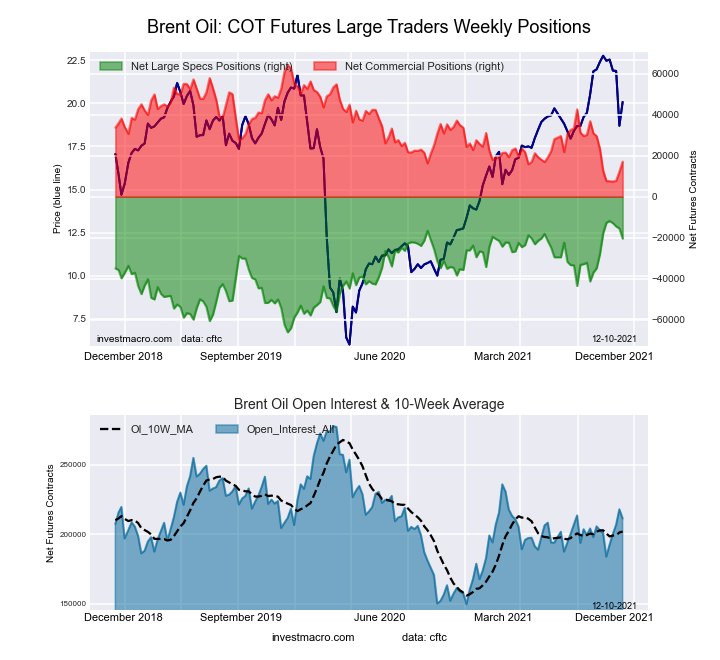
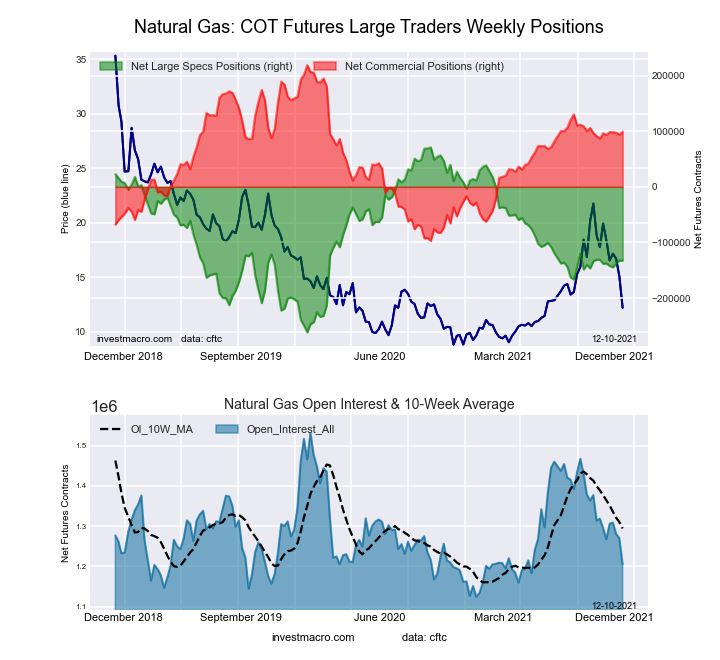
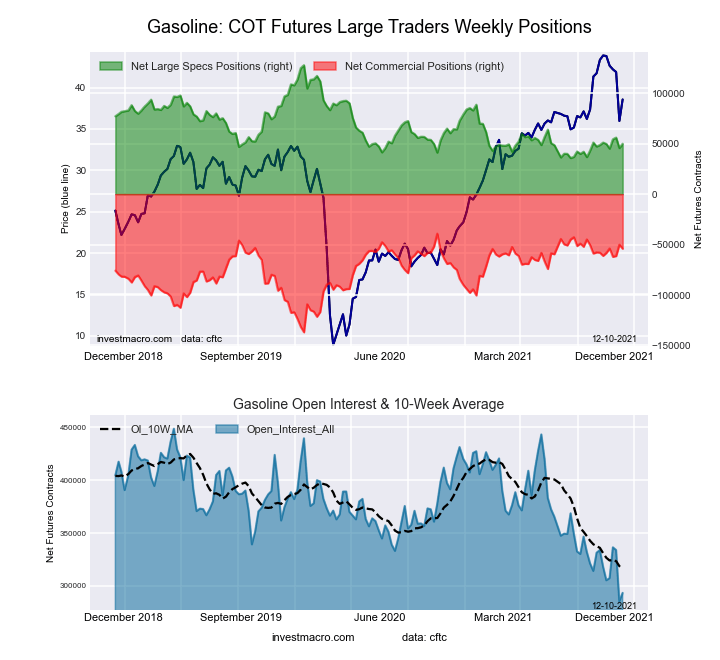
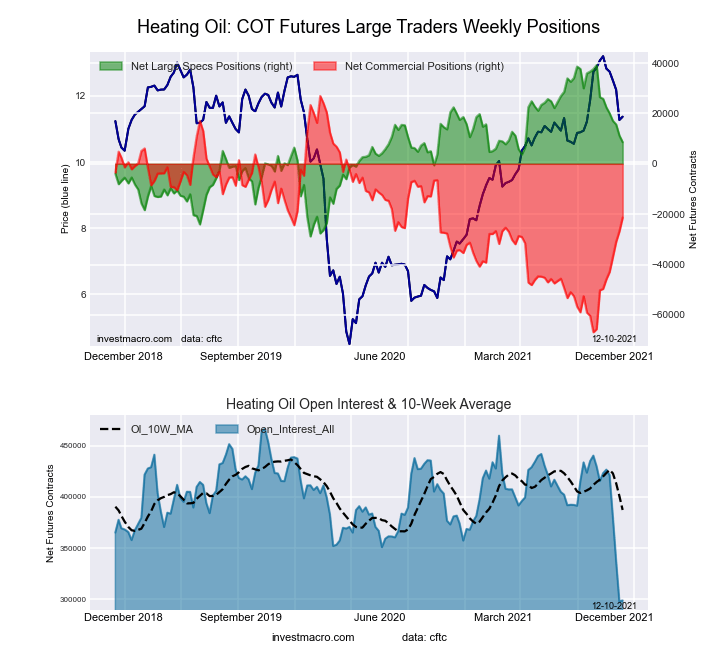
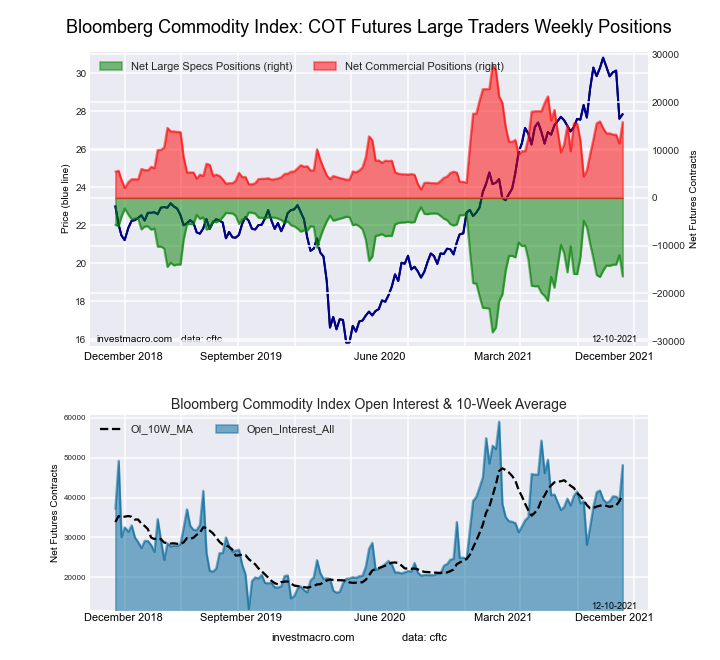
Joining WTI Crude Oil (-20,002 contracts) with decreasing bets this week are Brent Crude Oil (-4,952 contracts), Heating Oil (-2,628 contracts) and the Bloomberg Commodity Index (-4,473 contracts). The energy markets with gaining positions this week were Natural Gas (235 contracts) and Gasoline (4,269 contracts).
| Dec-07-2021 | OI | OI-Index | Spec-Net | Spec-Index | Com-Net | COM-Index | Smalls-Net | Smalls-Index |
|---|---|---|---|---|---|---|---|---|
| WTI Crude | 1,972,536 | 3 | 367,232 | 29 | -400,431 | 62 | 33,199 | 62 |
| Gold | 499,307 | 23 | 217,185 | 57 | -245,623 | 43 | 28,438 | 45 |
| Silver | 136,572 | 4 | 29,833 | 52 | -43,148 | 57 | 13,315 | 17 |
| Copper | 173,954 | 8 | 7,204 | 48 | -14,219 | 50 | 7,015 | 66 |
| Palladium | 9,253 | 12 | -2,731 | 4 | 3,036 | 97 | -305 | 27 |
| Platinum | 65,134 | 30 | 6,062 | 11 | -12,138 | 92 | 6,076 | 47 |
| Natural Gas | 1,205,626 | 20 | -132,443 | 39 | 99,372 | 62 | 33,071 | 63 |
| Brent | 211,254 | 48 | -20,446 | 84 | 17,107 | 17 | 3,339 | 55 |
| Heating Oil | 298,997 | 0 | 8,597 | 55 | -21,351 | 49 | 12,754 | 43 |
| Soybeans | 672,116 | 15 | 59,654 | 45 | -22,744 | 60 | -36,910 | 10 |
| Corn | 1,430,401 | 9 | 410,814 | 83 | -367,873 | 20 | -42,941 | 18 |
| Coffee | 265,046 | 33 | 62,344 | 94 | -65,596 | 8 | 3,252 | 11 |
| Sugar | 857,621 | 8 | 191,239 | 76 | -221,289 | 26 | 30,050 | 45 |
| Wheat | 359,186 | 12 | 15,667 | 60 | -8,386 | 33 | -7,281 | 67 |
Free Reports:
This week’s current strength score (the trader positioning range over the past three years, measured from 0 to 100) shows the speculators are currently Bearish with a score of 28.8 percent. The commercials are Bullish with a score of 62.4 percent and the small traders (not shown in chart) are Bullish with a score of 61.8 percent.
| WTI Crude Oil Futures Statistics | SPECULATORS | COMMERCIALS | SMALL TRADERS |
| – Percent of Open Interest Longs: | 25.0 | 36.7 | 4.2 |
| – Percent of Open Interest Shorts: | 6.4 | 57.0 | 2.5 |
| – Net Position: | 367,232 | -400,431 | 33,199 |
| – Gross Longs: | 492,585 | 724,626 | 82,580 |
| – Gross Shorts: | 125,353 | 1,125,057 | 49,381 |
| – Long to Short Ratio: | 3.9 to 1 | 0.6 to 1 | 1.7 to 1 |
| NET POSITION TREND: | |||
| – Strength Index Score (3 Year Range Pct): | 28.8 | 62.4 | 61.8 |
| – Strength Index Reading (3 Year Range): | Bearish | Bullish | Bullish |
| NET POSITION MOVEMENT INDEX: | |||
| – 6-Week Change in Strength Index: | -18.1 | 21.6 | -21.9 |
This week’s current strength score (the trader positioning range over the past three years, measured from 0 to 100) shows the speculators are currently Bullish-Extreme with a score of 84.2 percent. The commercials are Bearish-Extreme with a score of 17.1 percent and the small traders (not shown in chart) are Bullish with a score of 54.5 percent.
| Brent Crude Oil Futures Statistics | SPECULATORS | COMMERCIALS | SMALL TRADERS |
| – Percent of Open Interest Longs: | 21.6 | 44.2 | 3.6 |
| – Percent of Open Interest Shorts: | 31.3 | 36.1 | 2.0 |
| – Net Position: | -20,446 | 17,107 | 3,339 |
| – Gross Longs: | 45,573 | 93,348 | 7,669 |
| – Gross Shorts: | 66,019 | 76,241 | 4,330 |
| – Long to Short Ratio: | 0.7 to 1 | 1.2 to 1 | 1.8 to 1 |
| NET POSITION TREND: | |||
| – Strength Index Score (3 Year Range Pct): | 84.2 | 17.1 | 54.5 |
| – Strength Index Reading (3 Year Range): | Bullish-Extreme | Bearish-Extreme | Bullish |
| NET POSITION MOVEMENT INDEX: | |||
| – 6-Week Change in Strength Index: | -4.8 | 7.8 | -24.6 |
This week’s current strength score (the trader positioning range over the past three years, measured from 0 to 100) shows the speculators are currently Bearish with a score of 38.8 percent. The commercials are Bullish with a score of 62.2 percent and the small traders (not shown in chart) are Bullish with a score of 62.7 percent.
| Natural Gas Futures Statistics | SPECULATORS | COMMERCIALS | SMALL TRADERS |
| – Percent of Open Interest Longs: | 19.3 | 43.5 | 4.6 |
| – Percent of Open Interest Shorts: | 30.3 | 35.2 | 1.9 |
| – Net Position: | -132,443 | 99,372 | 33,071 |
| – Gross Longs: | 233,007 | 524,229 | 55,682 |
| – Gross Shorts: | 365,450 | 424,857 | 22,611 |
| – Long to Short Ratio: | 0.6 to 1 | 1.2 to 1 | 2.5 to 1 |
| NET POSITION TREND: | |||
| – Strength Index Score (3 Year Range Pct): | 38.8 | 62.2 | 62.7 |
| – Strength Index Reading (3 Year Range): | Bearish | Bullish | Bullish |
| NET POSITION MOVEMENT INDEX: | |||
| – 6-Week Change in Strength Index: | 1.7 | 1.0 | -22.1 |
This week’s current strength score (the trader positioning range over the past three years, measured from 0 to 100) shows the speculators are currently Bearish with a score of 20.9 percent. The commercials are Bullish-Extreme with a score of 82.9 percent and the small traders (not shown in chart) are Bearish with a score of 36.7 percent.
| Nasdaq Mini Futures Statistics | SPECULATORS | COMMERCIALS | SMALL TRADERS |
| – Percent of Open Interest Longs: | 30.4 | 48.5 | 5.7 |
| – Percent of Open Interest Shorts: | 13.4 | 66.9 | 4.3 |
| – Net Position: | 49,883 | -54,093 | 4,210 |
| – Gross Longs: | 89,156 | 142,169 | 16,850 |
| – Gross Shorts: | 39,273 | 196,262 | 12,640 |
| – Long to Short Ratio: | 2.3 to 1 | 0.7 to 1 | 1.3 to 1 |
| NET POSITION TREND: | |||
| – Strength Index Score (3 Year Range Pct): | 20.9 | 82.9 | 36.7 |
| – Strength Index Reading (3 Year Range): | Bearish | Bullish-Extreme | Bearish |
| NET POSITION MOVEMENT INDEX: | |||
| – 6-Week Change in Strength Index: | -1.2 | 7.1 | -35.4 |
This week’s current strength score (the trader positioning range over the past three years, measured from 0 to 100) shows the speculators are currently Bullish with a score of 55.1 percent. The commercials are Bearish with a score of 48.5 percent and the small traders (not shown in chart) are Bearish with a score of 42.5 percent.
| Heating Oil Futures Statistics | SPECULATORS | COMMERCIALS | SMALL TRADERS |
| – Percent of Open Interest Longs: | 13.3 | 53.4 | 12.9 |
| – Percent of Open Interest Shorts: | 10.5 | 60.6 | 8.7 |
| – Net Position: | 8,597 | -21,351 | 12,754 |
| – Gross Longs: | 39,877 | 159,783 | 38,689 |
| – Gross Shorts: | 31,280 | 181,134 | 25,935 |
| – Long to Short Ratio: | 1.3 to 1 | 0.9 to 1 | 1.5 to 1 |
| NET POSITION TREND: | |||
| – Strength Index Score (3 Year Range Pct): | 55.1 | 48.5 | 42.5 |
| – Strength Index Reading (3 Year Range): | Bullish | Bearish | Bearish |
| NET POSITION MOVEMENT INDEX: | |||
| – 6-Week Change in Strength Index: | -25.3 | 30.2 | -38.4 |
This week’s current strength score (the trader positioning range over the past three years, measured from 0 to 100) shows the speculators are currently Bearish with a score of 44.7 percent. The commercials are Bullish with a score of 54.3 percent and the small traders (not shown in chart) are Bearish with a score of 48.7 percent.
| Bloomberg Index Futures Statistics | SPECULATORS | COMMERCIALS | SMALL TRADERS |
| – Percent of Open Interest Longs: | 59.0 | 37.1 | 1.2 |
| – Percent of Open Interest Shorts: | 93.0 | 4.2 | 0.1 |
| – Net Position: | -16,421 | 15,865 | 556 |
| – Gross Longs: | 28,421 | 17,881 | 597 |
| – Gross Shorts: | 44,842 | 2,016 | 41 |
| – Long to Short Ratio: | 0.6 to 1 | 8.9 to 1 | 14.6 to 1 |
| NET POSITION TREND: | |||
| – Strength Index Score (3 Year Range Pct): | 44.7 | 54.3 | 48.7 |
| – Strength Index Reading (3 Year Range): | Bearish | Bullish | Bearish |
| NET POSITION MOVEMENT INDEX: | |||
| – 6-Week Change in Strength Index: | -4.8 | 5.0 | -2.6 |
Article By InvestMacro – Receive our weekly COT Reports by Email
*COT Report: The COT data, released weekly to the public each Friday, is updated through the most recent Tuesday (data is 3 days old) and shows a quick view of how large speculators or non-commercials (for-profit traders) were positioned in the futures markets.
The CFTC categorizes trader positions according to commercial hedgers (traders who use futures contracts for hedging as part of the business), non-commercials (large traders who speculate to realize trading profits) and nonreportable traders (usually small traders/speculators) as well as their open interest (contracts open in the market at time of reporting).See CFTC criteria here.
By JustMarkets On Thursday, the US stock indices posted strong gains, fully recovering from the…
By Analytical Department RoboForex USD/JPY recovered to 160.60 on Friday following a sharp drop the…
By Patrick J. Schena, Tufts University Creating a government fund to own AI stock and…
By JustMarkets The US equity indices ended Wednesday’s session with notable declines as geopolitical risks…
By Analytical Department RoboForex USD/JPY held near 163.50 on Thursday, with the yen retreating slightly…
By Analytical Department RoboForex GBP/USD continued to consolidate at 1.3283 on Wednesday. The British pound…
This website uses cookies.