By InvestMacro | COT | Data Tables | COT Leaders | Downloads | COT Newsletter
Here are the latest charts and statistics for the Commitment of Traders (COT) data published by the Commodities Futures Trading Commission (CFTC).
The latest COT data is updated through Tuesday November 9th 2021 and shows a quick view of how large traders (for-profit speculators and commercial entities) were positioned in the futures markets. This week’s reports are delayed due to last week’s Veteran’s Day holiday.
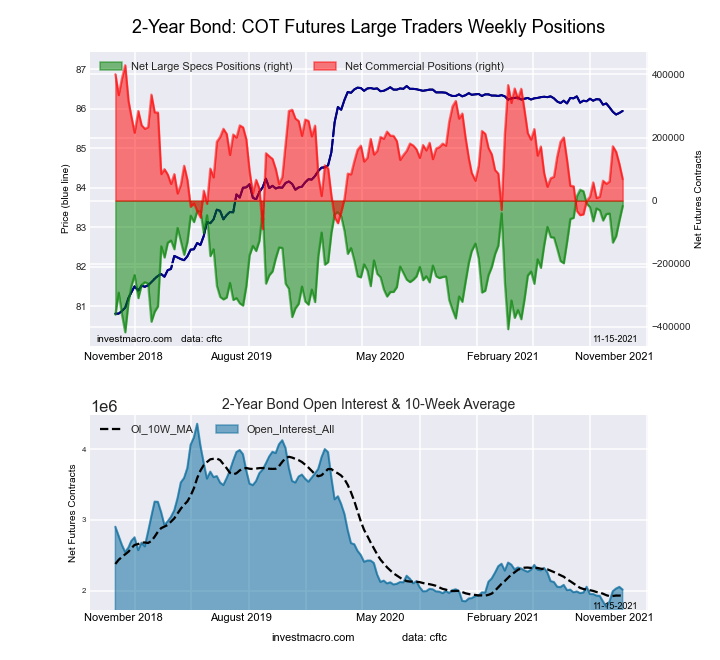
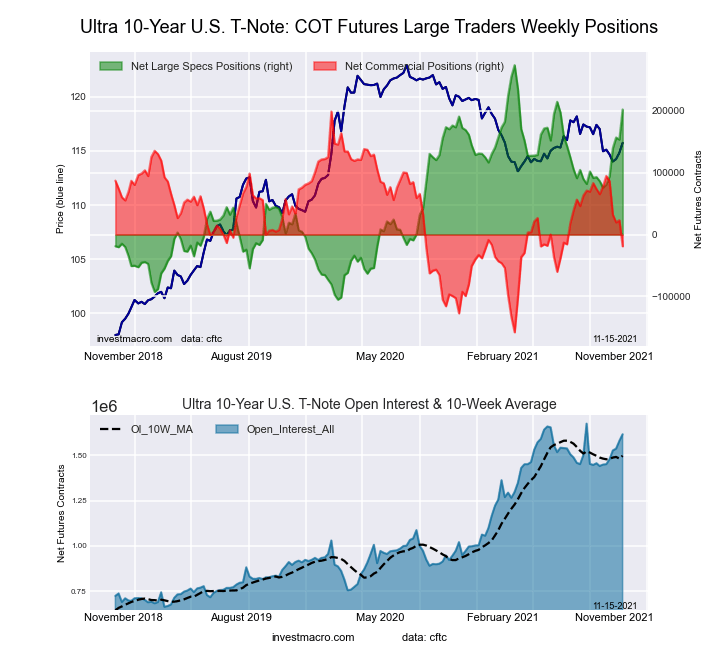
Highlighting this week’s COT data for bonds were the gains in speculative bets for the Ultra 10-Year Notes and the 2-Year bond. These two markets each rose by over +46,000 net positions this week and led the weekly net changes for all the markets we cover. These two markets are also in extreme bullish positions for the speculator strength indexes with the 2-Year bond at an 88.6 percent score while the Ultra 10-Year is at an 81.1 percent score. The strength index weighs the current position against the past three years with extreme scores above 80 (bullish) and below 20 (bearish).
| Nov-09-2021 | OI | OI-Index | Spec-Net | Spec-Index | Com-Net | COM-Index | Smalls-Net | Smalls-Index |
|---|---|---|---|---|---|---|---|---|
| Eurodollar | 12,396,094 | 63 | -971,910 | 31 | 1,331,314 | 65 | -359,404 | 56 |
| FedFunds | 1,157,278 | 14 | -67,949 | 31 | 77,176 | 69 | -9,227 | 45 |
| 2-Year | 2,013,763 | 9 | -16,737 | 89 | 68,313 | 31 | -51,576 | 1 |
| Long T-Bond | 1,206,593 | 50 | -28,072 | 83 | 10,259 | 23 | 17,813 | 67 |
| 10-Year | 3,883,483 | 56 | -267,332 | 31 | 572,247 | 96 | -304,915 | 8 |
| 5-Year | 3,600,589 | 26 | -407,485 | 8 | 637,634 | 100 | -230,149 | 8 |
Free Reports:
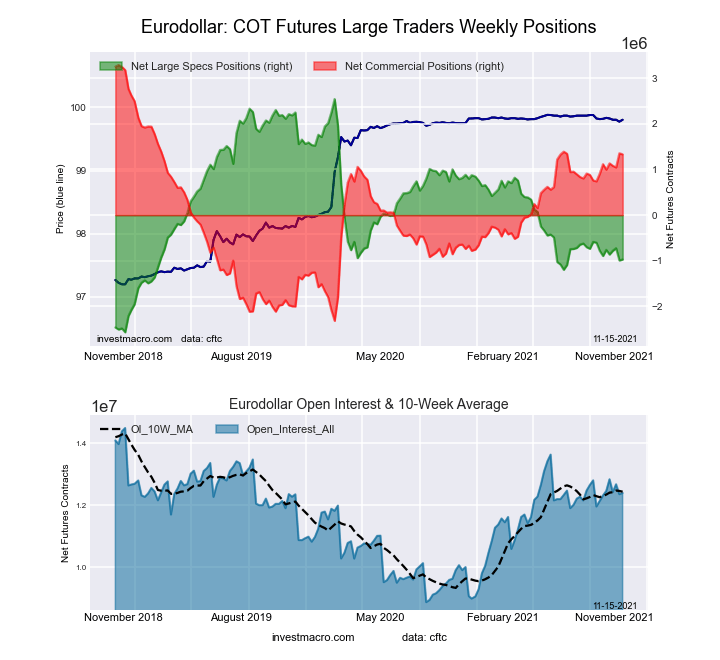
This week’s current strength score (the trader positioning range over the past three years, measured from 0 to 100) shows the speculators are currently Bearish with a score of 31.2 percent. The commercials are Bullish with a score of 65.1 percent and the small traders (not shown in chart) are Bullish with a score of 55.9 percent.
| 3-Month Eurodollars Statistics | SPECULATORS | COMMERCIALS | SMALL TRADERS |
| – Percent of Open Interest Longs: | 12.8 | 66.8 | 4.0 |
| – Percent of Open Interest Shorts: | 20.6 | 56.0 | 6.9 |
| – Net Position: | -971,910 | 1,331,314 | -359,404 |
| – Gross Longs: | 1,581,479 | 8,275,703 | 492,587 |
| – Gross Shorts: | 2,553,389 | 6,944,389 | 851,991 |
| – Long to Short Ratio: | 0.6 to 1 | 1.2 to 1 | 0.6 to 1 |
| NET POSITION TREND: | |||
| – COT Index Score (3 Year Range Pct): | 31.2 | 65.1 | 55.9 |
| – COT Index Reading (3 Year Range): | Bearish | Bullish | Bullish |
| NET POSITION MOVEMENT INDEX: | |||
| – 6-Week Change in Strength Index: | -1.5 | 3.8 | -18.0 |
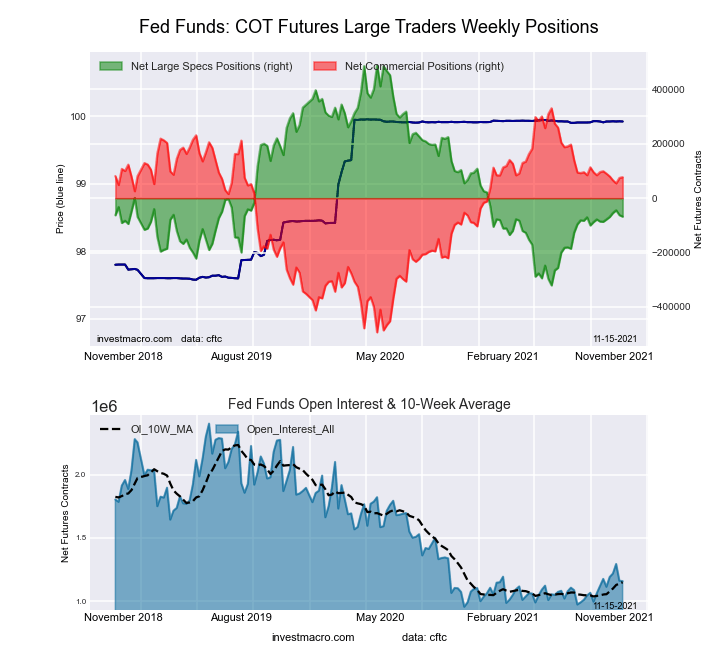
This week’s current strength score (the trader positioning range over the past three years, measured from 0 to 100) shows the speculators are currently Bearish with a score of 31.2 percent. The commercials are Bullish with a score of 69.3 percent and the small traders (not shown in chart) are Bearish with a score of 45.4 percent.
| 30-Day Federal Funds Statistics | SPECULATORS | COMMERCIALS | SMALL TRADERS |
| – Percent of Open Interest Longs: | 4.2 | 81.5 | 2.0 |
| – Percent of Open Interest Shorts: | 10.1 | 74.8 | 2.8 |
| – Net Position: | -67,949 | 77,176 | -9,227 |
| – Gross Longs: | 48,886 | 943,134 | 22,753 |
| – Gross Shorts: | 116,835 | 865,958 | 31,980 |
| – Long to Short Ratio: | 0.4 to 1 | 1.1 to 1 | 0.7 to 1 |
| NET POSITION TREND: | |||
| – COT Index Score (3 Year Range Pct): | 31.2 | 69.3 | 45.4 |
| – COT Index Reading (3 Year Range): | Bearish | Bullish | Bearish |
| NET POSITION MOVEMENT INDEX: | |||
| – 6-Week Change in Strength Index: | 2.3 | -2.7 | 6.2 |
This week’s current strength score (the trader positioning range over the past three years, measured from 0 to 100) shows the speculators are currently Bullish-Extreme with a score of 88.6 percent. The commercials are Bearish with a score of 30.6 percent and the small traders (not shown in chart) are Bearish-Extreme with a score of 0.9 percent.
| 2-Year Treasury Note Statistics | SPECULATORS | COMMERCIALS | SMALL TRADERS |
| – Percent of Open Interest Longs: | 17.1 | 73.1 | 6.2 |
| – Percent of Open Interest Shorts: | 18.0 | 69.7 | 8.7 |
| – Net Position: | -16,737 | 68,313 | -51,576 |
| – Gross Longs: | 345,187 | 1,471,287 | 124,473 |
| – Gross Shorts: | 361,924 | 1,402,974 | 176,049 |
| – Long to Short Ratio: | 1.0 to 1 | 1.0 to 1 | 0.7 to 1 |
| NET POSITION TREND: | |||
| – COT Index Score (3 Year Range Pct): | 88.6 | 30.6 | 0.9 |
| – COT Index Reading (3 Year Range): | Bullish-Extreme | Bearish | Bearish-Extreme |
| NET POSITION MOVEMENT INDEX: | |||
| – 6-Week Change in Strength Index: | 10.2 | 1.0 | -29.0 |
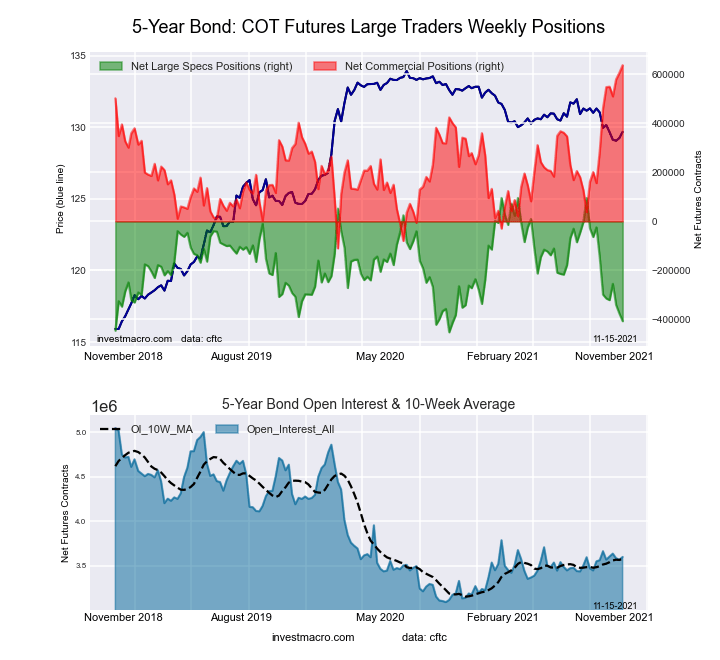
This week’s current strength score (the trader positioning range over the past three years, measured from 0 to 100) shows the speculators are currently Bearish-Extreme with a score of 8.3 percent. The commercials are Bullish-Extreme with a score of 100.0 percent and the small traders (not shown in chart) are Bearish-Extreme with a score of 7.7 percent.
| 5-Year Treasury Note Statistics | SPECULATORS | COMMERCIALS | SMALL TRADERS |
| – Percent of Open Interest Longs: | 7.2 | 82.3 | 7.1 |
| – Percent of Open Interest Shorts: | 18.5 | 64.6 | 13.5 |
| – Net Position: | -407,485 | 637,634 | -230,149 |
| – Gross Longs: | 258,018 | 2,964,073 | 256,898 |
| – Gross Shorts: | 665,503 | 2,326,439 | 487,047 |
| – Long to Short Ratio: | 0.4 to 1 | 1.3 to 1 | 0.5 to 1 |
| NET POSITION TREND: | |||
| – COT Index Score (3 Year Range Pct): | 8.3 | 100.0 | 7.7 |
| – COT Index Reading (3 Year Range): | Bearish-Extreme | Bullish-Extreme | Bearish-Extreme |
| NET POSITION MOVEMENT INDEX: | |||
| – 6-Week Change in Strength Index: | -19.8 | 23.5 | -20.8 |
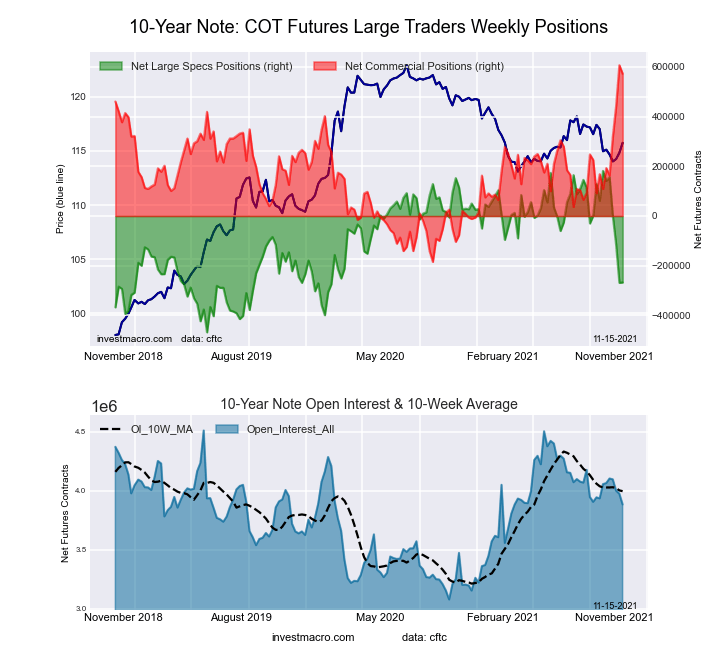
This week’s current strength score (the trader positioning range over the past three years, measured from 0 to 100) shows the speculators are currently Bearish with a score of 30.9 percent. The commercials are Bullish-Extreme with a score of 95.7 percent and the small traders (not shown in chart) are Bearish-Extreme with a score of 7.7 percent.
| 10-Year Treasury Note Statistics | SPECULATORS | COMMERCIALS | SMALL TRADERS |
| – Percent of Open Interest Longs: | 12.7 | 76.6 | 7.8 |
| – Percent of Open Interest Shorts: | 19.5 | 61.9 | 15.7 |
| – Net Position: | -267,332 | 572,247 | -304,915 |
| – Gross Longs: | 491,821 | 2,976,174 | 303,939 |
| – Gross Shorts: | 759,153 | 2,403,927 | 608,854 |
| – Long to Short Ratio: | 0.6 to 1 | 1.2 to 1 | 0.5 to 1 |
| NET POSITION TREND: | |||
| – COT Index Score (3 Year Range Pct): | 30.9 | 95.7 | 7.7 |
| – COT Index Reading (3 Year Range): | Bearish | Bullish-Extreme | Bearish-Extreme |
| NET POSITION MOVEMENT INDEX: | |||
| – 6-Week Change in Strength Index: | -69.1 | 58.6 | -3.5 |
This week’s current strength score (the trader positioning range over the past three years, measured from 0 to 100) shows the speculators are currently Bullish-Extreme with a score of 81.1 percent. The commercials are Bearish with a score of 39.0 percent and the small traders (not shown in chart) are Bearish-Extreme with a score of 0.0 percent.
| Ultra 10-Year Notes Statistics | SPECULATORS | COMMERCIALS | SMALL TRADERS |
| – Percent of Open Interest Longs: | 22.0 | 71.0 | 6.6 |
| – Percent of Open Interest Shorts: | 9.5 | 72.2 | 17.9 |
| – Net Position: | 202,050 | -18,901 | -183,149 |
| – Gross Longs: | 355,010 | 1,147,620 | 105,943 |
| – Gross Shorts: | 152,960 | 1,166,521 | 289,092 |
| – Long to Short Ratio: | 2.3 to 1 | 1.0 to 1 | 0.4 to 1 |
| NET POSITION TREND: | |||
| – COT Index Score (3 Year Range Pct): | 81.1 | 39.0 | 0.0 |
| – COT Index Reading (3 Year Range): | Bullish-Extreme | Bearish | Bearish-Extreme |
| NET POSITION MOVEMENT INDEX: | |||
| – 6-Week Change in Strength Index: | 33.3 | -27.2 | -18.5 |
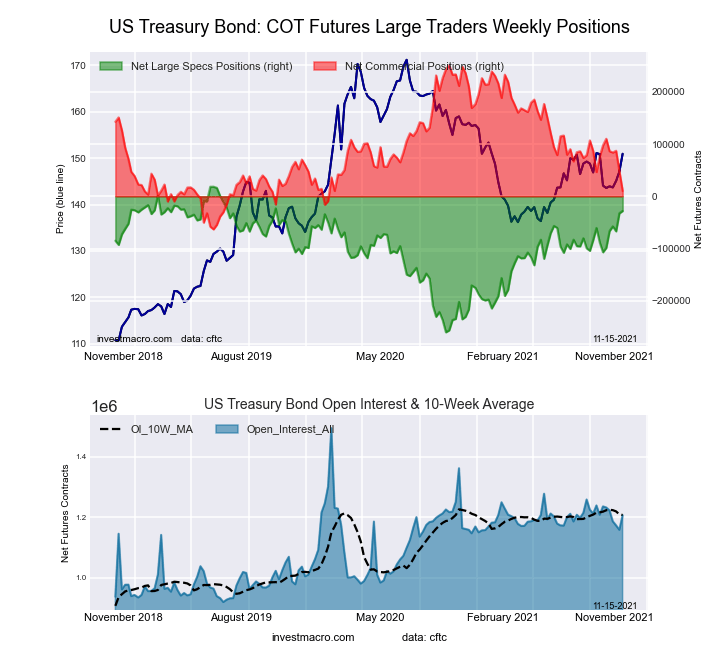
This week’s current strength score (the trader positioning range over the past three years, measured from 0 to 100) shows the speculators are currently Bullish-Extreme with a score of 83.3 percent. The commercials are Bearish with a score of 23.4 percent and the small traders (not shown in chart) are Bullish with a score of 66.7 percent.
| US Treasury Bonds Statistics | SPECULATORS | COMMERCIALS | SMALL TRADERS |
| – Percent of Open Interest Longs: | 11.0 | 71.6 | 15.5 |
| – Percent of Open Interest Shorts: | 13.3 | 70.7 | 14.0 |
| – Net Position: | -28,072 | 10,259 | 17,813 |
| – Gross Longs: | 132,694 | 863,487 | 186,632 |
| – Gross Shorts: | 160,766 | 853,228 | 168,819 |
| – Long to Short Ratio: | 0.8 to 1 | 1.0 to 1 | 1.1 to 1 |
| NET POSITION TREND: | |||
| – COT Index Score (3 Year Range Pct): | 83.3 | 23.4 | 66.7 |
| – COT Index Reading (3 Year Range): | Bullish-Extreme | Bearish | Bullish |
| NET POSITION MOVEMENT INDEX: | |||
| – 6-Week Change in Strength Index: | 28.3 | -27.7 | 6.5 |
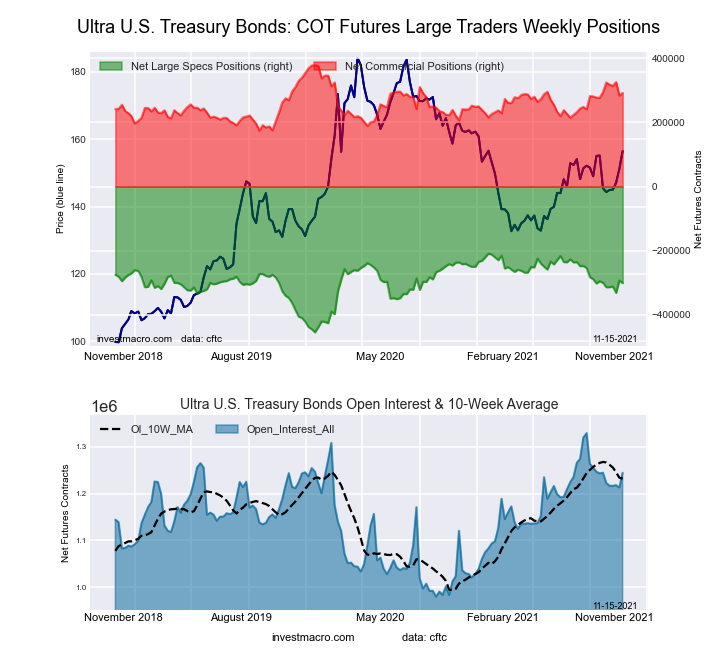
This week’s current strength score (the trader positioning range over the past three years, measured from 0 to 100) shows the speculators are currently Bullish with a score of 62.5 percent. The commercials are Bullish with a score of 57.7 percent and the small traders (not shown in chart) are Bearish with a score of 34.8 percent.
| Ultra US Treasury Bonds Statistics | SPECULATORS | COMMERCIALS | SMALL TRADERS |
| – Percent of Open Interest Longs: | 4.7 | 81.4 | 12.7 |
| – Percent of Open Interest Shorts: | 28.8 | 58.0 | 12.0 |
| – Net Position: | -300,782 | 291,663 | 9,119 |
| – Gross Longs: | 58,213 | 1,013,082 | 157,838 |
| – Gross Shorts: | 358,995 | 721,419 | 148,719 |
| – Long to Short Ratio: | 0.2 to 1 | 1.4 to 1 | 1.1 to 1 |
| NET POSITION TREND: | |||
| – COT Index Score (3 Year Range Pct): | 62.5 | 57.7 | 34.8 |
| – COT Index Reading (3 Year Range): | Bullish | Bullish | Bearish |
| NET POSITION MOVEMENT INDEX: | |||
| – 6-Week Change in Strength Index: | -0.4 | -1.5 | 2.9 |
Article By InvestMacro – Receive our weekly COT Reports by Email
*COT Report: The COT data, released weekly to the public each Friday, is updated through the most recent Tuesday (data is 3 days old) and shows a quick view of how large speculators or non-commercials (for-profit traders) were positioned in the futures markets.
The CFTC categorizes trader positions according to commercial hedgers (traders who use futures contracts for hedging as part of the business), non-commercials (large traders who speculate to realize trading profits) and nonreportable traders (usually small traders/speculators) as well as their open interest (contracts open in the market at time of reporting).See CFTC criteria here.
By JustMarkets On Tuesday, the US stock indices finished the session in the green, supported…
By Analytical Department RoboForex GBP/USD rose to 1.3403 on Wednesday, with British politics taking centre…
By Analytical Department RoboForex USD/JPY ended Tuesday at 162.27, with the Japanese yen remaining near…
By JustMarkets On Friday, the Dow Jones Index (US30) rose by 0.29% (weekly: -0.36%). The…
By Analytical Department RoboForex EUR/USD opens the week around 1.1433. Investors continue to assess the…
By InvestMacro Here are the latest charts and statistics for the Commitment of Traders (COT)…
This website uses cookies.