By InvestMacro | COT | Data Tables | COT Leaders | Downloads | COT Newsletter
Here are the latest charts and statistics for the Commitment of Traders (COT) data published by the Commodities Futures Trading Commission (CFTC).
The latest COT data is updated through Tuesday November 9th 2021 and shows a quick view of how large traders (for-profit speculators and commercial entities) were positioned in the futures markets. This week’s reports are delayed due to last week’s Veteran’s Day holiday.
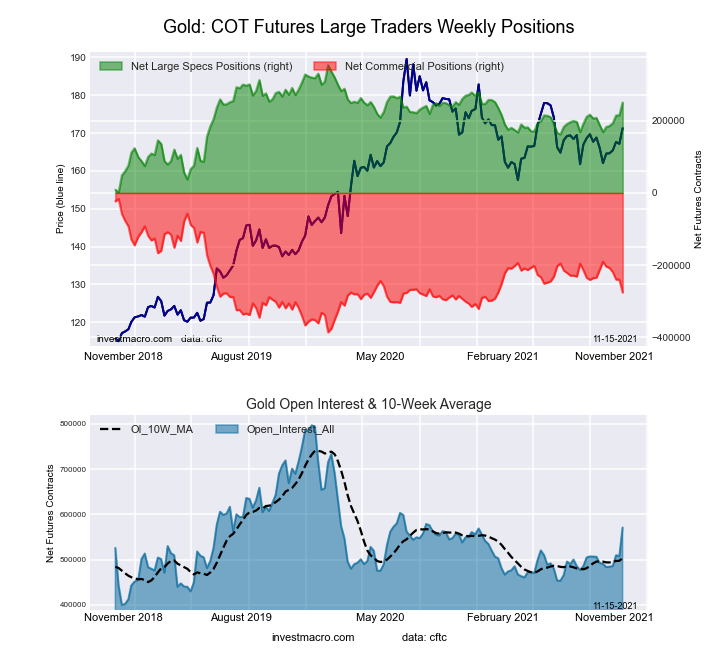
Highlighting this week’s COT data for the metals category is the gains in speculative bets for gold. Speculator positions jumped by over +35,000 net contracts on November 9th and marked the largest one-week increase of the past ninety weeks, dating back to February 2nd of 2020. Speculators have continued pushing their bullishness in the yellow shiny metal as bullish bets have now climbed higher for six consecutive weeks and the gold net positions have increased by a total of +81,782 contracts over that time-frame. The speculator gold standing is currently at the highest level of the past thirty-nine weeks, dating back to February 9th of this year.
| Nov-09-2021 | OI | OI-Index | Spec-Net | Spec-Index | Com-Net | COM-Index | Smalls-Net | Smalls-Index |
|---|---|---|---|---|---|---|---|---|
| WTI Crude | 2,081,385 | 22 | 421,312 | 46 | -461,964 | 44 | 40,652 | 72 |
| Gold | 571,025 | 43 | 250,181 | 71 | -275,489 | 30 | 25,308 | 42 |
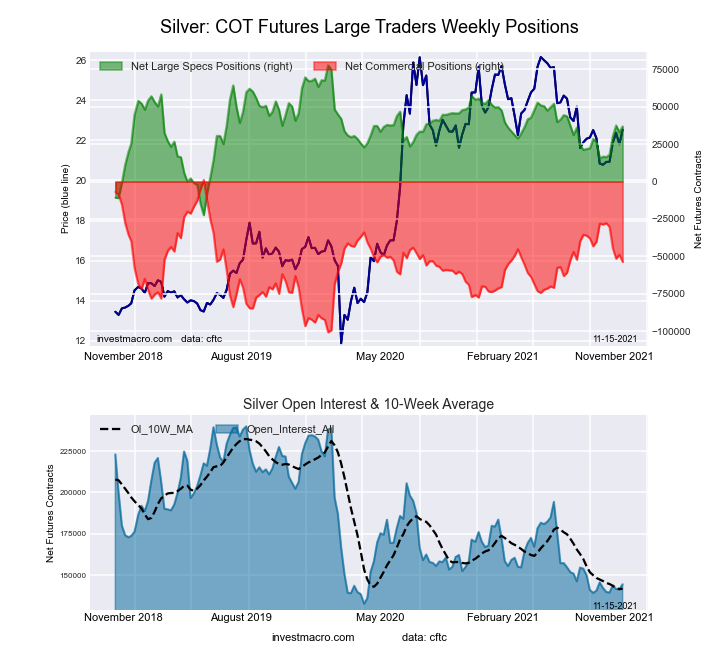
| Silver | 144,370 | 11 | 36,915 | 59 | -53,669 | 46 | 16,754 | 38 |
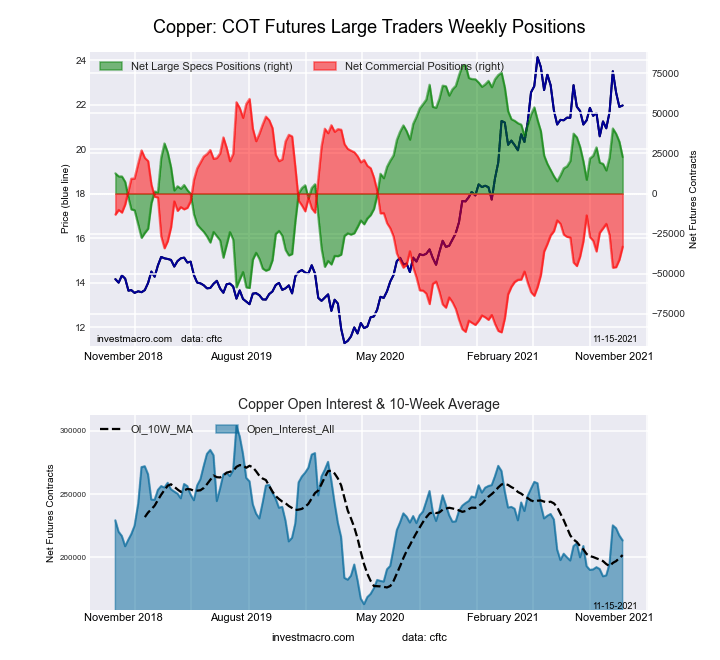
| Copper | 213,365 | 36 | 22,789 | 59 | -33,194 | 37 | 10,405 | 85 |
| Palladium | 11,819 | 24 | -2,954 | 2 | 3,003 | 97 | -49 | 42 |
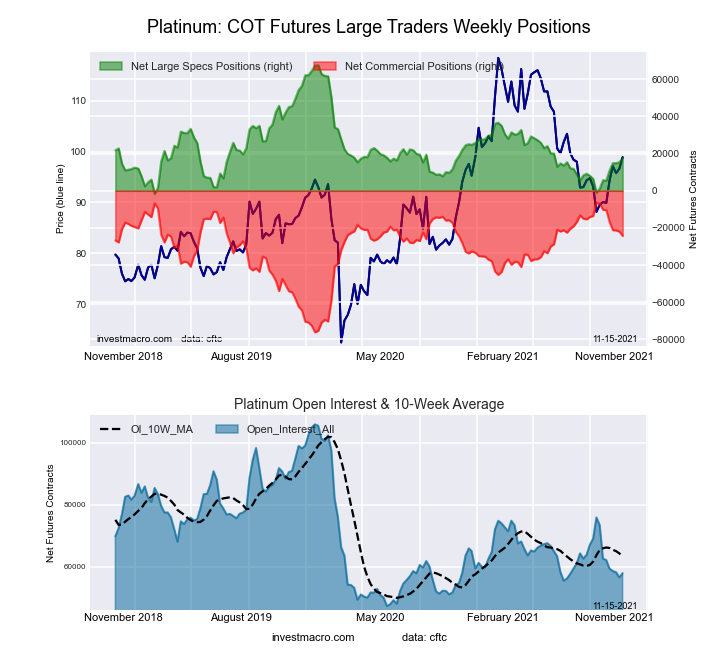
| Platinum | 57,866 | 18 | 17,630 | 28 | -24,263 | 74 | 6,633 | 55 |
| Natural Gas | 1,305,687 | 45 | -142,191 | 36 | 98,418 | 62 | 43,773 | 90 |
| Brent | 192,398 | 33 | -11,851 | 100 | 7,567 | 0 | 4,284 | 82 |
| Heating Oil | 421,299 | 61 | 20,022 | 72 | -42,921 | 26 | 22,899 | 78 |
| Soybeans | 644,317 | 9 | 27,584 | 37 | 9,085 | 68 | -36,669 | 11 |
| Corn | 1,540,731 | 28 | 375,298 | 78 | -320,877 | 26 | -54,421 | 12 |
| Coffee | 312,143 | 67 | 60,820 | 93 | -65,365 | 9 | 4,545 | 20 |
| Sugar | 897,739 | 22 | 212,031 | 80 | -260,761 | 19 | 48,730 | 68 |
| Wheat | 405,438 | 37 | 19,203 | 63 | -13,409 | 28 | -5,794 | 74 |
Free Reports:
This week’s current strength score (the trader positioning range over the past three years, measured from 0 to 100) shows the speculators are currently Bullish with a score of 70.6 percent. The commercials are Bearish with a score of 29.8 percent and the small traders (not shown in chart) are Bearish with a score of 41.6 percent.
| Gold Futures Statistics | SPECULATORS | COMMERCIALS | SMALL TRADERS |
| – Percent of Open Interest Longs: | 59.7 | 18.4 | 8.8 |
| – Percent of Open Interest Shorts: | 15.9 | 66.7 | 4.3 |
| – Net Position: | 250,181 | -275,489 | 25,308 |
| – Gross Longs: | 341,111 | 105,197 | 50,094 |
| – Gross Shorts: | 90,930 | 380,686 | 24,786 |
| – Long to Short Ratio: | 3.8 to 1 | 0.3 to 1 | 2.0 to 1 |
| NET POSITION TREND: | |||
| – COT Index Score (3 Year Range Pct): | 70.6 | 29.8 | 41.6 |
| – COT Index Reading (3 Year Range): | Bullish | Bearish | Bearish |
| NET POSITION MOVEMENT INDEX: | |||
| – 6-Week Change in Strength Index: | 23.2 | -23.1 | 9.2 |
This week’s current strength score (the trader positioning range over the past three years, measured from 0 to 100) shows the speculators are currently Bullish with a score of 59.2 percent. The commercials are Bearish with a score of 46.2 percent and the small traders (not shown in chart) are Bearish with a score of 38.2 percent.
| Silver Futures Statistics | SPECULATORS | COMMERCIALS | SMALL TRADERS |
| – Percent of Open Interest Longs: | 45.0 | 30.3 | 19.7 |
| – Percent of Open Interest Shorts: | 19.5 | 67.5 | 8.1 |
| – Net Position: | 36,915 | -53,669 | 16,754 |
| – Gross Longs: | 65,013 | 43,811 | 28,432 |
| – Gross Shorts: | 28,098 | 97,480 | 11,678 |
| – Long to Short Ratio: | 2.3 to 1 | 0.4 to 1 | 2.4 to 1 |
| NET POSITION TREND: | |||
| – COT Index Score (3 Year Range Pct): | 59.2 | 46.2 | 38.2 |
| – COT Index Reading (3 Year Range): | Bullish | Bearish | Bearish |
| NET POSITION MOVEMENT INDEX: | |||
| – 6-Week Change in Strength Index: | 20.2 | -24.6 | 29.0 |
This week’s current strength score (the trader positioning range over the past three years, measured from 0 to 100) shows the speculators are currently Bullish with a score of 58.8 percent. The commercials are Bearish with a score of 36.6 percent and the small traders (not shown in chart) are Bullish-Extreme with a score of 85.5 percent.
| Copper Futures Statistics | SPECULATORS | COMMERCIALS | SMALL TRADERS |
| – Percent of Open Interest Longs: | 38.8 | 38.6 | 10.0 |
| – Percent of Open Interest Shorts: | 28.1 | 54.2 | 5.1 |
| – Net Position: | 22,789 | -33,194 | 10,405 |
| – Gross Longs: | 82,781 | 82,413 | 21,232 |
| – Gross Shorts: | 59,992 | 115,607 | 10,827 |
| – Long to Short Ratio: | 1.4 to 1 | 0.7 to 1 | 2.0 to 1 |
| NET POSITION TREND: | |||
| – COT Index Score (3 Year Range Pct): | 58.8 | 36.6 | 85.5 |
| – COT Index Reading (3 Year Range): | Bullish | Bearish | Bullish-Extreme |
| NET POSITION MOVEMENT INDEX: | |||
| – 6-Week Change in Strength Index: | 3.0 | -7.9 | 42.0 |
This week’s current strength score (the trader positioning range over the past three years, measured from 0 to 100) shows the speculators are currently Bearish with a score of 27.8 percent. The commercials are Bullish with a score of 74.3 percent and the small traders (not shown in chart) are Bullish with a score of 54.6 percent.
| Platinum Futures Statistics | SPECULATORS | COMMERCIALS | SMALL TRADERS |
| – Percent of Open Interest Longs: | 52.3 | 28.0 | 15.9 |
| – Percent of Open Interest Shorts: | 21.8 | 69.9 | 4.5 |
| – Net Position: | 17,630 | -24,263 | 6,633 |
| – Gross Longs: | 30,260 | 16,202 | 9,224 |
| – Gross Shorts: | 12,630 | 40,465 | 2,591 |
| – Long to Short Ratio: | 2.4 to 1 | 0.4 to 1 | 3.6 to 1 |
| NET POSITION TREND: | |||
| – COT Index Score (3 Year Range Pct): | 27.8 | 74.3 | 54.6 |
| – COT Index Reading (3 Year Range): | Bearish | Bullish | Bullish |
| NET POSITION MOVEMENT INDEX: | |||
| – 6-Week Change in Strength Index: | 17.3 | -20.2 | 29.4 |
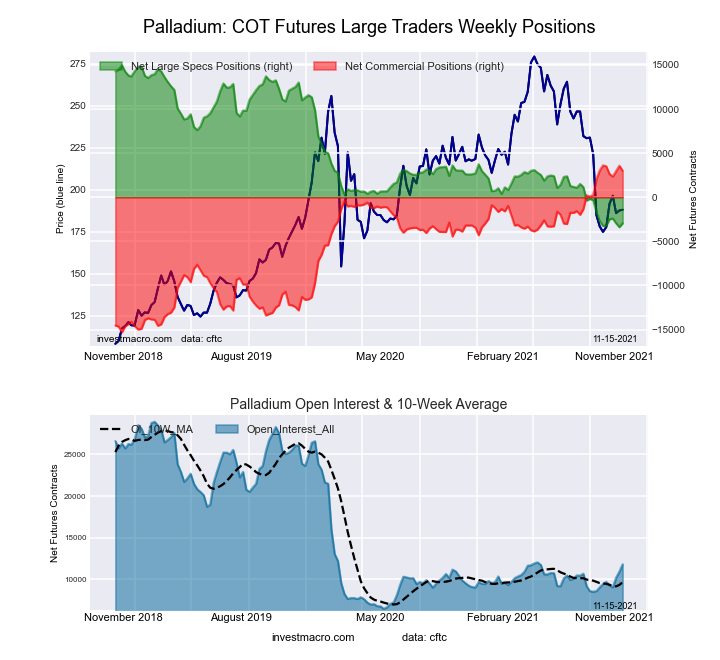
This week’s current strength score (the trader positioning range over the past three years, measured from 0 to 100) shows the speculators are currently Bearish-Extreme with a score of 2.4 percent. The commercials are Bullish-Extreme with a score of 96.8 percent and the small traders (not shown in chart) are Bearish with a score of 41.8 percent.
| Palladium Futures Statistics | SPECULATORS | COMMERCIALS | SMALL TRADERS |
| – Percent of Open Interest Longs: | 22.9 | 50.4 | 12.1 |
| – Percent of Open Interest Shorts: | 47.8 | 25.0 | 12.5 |
| – Net Position: | -2,954 | 3,003 | -49 |
| – Gross Longs: | 2,701 | 5,961 | 1,425 |
| – Gross Shorts: | 5,655 | 2,958 | 1,474 |
| – Long to Short Ratio: | 0.5 to 1 | 2.0 to 1 | 1.0 to 1 |
| NET POSITION TREND: | |||
| – COT Index Score (3 Year Range Pct): | 2.4 | 96.8 | 41.8 |
| – COT Index Reading (3 Year Range): | Bearish-Extreme | Bullish-Extreme | Bearish |
| NET POSITION MOVEMENT INDEX: | |||
| – 6-Week Change in Strength Index: | 1.6 | -3.2 | 18.6 |
Article By InvestMacro – Receive our weekly COT Reports by Email
*COT Report: The COT data, released weekly to the public each Friday, is updated through the most recent Tuesday (data is 3 days old) and shows a quick view of how large speculators or non-commercials (for-profit traders) were positioned in the futures markets.
The CFTC categorizes trader positions according to commercial hedgers (traders who use futures contracts for hedging as part of the business), non-commercials (large traders who speculate to realize trading profits) and nonreportable traders (usually small traders/speculators) as well as their open interest (contracts open in the market at time of reporting).See CFTC criteria here.
By JustMarkets On Tuesday, the US stock indices finished the session in the green, supported…
By Analytical Department RoboForex GBP/USD rose to 1.3403 on Wednesday, with British politics taking centre…
By Analytical Department RoboForex USD/JPY ended Tuesday at 162.27, with the Japanese yen remaining near…
By JustMarkets On Friday, the Dow Jones Index (US30) rose by 0.29% (weekly: -0.36%). The…
By Analytical Department RoboForex EUR/USD opens the week around 1.1433. Investors continue to assess the…
By InvestMacro Here are the latest charts and statistics for the Commitment of Traders (COT)…
This website uses cookies.