By InvestMacro | COT | Data Tables | COT Leaders | Downloads | COT Newsletter
Here are the latest charts and statistics for the Commitment of Traders (COT) data published by the Commodities Futures Trading Commission (CFTC).
The latest COT data is updated through Tuesday November 2nd 2021 and shows a quick view of how large traders (for-profit speculators and commercial entities) were positioned in the futures markets.
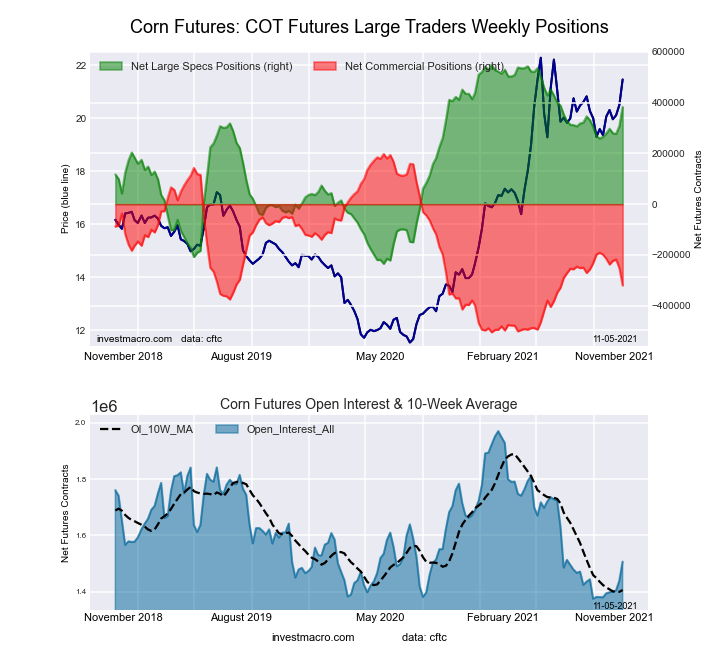
Highlighting this week’s COT Soft Commodity data is once again the rise in speculator positioning for Corn. The speculator bets for Corn jumped by over +75,000 contracts this week following a gain of over +30,000 contracts last week. This marked the largest one-week increase in net positions in a year (November 3rd 2020). Corn is now at the most bullish net speculator level of the past nineteen weeks, dating back to June 22nd.
| Nov-02-2021 | OI | OI-Index | Spec-Net | Spec-Index | Com-Net | COM-Index | Smalls-Net | Smalls-Index |
|---|---|---|---|---|---|---|---|---|
| WTI Crude | 2,121,461 | 29 | 419,293 | 46 | -461,516 | 44 | 42,223 | 75 |
| Gold | 507,616 | 27 | 215,129 | 62 | -239,877 | 38 | 24,748 | 40 |
| Silver | 141,394 | 8 | 33,115 | 55 | -48,860 | 51 | 15,745 | 32 |
| Copper | 217,216 | 39 | 32,335 | 66 | -41,294 | 31 | 8,959 | 77 |
| Palladium | 10,926 | 20 | -3,391 | 0 | 3,574 | 100 | -183 | 34 |
| Platinum | 56,508 | 16 | 15,364 | 25 | -21,964 | 78 | 6,600 | 54 |
| Natural Gas | 1,267,227 | 35 | -137,713 | 37 | 93,517 | 60 | 44,196 | 91 |
| Brent | 183,766 | 27 | -12,714 | 100 | 7,688 | 0 | 5,026 | 79 |
| Heating Oil | 426,636 | 66 | 22,384 | 75 | -45,844 | 22 | 23,460 | 80 |
| Soybeans | 620,172 | 3 | 58,756 | 45 | -19,885 | 61 | -38,871 | 7 |
| Corn | 1,506,602 | 22 | 383,109 | 79 | -320,385 | 26 | -62,724 | 7 |
| Coffee | 310,931 | 66 | 64,353 | 95 | -69,264 | 6 | 4,911 | 22 |
| Sugar | 884,507 | 21 | 209,061 | 80 | -250,849 | 21 | 41,788 | 60 |
| Wheat | 409,137 | 39 | 17,896 | 62 | -11,141 | 30 | -6,755 | 69 |
Free Reports:
This week’s current strength score (the trader positioning range over the past three years, measured from 0 to 100) shows the speculators are currently Bullish with a score of 79.0 percent. The commercials are Bearish with a score of 26.3 percent and the small traders (not shown in chart) are Bearish-Extreme with a score of 7.0 percent.
| CORN Futures Statistics | SPECULATORS | COMMERCIALS | SMALL TRADERS |
| – Percent of Open Interest Longs: | 32.0 | 45.2 | 8.7 |
| – Percent of Open Interest Shorts: | 6.6 | 66.5 | 12.9 |
| – Net Position: | 383,109 | -320,385 | -62,724 |
| – Gross Longs: | 482,734 | 681,554 | 131,645 |
| – Gross Shorts: | 99,625 | 1,001,939 | 194,369 |
| – Long to Short Ratio: | 4.8 to 1 | 0.7 to 1 | 0.7 to 1 |
| NET POSITION TREND: | |||
| – COT Index Score (3 Year Range Pct): | 79.0 | 26.3 | 7.0 |
| – COT Index Reading (3 Year Range): | Bullish | Bearish | Bearish-Extreme |
| NET POSITION MOVEMENT INDEX: | |||
| – 6-Week Change in Strength Index: | 15.0 | -17.3 | 2.2 |
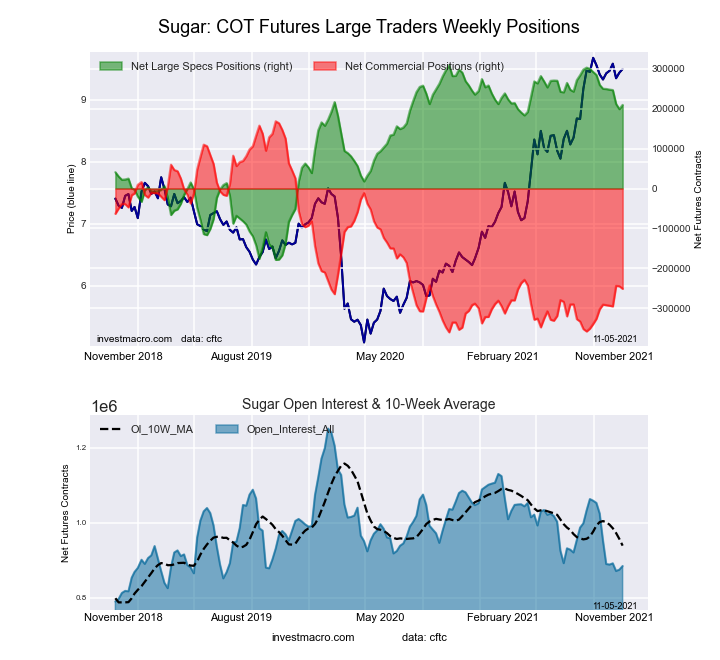
This week’s current strength score (the trader positioning range over the past three years, measured from 0 to 100) shows the speculators are currently Bullish with a score of 79.6 percent. The commercials are Bearish with a score of 20.6 percent and the small traders (not shown in chart) are Bullish with a score of 59.5 percent.
| SUGAR Futures Statistics | SPECULATORS | COMMERCIALS | SMALL TRADERS |
| – Percent of Open Interest Longs: | 30.3 | 44.4 | 10.4 |
| – Percent of Open Interest Shorts: | 6.7 | 72.8 | 5.7 |
| – Net Position: | 209,061 | -250,849 | 41,788 |
| – Gross Longs: | 268,307 | 392,717 | 92,164 |
| – Gross Shorts: | 59,246 | 643,566 | 50,376 |
| – Long to Short Ratio: | 4.5 to 1 | 0.6 to 1 | 1.8 to 1 |
| NET POSITION TREND: | |||
| – COT Index Score (3 Year Range Pct): | 79.6 | 20.6 | 59.5 |
| – COT Index Reading (3 Year Range): | Bullish | Bearish | Bullish |
| NET POSITION MOVEMENT INDEX: | |||
| – 6-Week Change in Strength Index: | -8.3 | 7.5 | 1.1 |
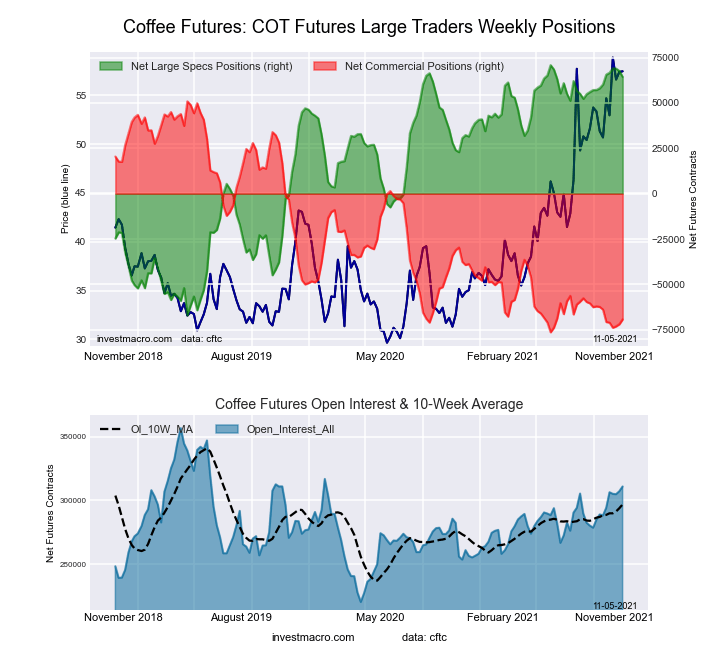
This week’s current strength score (the trader positioning range over the past three years, measured from 0 to 100) shows the speculators are currently Bullish-Extreme with a score of 95.3 percent. The commercials are Bearish-Extreme with a score of 5.5 percent and the small traders (not shown in chart) are Bearish with a score of 22.3 percent.
| COFFEE Futures Statistics | SPECULATORS | COMMERCIALS | SMALL TRADERS |
| – Percent of Open Interest Longs: | 26.8 | 41.6 | 3.8 |
| – Percent of Open Interest Shorts: | 6.2 | 63.9 | 2.2 |
| – Net Position: | 64,353 | -69,264 | 4,911 |
| – Gross Longs: | 83,481 | 129,468 | 11,776 |
| – Gross Shorts: | 19,128 | 198,732 | 6,865 |
| – Long to Short Ratio: | 4.4 to 1 | 0.7 to 1 | 1.7 to 1 |
| NET POSITION TREND: | |||
| – COT Index Score (3 Year Range Pct): | 95.3 | 5.5 | 22.3 |
| – COT Index Reading (3 Year Range): | Bullish-Extreme | Bearish-Extreme | Bearish |
| NET POSITION MOVEMENT INDEX: | |||
| – 6-Week Change in Strength Index: | 3.1 | -4.3 | 8.2 |
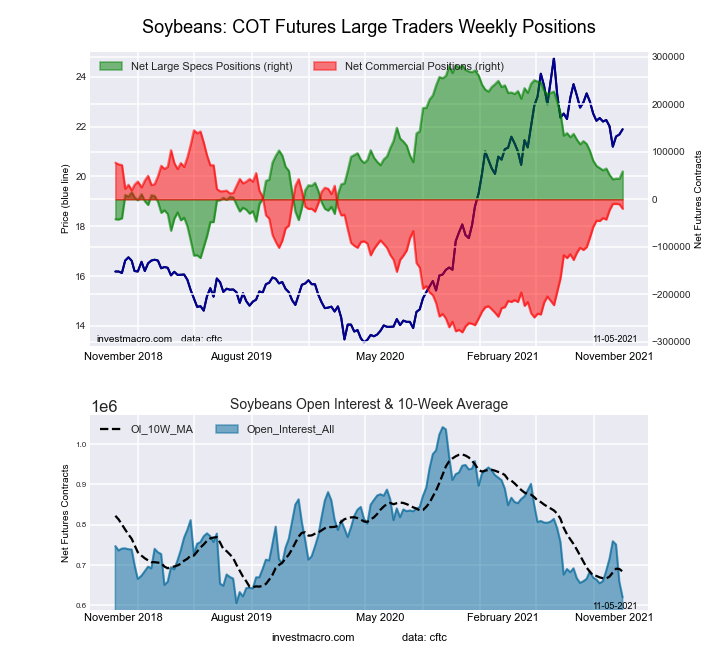
This week’s current strength score (the trader positioning range over the past three years, measured from 0 to 100) shows the speculators are currently Bearish with a score of 44.9 percent. The commercials are Bullish with a score of 61.1 percent and the small traders (not shown in chart) are Bearish-Extreme with a score of 7.2 percent.
| SOYBEANS Futures Statistics | SPECULATORS | COMMERCIALS | SMALL TRADERS |
| – Percent of Open Interest Longs: | 21.9 | 57.7 | 7.0 |
| – Percent of Open Interest Shorts: | 12.4 | 60.9 | 13.3 |
| – Net Position: | 58,756 | -19,885 | -38,871 |
| – Gross Longs: | 135,938 | 357,948 | 43,540 |
| – Gross Shorts: | 77,182 | 377,833 | 82,411 |
| – Long to Short Ratio: | 1.8 to 1 | 0.9 to 1 | 0.5 to 1 |
| NET POSITION TREND: | |||
| – COT Index Score (3 Year Range Pct): | 44.9 | 61.1 | 7.2 |
| – COT Index Reading (3 Year Range): | Bearish | Bullish | Bearish-Extreme |
| NET POSITION MOVEMENT INDEX: | |||
| – 6-Week Change in Strength Index: | -0.6 | 4.6 | -28.6 |
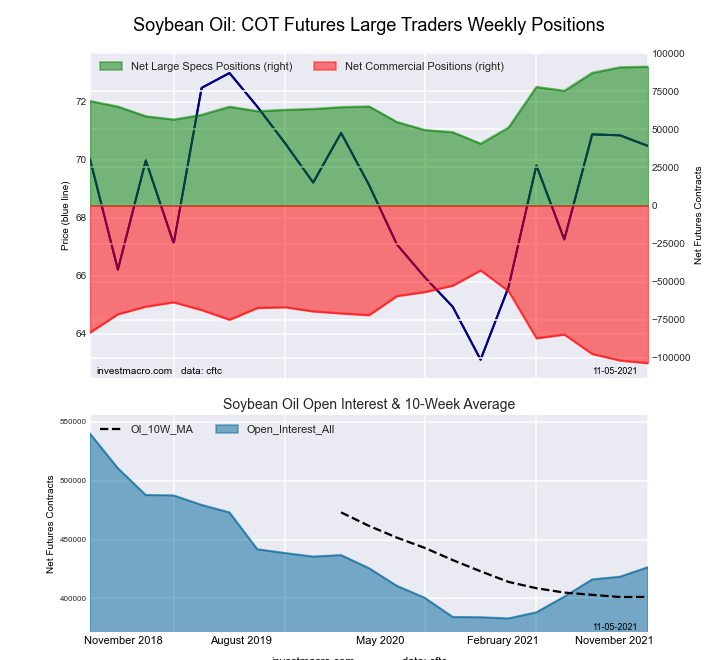
This week’s current strength score (the trader positioning range over the past three years, measured from 0 to 100) shows the speculators are currently Bullish with a score of 73.0 percent. The commercials are Bearish with a score of 28.0 percent and the small traders (not shown in chart) are Bullish with a score of 59.9 percent.
| SOYBEAN OIL Futures Statistics | SPECULATORS | COMMERCIALS | SMALL TRADERS |
| – Percent of Open Interest Longs: | 28.7 | 47.1 | 8.0 |
| – Percent of Open Interest Shorts: | 7.3 | 71.4 | 5.1 |
| – Net Position: | 91,131 | -103,585 | 12,454 |
| – Gross Longs: | 122,221 | 200,754 | 34,050 |
| – Gross Shorts: | 31,090 | 304,339 | 21,596 |
| – Long to Short Ratio: | 3.9 to 1 | 0.7 to 1 | 1.6 to 1 |
| NET POSITION TREND: | |||
| – COT Index Score (3 Year Range Pct): | 73.0 | 28.0 | 59.9 |
| – COT Index Reading (3 Year Range): | Bullish | Bearish | Bullish |
| NET POSITION MOVEMENT INDEX: | |||
| – 6-Week Change in Strength Index: | 27.3 | -30.5 | 38.5 |
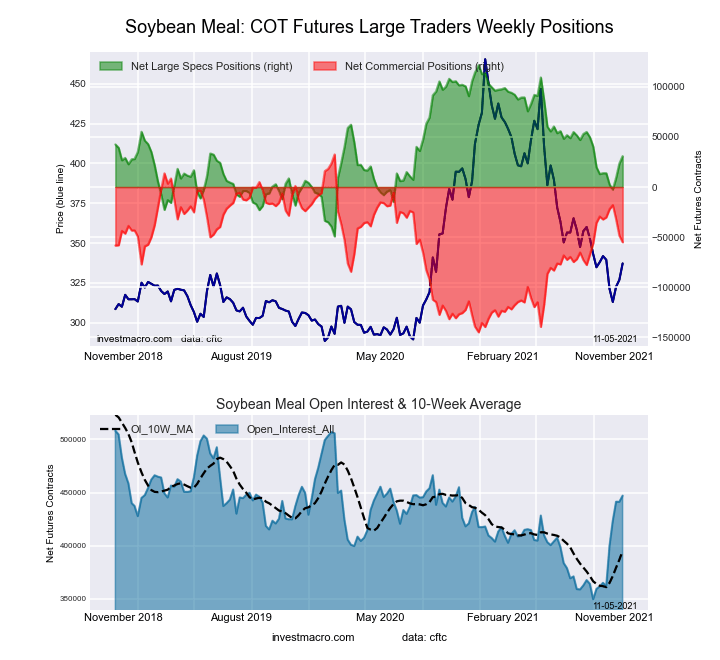
This week’s current strength score (the trader positioning range over the past three years, measured from 0 to 100) shows the speculators are currently Bearish with a score of 46.8 percent. The commercials are Bullish with a score of 50.7 percent and the small traders (not shown in chart) are Bullish with a score of 68.1 percent.
| SOYBEAN MEAL Futures Statistics | SPECULATORS | COMMERCIALS | SMALL TRADERS |
| – Percent of Open Interest Longs: | 21.5 | 46.4 | 12.3 |
| – Percent of Open Interest Shorts: | 14.6 | 58.7 | 6.9 |
| – Net Position: | 30,771 | -55,091 | 24,320 |
| – Gross Longs: | 96,255 | 207,316 | 55,086 |
| – Gross Shorts: | 65,484 | 262,407 | 30,766 |
| – Long to Short Ratio: | 1.5 to 1 | 0.8 to 1 | 1.8 to 1 |
| NET POSITION TREND: | |||
| – COT Index Score (3 Year Range Pct): | 46.8 | 50.7 | 68.1 |
| – COT Index Reading (3 Year Range): | Bearish | Bullish | Bullish |
| NET POSITION MOVEMENT INDEX: | |||
| – 6-Week Change in Strength Index: | 9.9 | -12.8 | 23.1 |
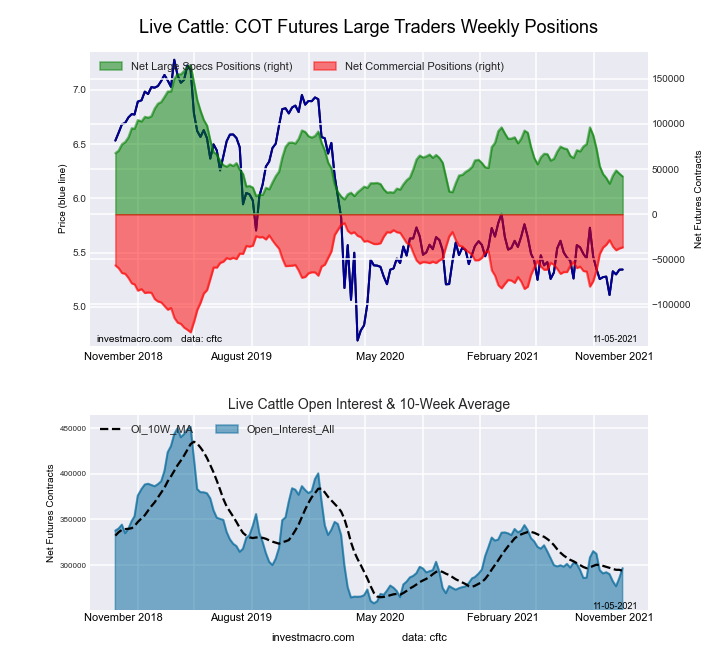
This week’s current strength score (the trader positioning range over the past three years, measured from 0 to 100) shows the speculators are currently Bearish-Extreme with a score of 17.1 percent. The commercials are Bullish with a score of 77.7 percent and the small traders (not shown in chart) are Bullish with a score of 74.5 percent.
| LIVE CATTLE Futures Statistics | SPECULATORS | COMMERCIALS | SMALL TRADERS |
| – Percent of Open Interest Longs: | 31.4 | 40.0 | 10.1 |
| – Percent of Open Interest Shorts: | 17.3 | 52.3 | 11.8 |
| – Net Position: | 41,894 | -36,717 | -5,177 |
| – Gross Longs: | 93,191 | 118,526 | 29,946 |
| – Gross Shorts: | 51,297 | 155,243 | 35,123 |
| – Long to Short Ratio: | 1.8 to 1 | 0.8 to 1 | 0.9 to 1 |
| NET POSITION TREND: | |||
| – COT Index Score (3 Year Range Pct): | 17.1 | 77.7 | 74.5 |
| – COT Index Reading (3 Year Range): | Bearish-Extreme | Bullish | Bullish |
| NET POSITION MOVEMENT INDEX: | |||
| – 6-Week Change in Strength Index: | -1.8 | 0.2 | 6.0 |
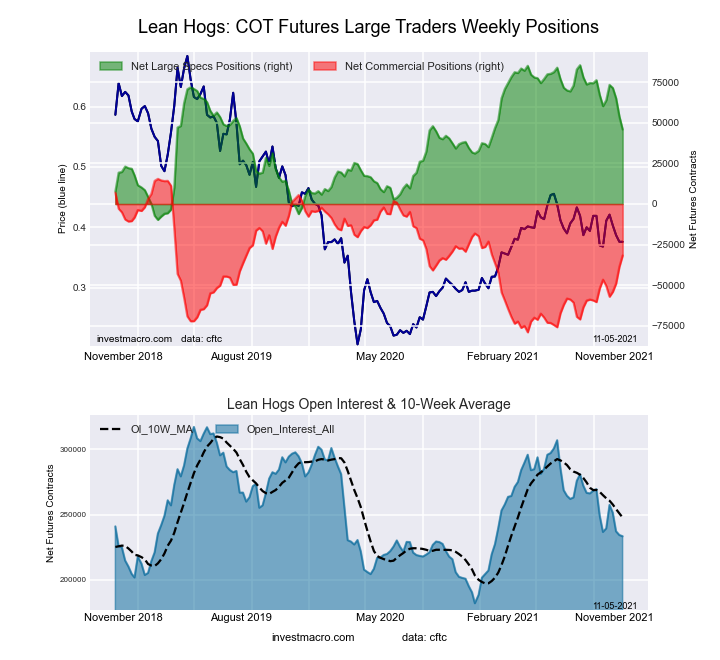
This week’s current strength score (the trader positioning range over the past three years, measured from 0 to 100) shows the speculators are currently Bullish with a score of 58.4 percent. The commercials are Bullish with a score of 50.0 percent and the small traders (not shown in chart) are Bearish-Extreme with a score of 14.5 percent.
| LEAN HOGS Futures Statistics | SPECULATORS | COMMERCIALS | SMALL TRADERS |
| – Percent of Open Interest Longs: | 37.7 | 33.7 | 7.9 |
| – Percent of Open Interest Shorts: | 18.0 | 47.3 | 14.0 |
| – Net Position: | 45,965 | -31,775 | -14,190 |
| – Gross Longs: | 87,929 | 78,627 | 18,449 |
| – Gross Shorts: | 41,964 | 110,402 | 32,639 |
| – Long to Short Ratio: | 2.1 to 1 | 0.7 to 1 | 0.6 to 1 |
| NET POSITION TREND: | |||
| – COT Index Score (3 Year Range Pct): | 58.4 | 50.0 | 14.5 |
| – COT Index Reading (3 Year Range): | Bullish | Bullish | Bearish-Extreme |
| NET POSITION MOVEMENT INDEX: | |||
| – 6-Week Change in Strength Index: | -15.1 | 15.7 | -2.2 |
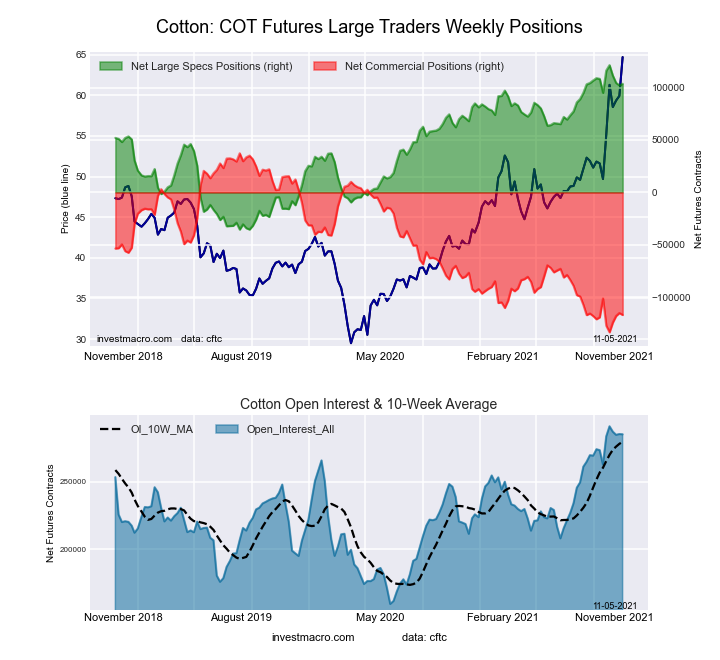
This week’s current strength score (the trader positioning range over the past three years, measured from 0 to 100) shows the speculators are currently Bullish-Extreme with a score of 88.7 percent. The commercials are Bearish-Extreme with a score of 9.7 percent and the small traders (not shown in chart) are Bullish-Extreme with a score of 96.3 percent.
| COTTON Futures Statistics | SPECULATORS | COMMERCIALS | SMALL TRADERS |
| – Percent of Open Interest Longs: | 40.3 | 37.1 | 7.7 |
| – Percent of Open Interest Shorts: | 3.9 | 78.1 | 3.1 |
| – Net Position: | 103,553 | -116,804 | 13,251 |
| – Gross Longs: | 114,770 | 105,723 | 22,064 |
| – Gross Shorts: | 11,217 | 222,527 | 8,813 |
| – Long to Short Ratio: | 10.2 to 1 | 0.5 to 1 | 2.5 to 1 |
| NET POSITION TREND: | |||
| – COT Index Score (3 Year Range Pct): | 88.7 | 9.7 | 96.3 |
| – COT Index Reading (3 Year Range): | Bullish-Extreme | Bearish-Extreme | Bullish-Extreme |
| NET POSITION MOVEMENT INDEX: | |||
| – 6-Week Change in Strength Index: | 5.4 | -9.2 | 44.3 |
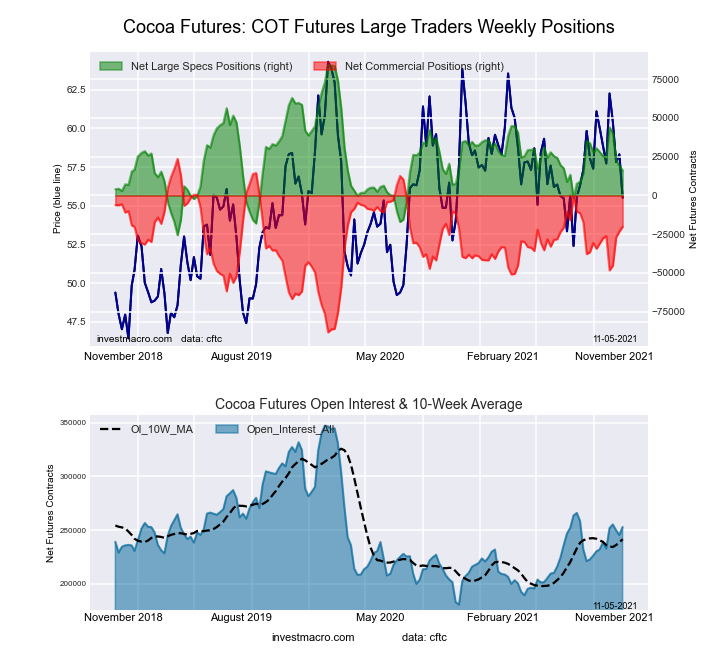
This week’s current strength score (the trader positioning range over the past three years, measured from 0 to 100) shows the speculators are currently Bearish with a score of 38.0 percent. The commercials are Bullish with a score of 60.9 percent and the small traders (not shown in chart) are Bullish with a score of 54.6 percent.
| COCOA Futures Statistics | SPECULATORS | COMMERCIALS | SMALL TRADERS |
| – Percent of Open Interest Longs: | 24.4 | 52.8 | 4.7 |
| – Percent of Open Interest Shorts: | 18.0 | 60.7 | 3.1 |
| – Net Position: | 16,074 | -20,130 | 4,056 |
| – Gross Longs: | 61,609 | 133,483 | 11,792 |
| – Gross Shorts: | 45,535 | 153,613 | 7,736 |
| – Long to Short Ratio: | 1.4 to 1 | 0.9 to 1 | 1.5 to 1 |
| NET POSITION TREND: | |||
| – COT Index Score (3 Year Range Pct): | 38.0 | 60.9 | 54.6 |
| – COT Index Reading (3 Year Range): | Bearish | Bullish | Bullish |
| NET POSITION MOVEMENT INDEX: | |||
| – 6-Week Change in Strength Index: | -8.5 | 6.7 | 21.3 |
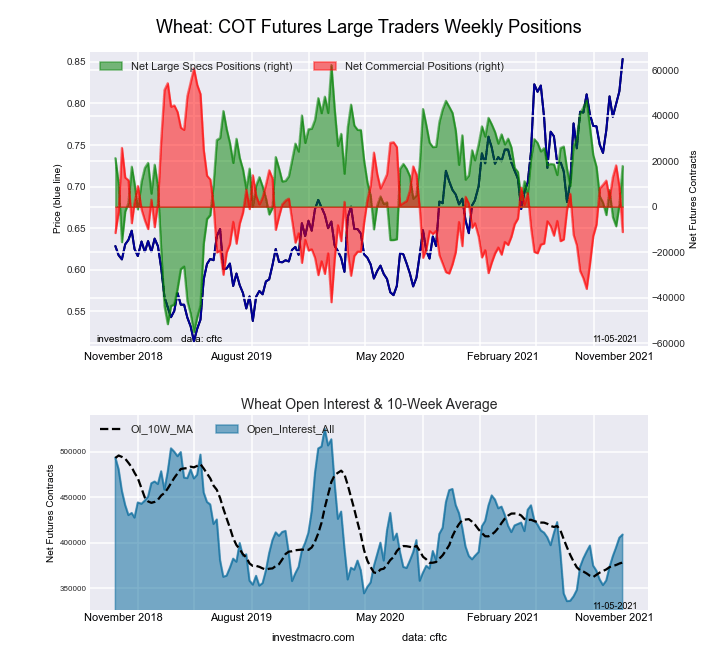
This week’s current strength score (the trader positioning range over the past three years, measured from 0 to 100) shows the speculators are currently Bullish with a score of 62.3 percent. The commercials are Bearish with a score of 30.0 percent and the small traders (not shown in chart) are Bullish with a score of 69.3 percent.
| WHEAT Futures Statistics | SPECULATORS | COMMERCIALS | SMALL TRADERS |
| – Percent of Open Interest Longs: | 26.8 | 34.7 | 8.9 |
| – Percent of Open Interest Shorts: | 22.5 | 37.4 | 10.5 |
| – Net Position: | 17,896 | -11,141 | -6,755 |
| – Gross Longs: | 109,768 | 141,984 | 36,283 |
| – Gross Shorts: | 91,872 | 153,125 | 43,038 |
| – Long to Short Ratio: | 1.2 to 1 | 0.9 to 1 | 0.8 to 1 |
| NET POSITION TREND: | |||
| – COT Index Score (3 Year Range Pct): | 62.3 | 30.0 | 69.3 |
| – COT Index Reading (3 Year Range): | Bullish | Bearish | Bullish |
| NET POSITION MOVEMENT INDEX: | |||
| – 6-Week Change in Strength Index: | 13.7 | -20.2 | 22.6 |
Article By InvestMacro – Receive our weekly COT Reports by Email
*COT Report: The COT data, released weekly to the public each Friday, is updated through the most recent Tuesday (data is 3 days old) and shows a quick view of how large speculators or non-commercials (for-profit traders) were positioned in the futures markets.
The CFTC categorizes trader positions according to commercial hedgers (traders who use futures contracts for hedging as part of the business), non-commercials (large traders who speculate to realize trading profits) and nonreportable traders (usually small traders/speculators) as well as their open interest (contracts open in the market at time of reporting).See CFTC criteria here.
By JustMarkets The US stock indices ended Friday’s session in the red. By the end…
By Analytical Department RoboForex USD/JPY opens the week at 162.36 on Monday. The Japanese yen…
By InvestMacro Here are the latest charts and statistics for the Commitment of Traders (COT)…
By InvestMacro The latest update for the weekly Commitment of Traders (COT) report was released…
By InvestMacro Here are the latest charts and statistics for the Commitment of Traders (COT)…
By InvestMacro Here are the latest charts and statistics for the Commitment of Traders (COT)…
This website uses cookies.