Oil Ready to Go Higher Amid Growth Drivers

By Dmitriy Gurkovskiy, Chief Analyst at RoboForex

Early in the last week of June, Brent continues rising. On Monday, the asset is trading at $76.10 and may easily go higher. There are at least two drivers for this.

The first driver is an unbridled enthusiasm of investors, who believe in extremely active global demand for energies as the world’s economies continue recovering. It is indeed the case but there won’t be a V-shaped growth – every country is fighting the pandemic in its own rhythm, which depends on a lot of factors, that’s why the demand for energies may grow inconsistently.

The second factor that supports bulls lies in a possible supply shortage, which may be 2.5-3 million barrels per day. In this case, it’s quite clear why oil has been rising for five weeks in a row.

In this light, it will be very interesting to follow the July meeting of OPEC+, where they may once again discuss possible expansions of the oil extraction.

In the H4 chart, after breaking 74.45 to the upside, Brent is still forming the ascending wave and may soon reach 76.35. Later, the market may correct to test 74.45 from above and then resume trading within the uptrend with the target at 78.00. From the technical point of view, this scenario is confirmed by MACD Oscillator: its signal line is moving below 0 and may re-enter the histogram area, thus confirming a further uptrend on the price chart.

As we can see in the H1 chart, after rebounding from 74.45, Brent continues trading upwards and forming the third ascending structure towards 76.53. After that, the instrument may correct to return to 74.45 and then resume trading upwards with the target at 77.50. From the technical point of view, this idea is confirmed by the Stochastic Oscillator: after returning to 20, its signal line is expected to rebound and resume growing to break 50. Later, the indicator may continue moving towards 80.

Disclaimer

Any forecasts contained herein are based on the author’s particular opinion. This analysis may not be treated as trading advice. RoboForex bears no responsibility for trading results based on trading recommendations and reviews contained herein.

The US Federal Reserve and the ECB continue to actively print money. The situation in the financial markets remains unchanged.

by JustForex

The US Personal Consumption Price Index (PCE) excluding food and energy components increased 0.5% after rising 0.7% in April. The American economy is on the rise, but labor market data remains the weak link of this dynamics. With the gradual economy open, inflation has begun to slow, but some sectors are still struggling to recover. However, analysts are confident that the situation should improve significantly by the fall. Especially because the bipartisan infrastructure development bill for $1.2 trillion was adopted last week.

Almost all European stock indexes increased on Friday, except French CAC 40, which fell by 0.12%. The fundamental picture in Western Europe is positive. With the growth rate of vaccination, business activity in the Eurozone has moved sharply upward. Inflation data will be released this week on Wednesday, which is directly related to the ECB monetary policy.

Compared to Friday, the situation on gold is almost unchanged. Gold and silver are now trading in a range. But the fundamental picture shows that precious metals will grow. However, it is worth keeping a close eye on US Treasury yields, which have an inverse correlation to gold.

OPEC+ countries will hold an official meeting this week on Thursday. Analysts expect production to increase as demand for fuel soars during the summer season. Oil prices hit another 2-year high on Friday. The technical analysis shows that the price of “black gold” reached the weekly resistance, so the price may consolidate for a while before it continues growing.

The Asian market is highly correlated with the US market at the moment. But investors are very concerned about a surge of coronavirus infection in some Asian countries. First of all, it’s Australia, Indonesia, Malaysia and Thailand. The Hong Kong Stock Exchange said Monday that the trading session in the stock markets had been postponed because of a “black rainstorm” warning.

Main market quotes:

S&P 500 (F) 4,280.70 +14.21 (+0.33%)

Dow Jones 34,433.84 +237.02 (+0.69%)

DAX 15,607.97 +18.74 (+0.12%)

FTSE 100 7,136.07 +26.10 (+0.37%)

USD Index 91.81 0.00 (0.00%)

There are no important events today.

by JustForex


This article reflects a personal opinion and should not be interpreted as an investment advice, and/or offer, and/or a persistent request for carrying out financial transactions, and/or a guarantee, and/or a forecast of future events.

Intraday Market Analysis – EUR Seeks Rebound Opportunity

By Orbex

EURUSD hovers under psychological resistance

EURUSD

The euro bounced back after the core PCE of the US stayed subdued in May.

After rallying above 1.1910, price action has turned this former resistance into a support base. The current consolidation could be an accumulation phase for the buy-side.

Early bulls are aiming at the psychological level of 1.2000. A bullish breakout would force sellers to unwind their positions and trigger a recovery above 1.2100.

In the meantime, buyers could be getting involved while the RSI is in the neutral area.

GBPJPY tumbles from supply zone

GBPJPY

The sterling continues to suffer from BOE’s warning against “premature tightening”.

The pair has met stiff selling pressure in the supply zone around 155.20, a major resistance from the daily chart. The sell-off has accelerated after the support at 154.20 failed to hold.

The subsequent drop below 154.00 was a confirmation of the bearish MA cross. 154.50 has become a resistance. 153.10 is the next support as the RSI bounces off an oversold situation. Below that, the price may retrace all the way back to 152.00.

US 30 breaks above multiple resistances

Dow Jones

The Dow Jones recouped recent losses as investors’ buy-in for Biden’s infrastructure deal.

The bulls have successfully pushed past 34100 then 34350. This indicates that the lack of selling interest has helped buyers regain the upper hand.

Momentum traders seem unfazed by an overbought RSI so far. The index is heading towards 34750, a supply zone from the previous sell-off. A bullish breakout would open the door to the peak at 34850.

On the downside, the psychological level of 34000 has turned into a key support.

By Orbex

Key events this week: Brent oil awaits OPEC+ decision, NFP may dictate USD’s next move

By Han Tan Market Analyst, ForexTime

As we get ready to enter the second half of the year, here are the major events over the coming days that carry enough weight to influence various asset classes:

Monday, June 28

  • Fed speak: New York Fed President John Williams
  • European Commission’s summer economic forecasts

Tuesday, June 29

  • Fed speak: Richmond Fed President Thomas Barkin
  • ECB President Christine Lagarde speech
  • Germany CPI
  • Eurozone economic confidence
  • US consumer confidence

Wednesday, June 30

  • UK GDP
  • Germany unemployment
  • Eurozone CPI
  • US ADP jobs

Thursday, July 1

  • China Caixin manufacturing PMI
  • OPEC+ meeting
  • BOE Governor Andrew Bailey speech
  • Eurozone unemployment
  • Manufacturing PMI: US, Eurozone, UK

Friday, July 2

  • ECB President Christine Lagarde speech
  • Eurozone PPI
  • US nonfarm payrolls


Commodities spotlight: Brent oil

OPEC+ is set to make another key decision on 1 July: whether or not to pump out more oil in August.

Analysts surveyed by Bloomberg expect the cartel to raise their collective output levels by another 550,000 barrels per day (bpd) in August. However, even such a hike is expected to leave global markets in a deficit, which could translate into more upside for oil prices.

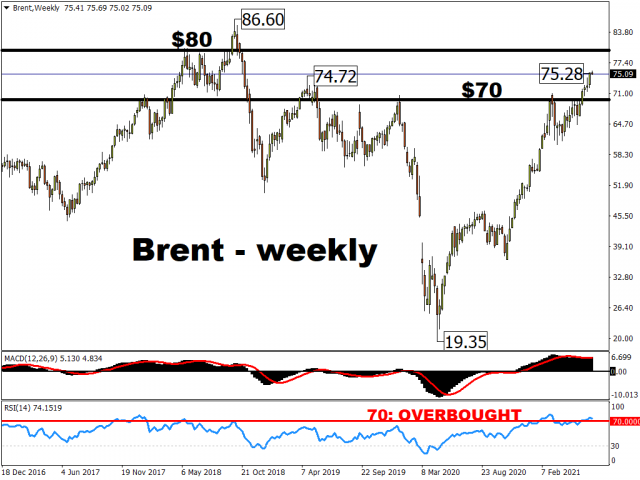
As things stand, Brent prices are trading at their highest levels since October 2018. However, judging by its relative strength index, which has crossed the 70 mark to indicate overbought levels, Brent appears ripe for an adjustment in the near-term. Such a pullback would then clear some of the froth to pave the way higher for Brent oil.

However, the uncertainty over the US-Iran nuclear talks still looms over Thursday’s meeting. A US-Iran nuclear deal could see Iran resuming oil exports and upsetting the cartel’s supply plans. It remains to be seen how OPEC+ continues restoring its supplies into the world while taking into account this wildcard.

Still, come Thursday, a smaller-than-expected output hike of fewer than 550,000 barrels per day in August could send Brent prices even higher and closer to the psychologically-important $80/bbl mark.


Strike three for US nonfarm payrolls?

The US nonfarm payrolls has disappointed markets for the past two straight months. As things stand, economists are forecasting 700,000 jobs were added in the US labour market this month. If so, that would the highest NFP print in three months, since the March figures.

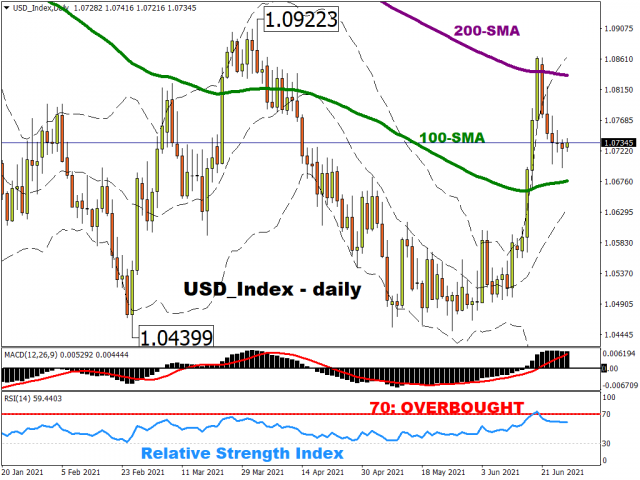
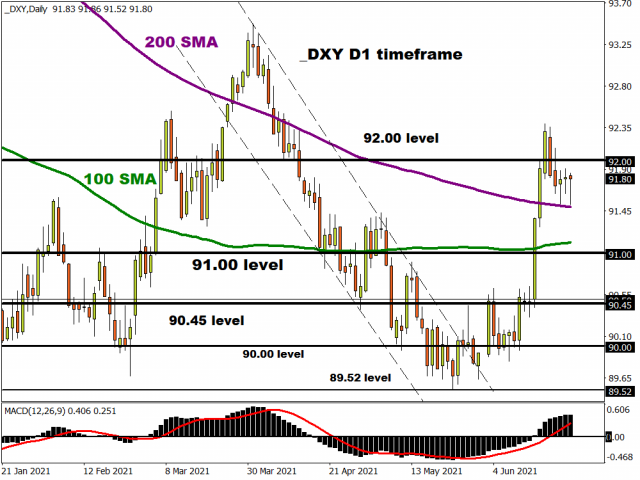
In the leadup to that tier-1 economic release, this USD index, which is an equally-weighted index comprising 6 major currency pairs, has settled into a more “normal” conditions since pulling back from overbought levels.

However, another lackluster NFP print could give the Fed more runway before having to ease up on its asset purchases, which could prompt the greenback to unwind more of its recent gains and test its 100-day simple moving average (SMA) as the next support level.

Still, the greenback could be jolted by another US jobs shocker this Friday.

A June hiring surge in the US could ramp up expectations for the Fed’s tapering once more. Such a narrative could call upon this USD index’s 200-day SMA as a key resistance level once more.


Disclaimer: The content in this article comprises personal opinions and should not be construed as containing personal and/or other investment advice and/or an offer of and/or solicitation for any transactions in financial instruments and/or a guarantee and/or prediction of future performance. ForexTime (FXTM), its affiliates, agents, directors, officers or employees do not guarantee the accuracy, validity, timeliness or completeness, of any information or data made available and assume no liability as to any loss arising from any investment based on the same.


Forex-Time-LogoArticle by ForexTime

ForexTime Ltd (FXTM) is an award winning international online forex broker regulated by CySEC 185/12 www.forextime.com

Bitcoin: “Crowded Trades” Can End Badly. Here’s How to Spot One.

Cryptos can hugely reward, yet just as swiftly — punish

By Elliott Wave International

The phrase “bank run” tends to conjure up images of the 1930’s Great Depression.

However, that phrase is now applicable to the 2021 world of cryptos.

This is from a June 17 coindesk.com article:

A near-total collapse in the price of a share token of a decentralized finance (DeFi) protocol was “the world’s first large-scale crypto bank run,” the people behind Iron Finance said in a blog post providing a postmortem. The run brought the worth of the protocol down from $2 billion to near zero on [June 16].

It all started when “a series of large holders tried to redeem their IRON tokens and sell their iron titanium (TITAN), the token of the Iron Protocol.” In other words, a lot of people were headed for the exit door at the same time.

Of course, that has a parallel to a “bank run,” when throngs of depositors want to take their money out of the bank all at once.

So, like with other exceptionally volatile markets, cryptos can hugely reward, but just as quickly — punish.

Indeed, the June Global Market Perspective, an Elliott Wave International monthly publication which provides forecasts for 50+ worldwide markets, showed this chart and said:

So-called altcoins, dash, litecoin and ethereum, rallied until May 7, May 10 and May 12, respectively. Then they crashed. Various other indicators also pressed on. According to a Bank of America monthly survey, fund managers were never as enamored with bitcoin as they were in the first few days of May. The result of its poll of 194 managers showed that bitcoin was the “most crowded trade,” with 43% saying they were long bitcoin.

Mind you, this chart published on May 28 and you probably know that cryptocurrency volatility has persisted since.

The question now is: What’s next for cryptocurrencies?

Well, here’s commentary from the June 11 U.S. Short Term Update, a thrice weekly Elliott Wave International publication which offers near-term analysis for key U.S. financial markets, that might surprise you:

Decentralized finance and cryptocurrencies may be the wave of the future, but the odds are low that it will be led by bitcoin, or even include it. Investors have come to view the current conditions as normal, but they’re anything but.

You can find our latest commentary on cryptocurrencies, plus Elliott wave analysis, in our Global Market Perspective.

And, speaking of Elliott wave analysis, if you’d like to learn how the Elliott wave model can help you as an investor or trader, you are encouraged to read Frost & Prechter’s book, Elliott Wave Principle: Key to Market Behavior. Here’s a quote:

No matter what your convictions, it pays never to take your eyes off what is happening in the wave structure in real time. Ultimately, the market is the message, and a change in behavior can dictate a change in outlook. All one really needs to know at the time is whether to be long, short or out, a decision that can sometimes be made with a swift glance at a chart and other times only after painstaking work.

Good news! You can read the entire online version of this Wall Street classic for free!

That’s right — all’s that required for free access is a Club EWI membership, which is also free. Club EWI is the world’s largest Elliott wave educational community and allows members free access to a wealth of Elliott wave resources on investing and trading.

Just follow this link to get started: Elliott Wave Principle: Key to Market Behavior — free and instant access.

This article was syndicated by Elliott Wave International and was originally published under the headline Bitcoin: “Crowded Trades” Can End Badly. Here’s How to Spot One.. EWI is the world’s largest market forecasting firm. Its staff of full-time analysts led by Chartered Market Technician Robert Prechter provides 24-hour-a-day market analysis to institutional and private investors around the world.

What Is So Appealing About A Get Rich Quick Scheme When The Odds Are Never In Our Favor?

By TheTechnicalTraders

Who doesn’t want to be rich? Money can afford you all manner of luxuries, including the best one of all: quitting your day job for a carefree and financially independent lifestyle. There are plenty of reliable ways to get rich slowly. Consistently adding to a diversified, passive portfolio is probably the most reliable way, but this can take years and years and years. What’s more, you could see your portfolio get set back a decade or so when the market inevitably melts down. This is where the get rich quick scheme comes into play. I’m sure you’ve seen advertisements say something like this:

“How to build wealth fast with these easy steps.”

“This one simple trick will make you millions.”

“Get out of the rat race today and follow my wealth building advice.”

What is a Get Rich Quick Scheme and Why People Find them Appealing?

These are examples of the classic get rich quick scheme. Many suspect “marketeers” have been selling hopes and dreams to the uninformed for years, and it’s the same story over and over again. The promise of huge returns on only a small initial investment. These incredible, easy to achieve returns will turn your life around, make everything ok, and fill the hole in your soul. Or so they say.

Throughout history, people young and old have fallen for these advertisements and as such, get rich quick schemes have been around for at least a few hundred years. Once upon a time, in 1821 to be precise, there was a Scottish explorer that famously scammed hopeful investors with the newly discovered rich and bountiful land of Poyais. The country was filled with gold and fertile soil, or so he said. UK investors were taken in by the prospect and promise of this new land and quickly lined the pockets of the Scottish explorer with their hard-earned money. There was only one problem – Poyais didn’t exist. Get rich quick schemes like this are a time-honored tale.

Why options are not a get rich quick scheme

Unless you have been hiding under a rock, retail traders today have been publicly sharing immense returns on the internet for the last few years – sometimes posting returns in the 1000s of percent over the course of just a few days. These lucky few primarily buy short-dated out-of-the-money options hoping for a big move in the underlying. When they win big they post their returns on the internet. Many traders might think: “well why couldn’t I do that?”. This guy managed to make one million dollars and can quit his job! He got rich quick!”

Sign up for my free trading newsletter so you don’t miss the next opportunity!

This kind of return is not so dissimilar to your typical run of the mill get rich quick scheme. Everyone needs to keep in mind that buying options contracts in this way is intensely risky, and the probability that you’ll win big is very small. Most people that buy options – especially these short-dated OTM options – will lose. In this way, for every person you see scoring huge returns, there are a thousand others that lost everything.

Options contracts can be used for a huge multitude of different reasons, and gambling can be one of them. I’ll leave you with this: always be skeptical of those that claim you can get rich quick buying “just” options contracts. If you fall for that, you’ll likely end up no different than the investors of Poyais – empty-handed.  We at The Technical Traders OTS teach methods that are not get-rich-quick and we do both selling and buying of options.  Stay small and profit while minimizing risk is our goal.

If you want to learn more about how to trade options, about how to take all factors of options pricing into consideration, and about how to account for volatility in your options trading, please look into our Options Trading Signals.  We send trade alerts out weekly and do daily updates on our positions as to why we got in and out along with the factors to our strategies.  We trade proprietary strategies you will not find anywhere else.  Our goal is to make the market work for us and not try to work the market like everyone else.

You owe it to yourself to have the best tools and subject matter experts on had to ensure you are set up for ultimate success.  Don’t trade with one hand behind your back. Rather, expedite your learning curve with the Options Trading newsletter service.

Have a wonderful weekend!

Chris Vermeulen
Founder & Chief Market Strategist

TheTechnicalTraders.com

Week In Review: Fed’s Mixed Messages, Oil Rallies, Biden’s Infrastructure Deal

By Lukman Otunuga Research Analyst, ForexTime

It was a week defined by speeches from numerous Federal Reserve officials and Jerome Powell’s testimony before Congress.

Monday kicked off on a positive note as markets took a big breath and regathered their thoughts after the Fed’s hawkish surprise last week. King Dollar entered the week on a shaky note, dipping back below 92.00 while gold attempted to nurse its deep wounds.

Things started getting interesting on Monday evening as the first batch of Fed speakers entered the spotlight. Dallas Fed President Robert Kaplan favoured tapering “sooner rather than later” while St. Louis Fed President James Bullard said the Fed needs to be prepared to face upside risks to inflation. However, New York Fed President John Williams said he expected inflation to drop back towards the Fed’s longer-run goal.

Equity markets pushed higher on Tuesday thanks to dovish commentary from Fed officials including Chairman Jerome Powell. In written remarks prepared for his testimony before Congress, he reiterated that the recent jump in inflation would prove transitory.

In other news, the Eurozone consumer confidence flash survey rose by 1.8 points from a month earlier to -3.3 in June – its highest level since January 2018.

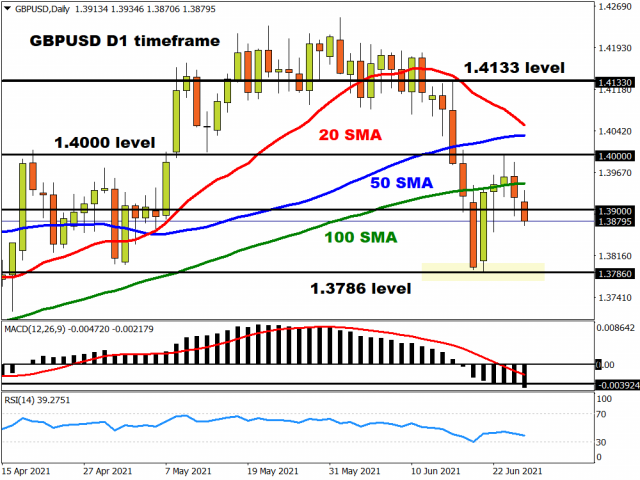
Our trade of the week was the British Pound. We questioned whether the Bank of England would deliver a hawkish surprise after the Fed’s surprise pivot last week. After being beaten black and blue last week, the GBPUSD staged a sharp rebound on Monday with prices trading around the 100-day Simple Moving Average before the BoE decision.

On Tuesday evening, Chair Jerome Powell struck a more cautious tone during his testimony before the House Select Subcommittee on the Coronavirus Crises. Powell reiterated the view that higher inflation would be transitory and how the Fed was nowhere near hiking interest rates. Equity bulls rejoiced on this dovish rhetoric with the Nasdaq rallying to fresh record highs.

Mid-week more Fed speakers were under the spotlight. Atlanta Fed President Raphael Bostic and Fed Governor Michelle Bowman both said that they believed the current price pressure could be temporary. However, they added it could remain higher for longer than expected. Federal Reserve Bank of Boston President Eric Rosengren expected inflation to come down and return close to the Fed’s 2% target going into next year.

In the commodities arena, Brent futures surpassed $76.00 this week – reaching their highest levels since October 2018. Oil bulls remain in a position of power as demand continues to outstrip supply. The reopening of economies has fuelled expectations over rising fuel demand while stalled nuclear talks between the US and Iran continue to soothe concerns over Iranian supplies returning to the markets. WTI Crude has gained over 52% since the start of 2021 while Brent is trailing behind appreciating roughly 47%.

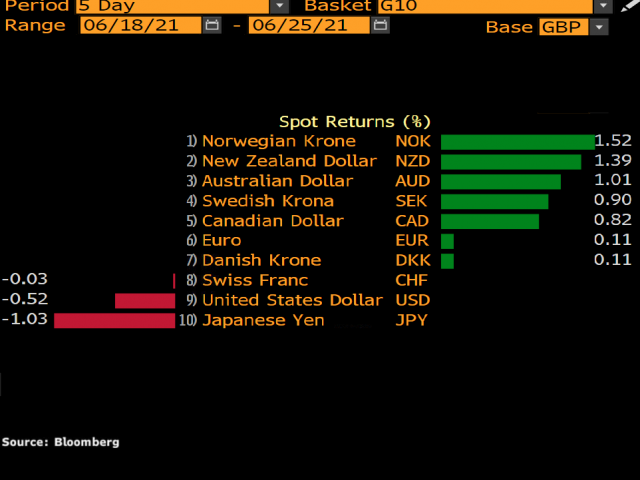
All eyes were on the Bank of England on Thursday. Investors who were expecting more hawks to join the policy discussion were left-empty handed. As widely expected, the central bank left interest rates unchanged while a majority voted to maintain asset purchases at the current level of $895 billion. The British Pound depreciated after the BoE decision with prices trading below 1.3900 as of writing. Sterling has weakened against most G10 currencies this week excluding the dollar and Japanese Yen.

Global stocks mostly rose on Friday, boosted by a rally on Wallstreet overnight after US President Joe Biden announced a bipartisan infrastructure deal. Equity bulls derived further strength from the weaker than expected inflation data which eased worries about monetary policy tightening in the near term.

The May core personal consumption expenditures (PCE) price index rose 3.4% from a year ago. Although this was the biggest increase since 1992, it was in line with market expectations. The PCE index rose 3.9% year-over-year – also in line with market forecasts. For the month, the core index rose 0.5% which was below the 0.6% estimate while the one including volatile food and energy prices rose 0.4% for the month – below the 0.5% estimate.

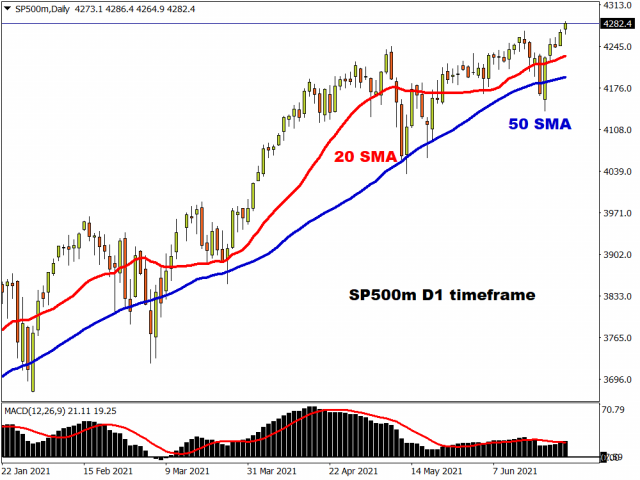
The S&P 500 hit a fresh record high on Friday and is on route to concluding the week roughly 2.8% higher.

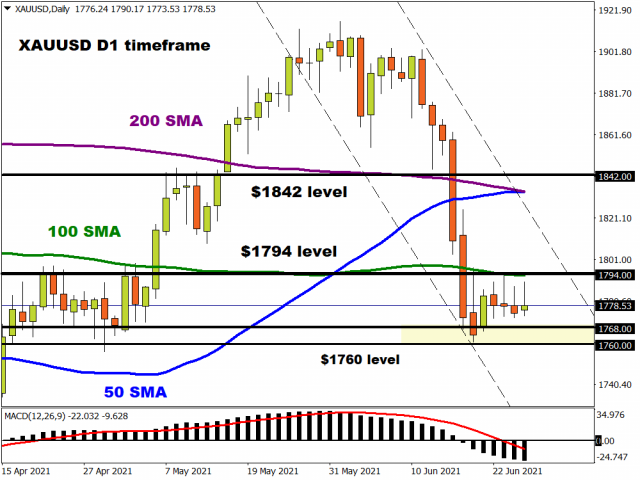
Let’s not forget about gold. The precious metal has struggled to nurse the deep wounds inflicted from last week’s brutal selloff. Gold remains trapped within a range with support around $1760-$1768 and resistance at $1794 which is where the 100-day Simple Average resides. A breakout could be on the horizon.

Disclaimer: The content in this article comprises personal opinions and should not be construed as containing personal and/or other investment advice and/or an offer of and/or solicitation for any transactions in financial instruments and/or a guarantee and/or prediction of future performance. ForexTime (FXTM), its affiliates, agents, directors, officers or employees do not guarantee the accuracy, validity, timeliness or completeness, of any information or data made available and assume no liability as to any loss arising from any investment based on the same.


Forex-Time-LogoArticle by ForexTime

ForexTime Ltd (FXTM) is an award winning international online forex broker regulated by CySEC 185/12 www.forextime.com

COT Currency Futures Charts: US Dollar Index, Euro, Yen, Sterling, Swiss Franc, Mexican Peso, Bitcoin

By CountingPips.com COT Home | Data Tables | Data Downloads | Newsletter

Here are the latest charts and statistics for the Commitment of Traders (COT) data published by the Commodities Futures Trading Commission (CFTC).

The latest COT data is updated through Tuesday June 22 2021 and shows a quick view of how large traders (for-profit speculators and commercial entities) were positioned in the futures markets. All currency positions are in direct relation to the US dollar where, for example, a bet for the euro is a bet that the euro will rise versus the dollar while a bet against the euro will be a bet that the euro will decline versus the dollar.


US Dollar Index Futures:
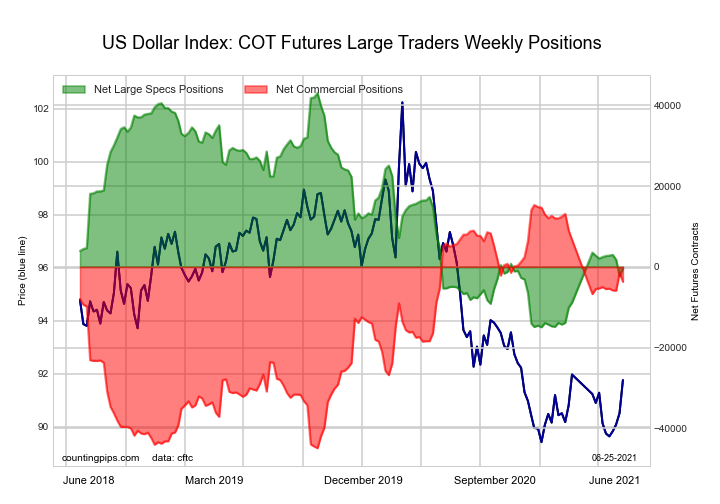
Federal Funds 30-Day Bonds Futures COT ChartThe US Dollar Index large speculator standing this week resulted in a net position of -510 contracts in the data reported through Tuesday. This was a weekly lift of 1,793 contracts from the previous week which had a total of -2,303 net contracts.

This week’s current strength score (the trader positioning range over the past three years, measured from 0 to 100) shows the speculators are currently Bearish with a score of 24.9 percent. The commercials are Bullish with a score of 68.4 percent and the small traders (not shown in chart) are Bullish with a score of 74.0 percent.

US DOLLAR INDEX StatisticsSPECULATORSCOMMERCIALSSMALL TRADERS
– Percent of Open Interest Longs:70.83.820.7
– Percent of Open Interest Shorts:72.214.58.6
– Net Position:-510-3,7074,217
– Gross Longs:24,5041,3017,181
– Gross Shorts:25,0145,0082,964
– Long to Short Ratio:1.0 to 10.3 to 12.4 to 1
NET POSITION TREND:
– COT Index Score (3 Year Range Pct):24.968.474.0
– COT Index Reading (3 Year Range):BearishBullishBullish
NET POSITION MOVEMENT INDEX:
– 6-Week Change in Strength Index:-5.12.221.1


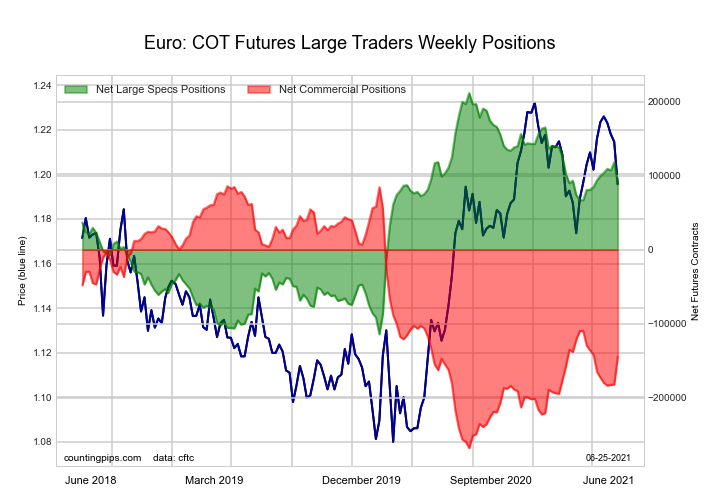
Euro Currency Futures:

2-Year Treasury Bonds Futures COT ChartThe Euro Currency large speculator standing this week resulted in a net position of 89,057 contracts in the data reported through Tuesday. This was a weekly lowering of -29,129 contracts from the previous week which had a total of 118,186 net contracts.

This week’s current strength score (the trader positioning range over the past three years, measured from 0 to 100) shows the speculators are currently Bullish with a score of 62.3 percent. The commercials are Bearish with a score of 34.9 percent and the small traders (not shown in chart) are Bullish with a score of 71.1 percent.

EURO Currency StatisticsSPECULATORSCOMMERCIALSSMALL TRADERS
– Percent of Open Interest Longs:29.955.313.9
– Percent of Open Interest Shorts:17.176.15.9
– Net Position:89,057-144,57955,522
– Gross Longs:207,863383,89496,568
– Gross Shorts:118,806528,47341,046
– Long to Short Ratio:1.7 to 10.7 to 12.4 to 1
NET POSITION TREND:
– COT Index Score (3 Year Range Pct):62.334.971.1
– COT Index Reading (3 Year Range):BullishBearishBullish
NET POSITION MOVEMENT INDEX:
– 6-Week Change in Strength Index:-1.55.7-22.0


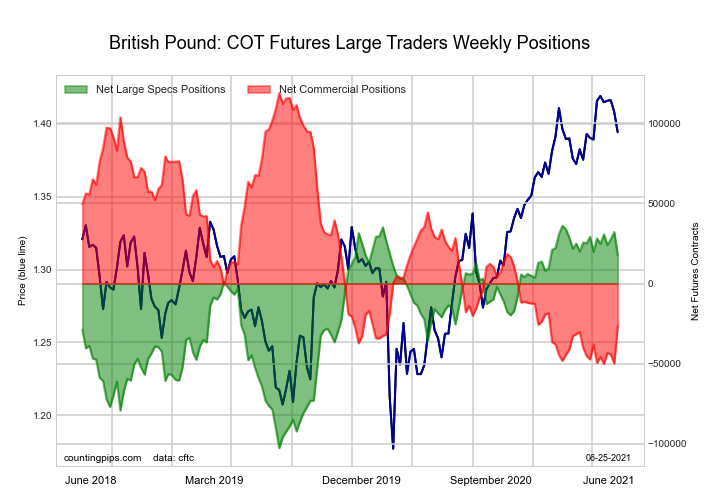
British Pound Sterling Futures:

5-Year Treasury Bonds Futures COT ChartThe British Pound Sterling large speculator standing this week resulted in a net position of 17,927 contracts in the data reported through Tuesday. This was a weekly reduction of -14,243 contracts from the previous week which had a total of 32,170 net contracts.

This week’s current strength score (the trader positioning range over the past three years, measured from 0 to 100) shows the speculators are currently Bullish-Extreme with a score of 86.9 percent. The commercials are Bearish-Extreme with a score of 14.0 percent and the small traders (not shown in chart) are Bullish with a score of 73.6 percent.

BRITISH POUND StatisticsSPECULATORSCOMMERCIALSSMALL TRADERS
– Percent of Open Interest Longs:30.049.719.0
– Percent of Open Interest Shorts:19.665.213.9
– Net Position:17,927-26,5788,651
– Gross Longs:51,44585,16932,470
– Gross Shorts:33,518111,74723,819
– Long to Short Ratio:1.5 to 10.8 to 11.4 to 1
NET POSITION TREND:
– COT Index Score (3 Year Range Pct):86.914.073.6
– COT Index Reading (3 Year Range):Bullish-ExtremeBearish-ExtremeBullish
NET POSITION MOVEMENT INDEX:
– 6-Week Change in Strength Index:-7.413.6-26.4


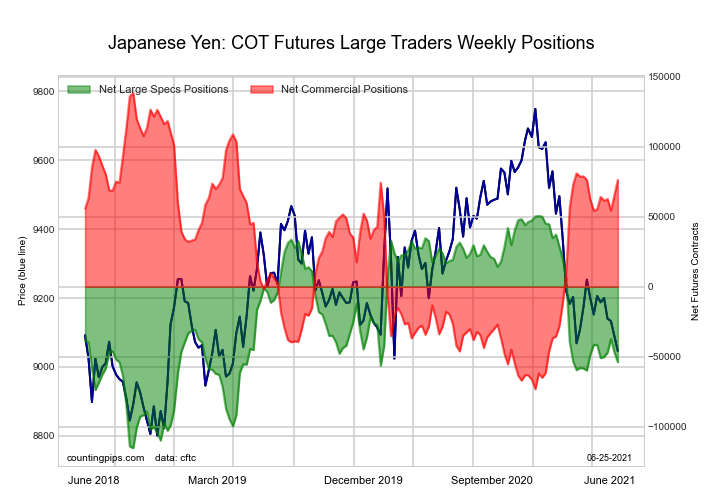
Japanese Yen Futures:

10-Year Treasury Notes Bonds Futures COT ChartThe Japanese Yen large speculator standing this week resulted in a net position of -53,862 contracts in the data reported through Tuesday. This was a weekly decline of -7,012 contracts from the previous week which had a total of -46,850 net contracts.

This week’s current strength score (the trader positioning range over the past three years, measured from 0 to 100) shows the speculators are currently Bearish with a score of 37.0 percent. The commercials are Bullish with a score of 70.6 percent and the small traders (not shown in chart) are Bearish-Extreme with a score of 13.6 percent.

JAPANESE YEN StatisticsSPECULATORSCOMMERCIALSSMALL TRADERS
– Percent of Open Interest Longs:17.972.68.9
– Percent of Open Interest Shorts:46.232.620.6
– Net Position:-53,86276,170-22,308
– Gross Longs:34,118138,24216,991
– Gross Shorts:87,98062,07239,299
– Long to Short Ratio:0.4 to 12.2 to 10.4 to 1
NET POSITION TREND:
– COT Index Score (3 Year Range Pct):37.070.613.6
– COT Index Reading (3 Year Range):BearishBullishBearish-Extreme
NET POSITION MOVEMENT INDEX:
– 6-Week Change in Strength Index:-7.39.9-16.8


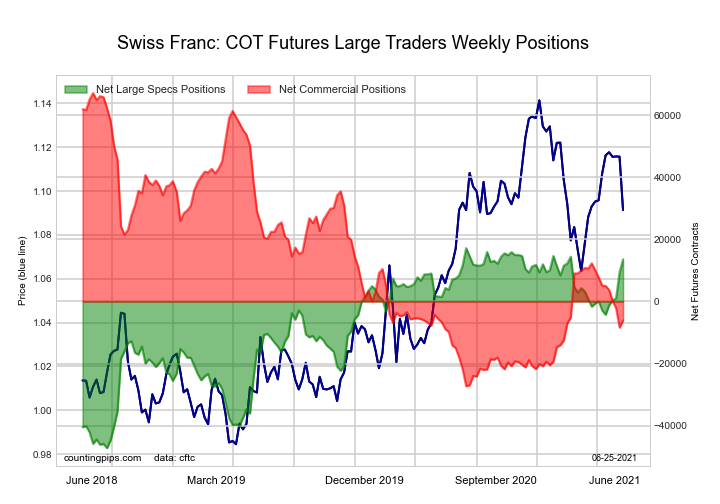
Swiss Franc Futures:

Ultra 10-Year Treasury Notes Bonds Futures COT ChartThe Swiss Franc large speculator standing this week resulted in a net position of 13,552 contracts in the data reported through Tuesday. This was a weekly rise of 4,165 contracts from the previous week which had a total of 9,387 net contracts.

This week’s current strength score (the trader positioning range over the past three years, measured from 0 to 100) shows the speculators are currently Bullish-Extreme with a score of 94.4 percent. The commercials are Bearish with a score of 22.4 percent and the small traders (not shown in chart) are Bearish with a score of 43.6 percent.

SWISS FRANC StatisticsSPECULATORSCOMMERCIALSSMALL TRADERS
– Percent of Open Interest Longs:50.124.125.5
– Percent of Open Interest Shorts:17.738.643.3
– Net Position:13,552-6,085-7,467
– Gross Longs:20,98010,10310,676
– Gross Shorts:7,42816,18818,143
– Long to Short Ratio:2.8 to 10.6 to 10.6 to 1
NET POSITION TREND:
– COT Index Score (3 Year Range Pct):94.422.443.6
– COT Index Reading (3 Year Range):Bullish-ExtremeBearishBearish
NET POSITION MOVEMENT INDEX:
– 6-Week Change in Strength Index:25.5-11.8-14.8


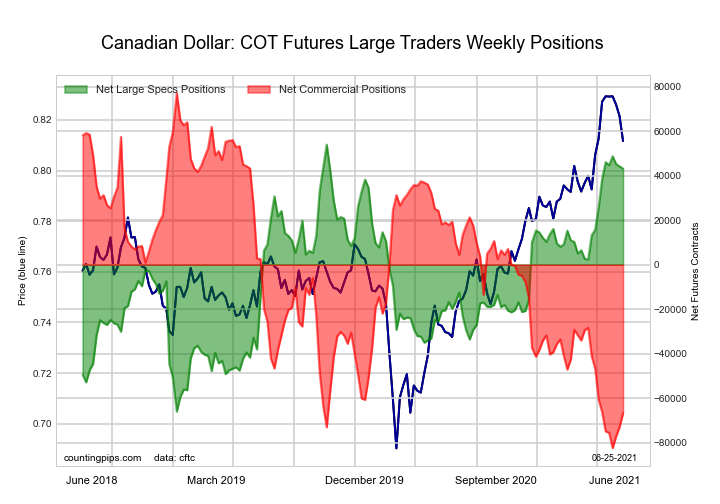
Canadian Dollar Futures:

US Year Treasury Notes Long Bonds Futures COT ChartThe Canadian Dollar large speculator standing this week resulted in a net position of 43,225 contracts in the data reported through Tuesday. This was a weekly fall of -1,029 contracts from the previous week which had a total of 44,254 net contracts.

This week’s current strength score (the trader positioning range over the past three years, measured from 0 to 100) shows the speculators are currently Bullish-Extreme with a score of 91.0 percent. The commercials are Bearish-Extreme with a score of 9.9 percent and the small traders (not shown in chart) are Bullish-Extreme with a score of 82.2 percent.

CANADIAN DOLLAR StatisticsSPECULATORSCOMMERCIALSSMALL TRADERS
– Percent of Open Interest Longs:34.143.621.2
– Percent of Open Interest Shorts:12.776.59.7
– Net Position:43,225-66,69023,465
– Gross Longs:69,07488,46143,060
– Gross Shorts:25,849155,15119,595
– Long to Short Ratio:2.7 to 10.6 to 12.2 to 1
NET POSITION TREND:
– COT Index Score (3 Year Range Pct):91.09.982.2
– COT Index Reading (3 Year Range):Bullish-ExtremeBearish-ExtremeBullish-Extreme
NET POSITION MOVEMENT INDEX:
– 6-Week Change in Strength Index:3.8-0.3-6.3


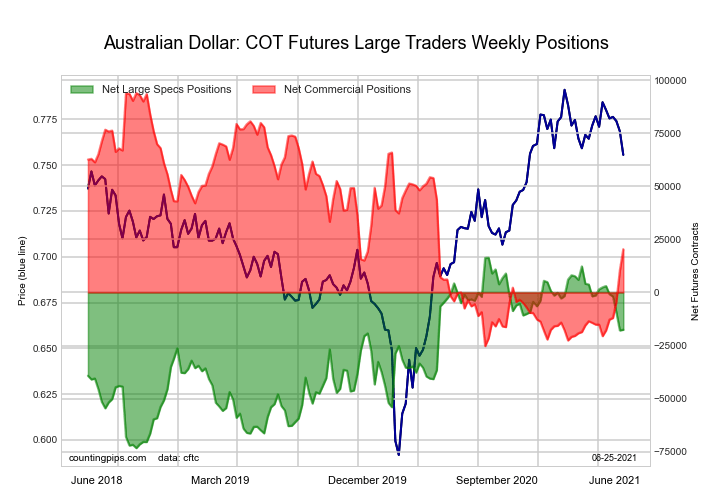
Australian Dollar Futures:

Ultra US Year Treasury Notes Long Bonds Futures COT ChartThe Australian Dollar large speculator standing this week resulted in a net position of -17,575 contracts in the data reported through Tuesday. This was a weekly lift of 305 contracts from the previous week which had a total of -17,880 net contracts.

This week’s current strength score (the trader positioning range over the past three years, measured from 0 to 100) shows the speculators are currently Bullish with a score of 62.2 percent. The commercials are Bearish with a score of 38.3 percent and the small traders (not shown in chart) are Bullish with a score of 51.0 percent.

AUSTRALIAN DOLLAR StatisticsSPECULATORSCOMMERCIALSSMALL TRADERS
– Percent of Open Interest Longs:38.045.914.9
– Percent of Open Interest Shorts:49.932.216.8
– Net Position:-17,57520,348-2,773
– Gross Longs:56,13367,90722,094
– Gross Shorts:73,70847,55924,867
– Long to Short Ratio:0.8 to 11.4 to 10.9 to 1
NET POSITION TREND:
– COT Index Score (3 Year Range Pct):62.238.351.0
– COT Index Reading (3 Year Range):BullishBearishBullish
NET POSITION MOVEMENT INDEX:
– 6-Week Change in Strength Index:-22.334.3-46.0


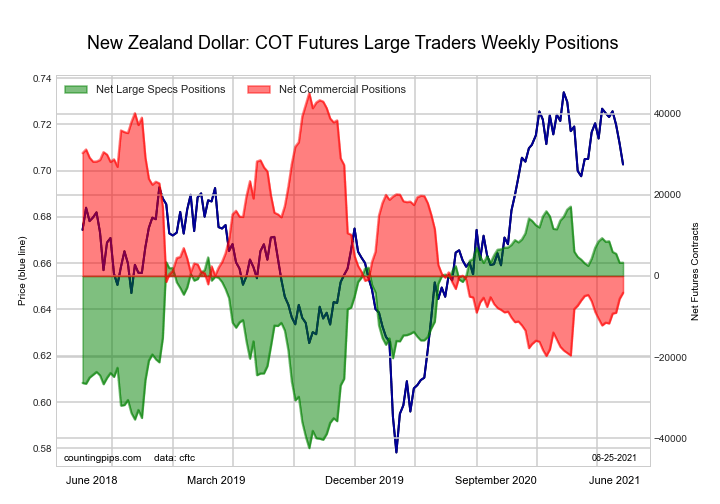
New Zealand Dollar Futures:

Eurodollar Bonds Futures COT ChartThe New Zealand Dollar large speculator standing this week resulted in a net position of 3,286 contracts in the data reported through Tuesday. This was a weekly lift of 21 contracts from the previous week which had a total of 3,265 net contracts.

This week’s current strength score (the trader positioning range over the past three years, measured from 0 to 100) shows the speculators are currently Bullish with a score of 76.8 percent. The commercials are Bearish with a score of 24.0 percent and the small traders (not shown in chart) are Bullish with a score of 62.8 percent.

NEW ZEALAND DOLLAR StatisticsSPECULATORSCOMMERCIALSSMALL TRADERS
– Percent of Open Interest Longs:48.837.311.7
– Percent of Open Interest Shorts:40.447.89.6
– Net Position:3,286-4,130844
– Gross Longs:19,17114,6554,615
– Gross Shorts:15,88518,7853,771
– Long to Short Ratio:1.2 to 10.8 to 11.2 to 1
NET POSITION TREND:
– COT Index Score (3 Year Range Pct):76.824.062.8
– COT Index Reading (3 Year Range):BullishBearishBullish
NET POSITION MOVEMENT INDEX:
– 6-Week Change in Strength Index:-10.212.4-22.2


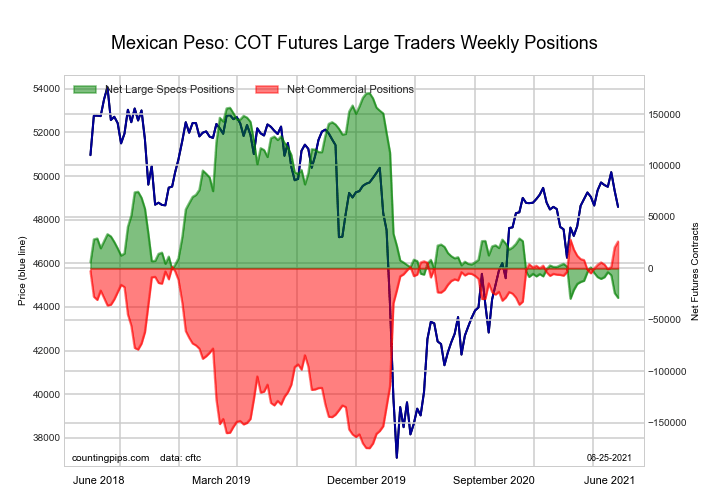
Mexican Peso Futures:

Ultra 10-Year Treasury Notes Bonds Futures COT ChartThe Mexican Peso large speculator standing this week resulted in a net position of -28,591 contracts in the data reported through Tuesday. This was a weekly reduction of -4,661 contracts from the previous week which had a total of -23,930 net contracts.

This week’s current strength score (the trader positioning range over the past three years, measured from 0 to 100) shows the speculators are currently Bearish-Extreme with a score of 0.4 percent. The commercials are Bullish-Extreme with a score of 99.0 percent and the small traders (not shown in chart) are Bullish with a score of 53.6 percent.

MEXICAN PESO StatisticsSPECULATORSCOMMERCIALSSMALL TRADERS
– Percent of Open Interest Longs:44.350.44.3
– Percent of Open Interest Shorts:64.731.82.5
– Net Position:-28,59126,0952,496
– Gross Longs:61,95570,5535,973
– Gross Shorts:90,54644,4583,477
– Long to Short Ratio:0.7 to 11.6 to 11.7 to 1
NET POSITION TREND:
– COT Index Score (3 Year Range Pct):0.499.053.6
– COT Index Reading (3 Year Range):Bearish-ExtremeBullish-ExtremeBullish
NET POSITION MOVEMENT INDEX:
– 6-Week Change in Strength Index:-10.111.2-10.8


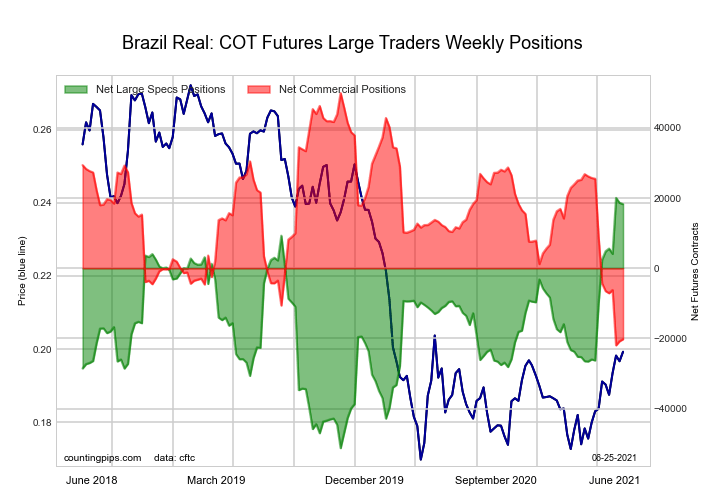
Brazilian Real Futures:

US Year Treasury Notes Long Bonds Futures COT ChartThe Brazilian Real large speculator standing this week resulted in a net position of 18,265 contracts in the data reported through Tuesday. This was a weekly lowering of -394 contracts from the previous week which had a total of 18,659 net contracts.

This week’s current strength score (the trader positioning range over the past three years, measured from 0 to 100) shows the speculators are currently Bullish-Extreme with a score of 97.5 percent. The commercials are Bearish-Extreme with a score of 2.4 percent and the small traders (not shown in chart) are Bullish-Extreme with a score of 96.6 percent.

BRAZIL REAL StatisticsSPECULATORSCOMMERCIALSSMALL TRADERS
– Percent of Open Interest Longs:65.421.412.8
– Percent of Open Interest Shorts:22.069.58.1
– Net Position:18,265-20,2391,974
– Gross Longs:27,5409,0025,390
– Gross Shorts:9,27529,2413,416
– Long to Short Ratio:3.0 to 10.3 to 11.6 to 1
NET POSITION TREND:
– COT Index Score (3 Year Range Pct):97.52.496.6
– COT Index Reading (3 Year Range):Bullish-ExtremeBearish-ExtremeBullish-Extreme
NET POSITION MOVEMENT INDEX:
– 6-Week Change in Strength Index:22.1-22.11.9


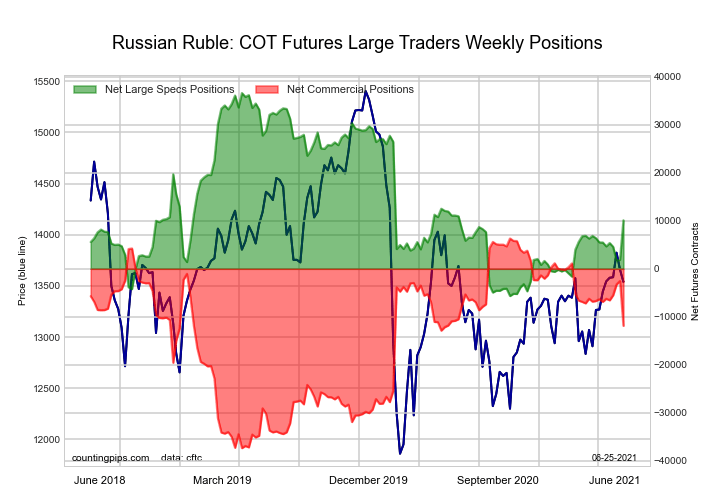
Russian Ruble Futures:

Ultra US Year Treasury Notes Long Bonds Futures COT ChartThe Russian Ruble large speculator standing this week resulted in a net position of 10,096 contracts in the data reported through Tuesday. This was a weekly lift of 8,192 contracts from the previous week which had a total of 1,904 net contracts.

This week’s current strength score (the trader positioning range over the past three years, measured from 0 to 100) shows the speculators are currently Bearish with a score of 37.3 percent. The commercials are Bullish with a score of 58.4 percent and the small traders (not shown in chart) are Bullish-Extreme with a score of 100.0 percent.

RUSSIAN RUBLE StatisticsSPECULATORSCOMMERCIALSSMALL TRADERS
– Percent of Open Interest Longs:38.954.56.6
– Percent of Open Interest Shorts:13.684.32.2
– Net Position:10,096-11,8591,763
– Gross Longs:15,49521,6902,633
– Gross Shorts:5,39933,549870
– Long to Short Ratio:2.9 to 10.6 to 13.0 to 1
NET POSITION TREND:
– COT Index Score (3 Year Range Pct):37.358.4100.0
– COT Index Reading (3 Year Range):BearishBullishBullish-Extreme
NET POSITION MOVEMENT INDEX:
– 6-Week Change in Strength Index:10.9-11.512.6


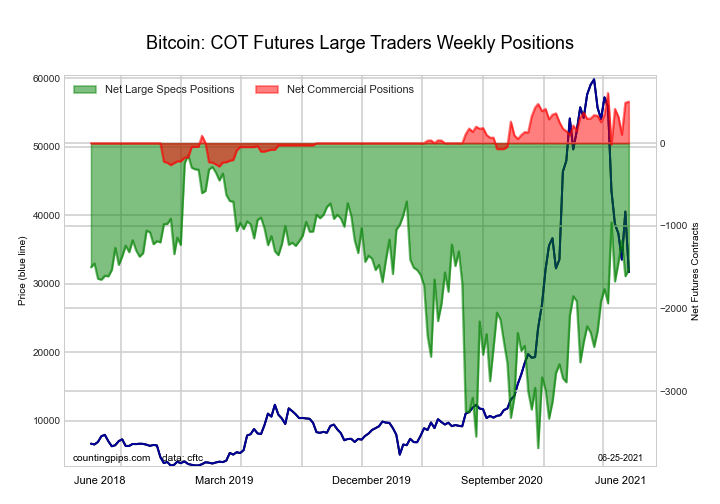
Bitcoin Futures:

Eurodollar Bonds Futures COT ChartThe Bitcoin large speculator standing this week resulted in a net position of -1,528 contracts in the data reported through Tuesday. This was a weekly lift of 81 contracts from the previous week which had a total of -1,609 net contracts.

This week’s current strength score (the trader positioning range over the past three years, measured from 0 to 100) shows the speculators are currently Bullish with a score of 60.9 percent. The commercials are Bullish-Extreme with a score of 88.3 percent and the small traders (not shown in chart) are Bearish with a score of 23.4 percent.

BITCOIN StatisticsSPECULATORSCOMMERCIALSSMALL TRADERS
– Percent of Open Interest Longs:56.98.224.2
– Percent of Open Interest Shorts:76.21.811.2
– Net Position:-1,5285031,025
– Gross Longs:4,5026451,913
– Gross Shorts:6,030142888
– Long to Short Ratio:0.7 to 14.5 to 12.2 to 1
NET POSITION TREND:
– COT Index Score (3 Year Range Pct):60.988.323.4
– COT Index Reading (3 Year Range):BullishBullish-ExtremeBearish
NET POSITION MOVEMENT INDEX:
– 6-Week Change in Strength Index:11.6-11.7-10.1


Article By CountingPips.comReceive our weekly COT Reports by Email

*COT Report: The COT data, released weekly to the public each Friday, is updated through the most recent Tuesday (data is 3 days old) and shows a quick view of how large speculators or non-commercials (for-profit traders) were positioned in the futures markets.

The CFTC categorizes trader positions according to commercial hedgers (traders who use futures contracts for hedging as part of the business), non-commercials (large traders who speculate to realize trading profits) and nonreportable traders (usually small traders/speculators).

Find CFTC criteria here: (http://www.cftc.gov/MarketReports/CommitmentsofTraders/ExplanatoryNotes/index.htm).

COT Bonds Futures Charts: Fed Funds, 3-Month Eurodollars, Ultra US Bond Treasury Notes

By CountingPips.com COT Home | Data Tables | Data Downloads | Newsletter

Here are the latest charts and statistics for the Commitment of Traders (COT) data published by the Commodities Futures Trading Commission (CFTC).

The latest COT data is updated through Tuesday June 22 2021 and shows a quick view of how large traders (for-profit speculators and commercial entities) were positioned in the futures markets.


3-Month Eurodollars Futures:

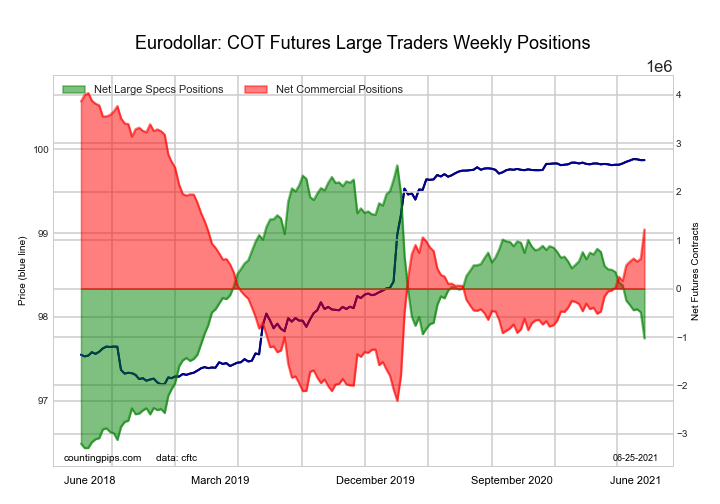
Eurodollar Bonds Futures COT ChartThe 3-Month Eurodollars large speculator standing this week equaled a net position of -1,027,697 contracts in the data reported through Tuesday. This was a weekly fall of -539,388 contracts from the previous week which had a total of -488,309 net contracts.

This week’s current strength score (the trader positioning range over the past three years, measured from 0 to 100) shows the speculators are currently Bearish with a score of 38.8 percent. The commercials are Bullish with a score of 55.7 percent and the small traders (not shown in chart) are Bullish with a score of 77.8 percent.

3-Month Eurodollars StatisticsSPECULATORSCOMMERCIALSSMALL TRADERS
– Percent of Open Interest Longs:14.659.35.0
– Percent of Open Interest Shorts:23.049.36.6
– Net Position:-1,027,6971,219,992-192,295
– Gross Longs:1,777,4127,230,673607,765
– Gross Shorts:2,805,1096,010,681800,060
– Long to Short Ratio:0.6 to 11.2 to 10.8 to 1
NET POSITION TREND:
– COT Index Score (3 Year Range Pct):38.855.777.8
– COT Index Reading (3 Year Range):BearishBullishBullish
NET POSITION MOVEMENT INDEX:
– 6-Week Change in Strength Index:-18.816.84.3


30-Day Federal Funds Futures:

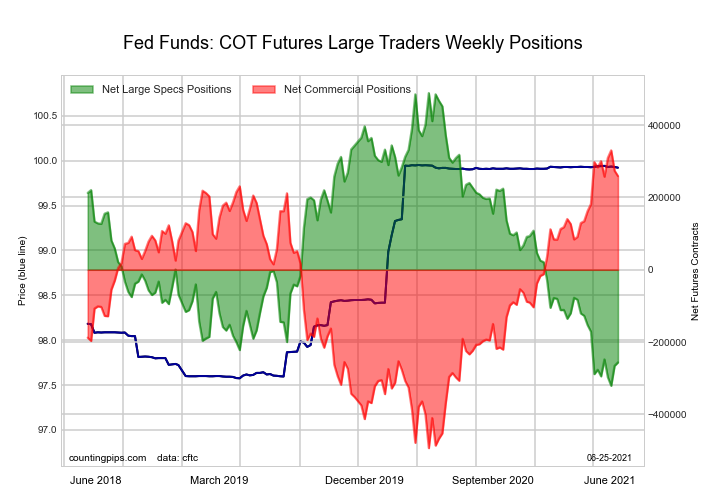
Federal Funds 30-Day Bonds Futures COT ChartThe 30-Day Federal Funds large speculator standing this week equaled a net position of -256,308 contracts in the data reported through Tuesday. This was a weekly gain of 9,371 contracts from the previous week which had a total of -265,679 net contracts.

This week’s current strength score (the trader positioning range over the past three years, measured from 0 to 100) shows the speculators are currently Bearish-Extreme with a score of 8.0 percent. The commercials are Bullish-Extreme with a score of 91.4 percent and the small traders (not shown in chart) are Bullish with a score of 65.5 percent.

30-Day Federal Funds StatisticsSPECULATORSCOMMERCIALSSMALL TRADERS
– Percent of Open Interest Longs:2.379.92.7
– Percent of Open Interest Shorts:26.255.73.0
– Net Position:-256,308259,381-3,073
– Gross Longs:25,000856,20529,216
– Gross Shorts:281,308596,82432,289
– Long to Short Ratio:0.1 to 11.4 to 10.9 to 1
NET POSITION TREND:
– COT Index Score (3 Year Range Pct):8.091.465.5
– COT Index Reading (3 Year Range):Bearish-ExtremeBullish-ExtremeBullish
NET POSITION MOVEMENT INDEX:
– 6-Week Change in Strength Index:2.5-2.97.0


2-Year Treasury Note Futures:

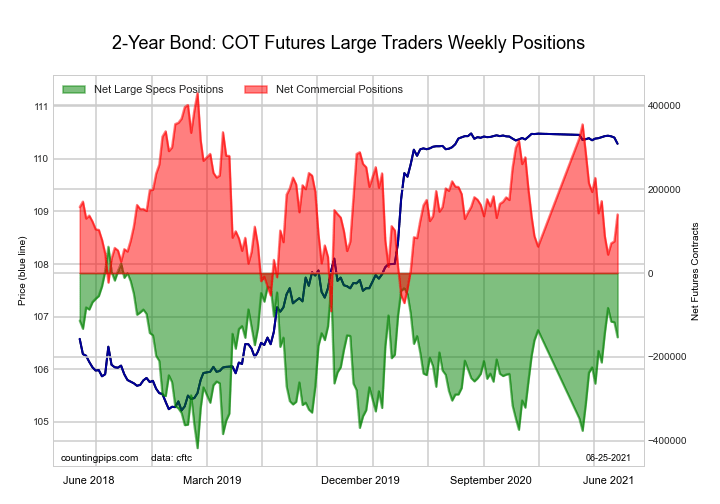
2-Year Treasury Bonds Futures COT ChartThe 2-Year Treasury Note large speculator standing this week equaled a net position of -152,907 contracts in the data reported through Tuesday. This was a weekly lowering of -35,967 contracts from the previous week which had a total of -116,940 net contracts.

This week’s current strength score (the trader positioning range over the past three years, measured from 0 to 100) shows the speculators are currently Bullish with a score of 63.4 percent. The commercials are Bearish with a score of 44.4 percent and the small traders (not shown in chart) are Bearish with a score of 41.6 percent.

2-Year Treasury Note StatisticsSPECULATORSCOMMERCIALSSMALL TRADERS
– Percent of Open Interest Longs:18.671.76.8
– Percent of Open Interest Shorts:26.064.96.2
– Net Position:-152,907140,04612,861
– Gross Longs:382,1651,472,663140,292
– Gross Shorts:535,0721,332,617127,431
– Long to Short Ratio:0.7 to 11.1 to 11.1 to 1
NET POSITION TREND:
– COT Index Score (3 Year Range Pct):63.444.441.6
– COT Index Reading (3 Year Range):BullishBearishBearish
NET POSITION MOVEMENT INDEX:
– 6-Week Change in Strength Index:7.8-0.5-15.8


5-Year Treasury Note Futures:

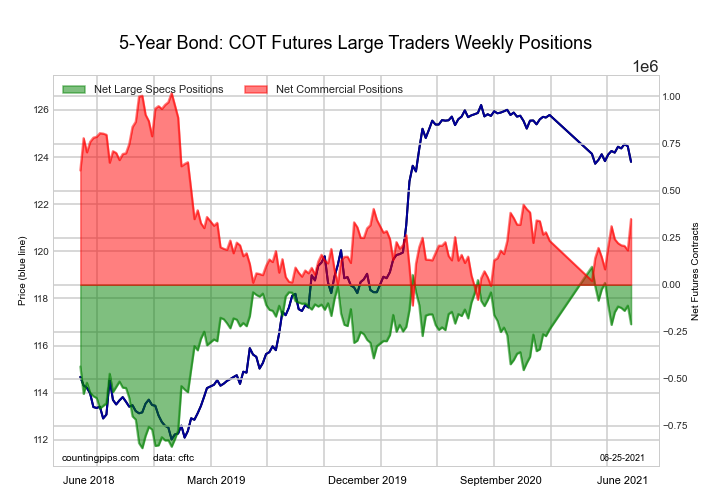
5-Year Treasury Bonds Futures COT ChartThe 5-Year Treasury Note large speculator standing this week equaled a net position of -209,526 contracts in the data reported through Tuesday. This was a weekly reduction of -98,508 contracts from the previous week which had a total of -111,018 net contracts.

This week’s current strength score (the trader positioning range over the past three years, measured from 0 to 100) shows the speculators are currently Bullish with a score of 68.3 percent. The commercials are Bearish with a score of 40.7 percent and the small traders (not shown in chart) are Bearish-Extreme with a score of 8.1 percent.

5-Year Treasury Note StatisticsSPECULATORSCOMMERCIALSSMALL TRADERS
– Percent of Open Interest Longs:11.579.07.9
– Percent of Open Interest Shorts:17.668.811.9
– Net Position:-209,526349,248-139,722
– Gross Longs:397,2542,721,853271,622
– Gross Shorts:606,7802,372,605411,344
– Long to Short Ratio:0.7 to 11.1 to 10.7 to 1
NET POSITION TREND:
– COT Index Score (3 Year Range Pct):68.340.78.1
– COT Index Reading (3 Year Range):BullishBearishBearish-Extreme
NET POSITION MOVEMENT INDEX:
– 6-Week Change in Strength Index:0.33.4-18.2


10-Year Treasury Note Futures:

10-Year Treasury Notes Bonds Futures COT ChartThe 10-Year Treasury Note large speculator standing this week equaled a net position of -2,312 contracts in the data reported through Tuesday. This was a weekly decline of -36,648 contracts from the previous week which had a total of 34,336 net contracts.

This week’s current strength score (the trader positioning range over the past three years, measured from 0 to 100) shows the speculators are currently Bullish-Extreme with a score of 81.1 percent. The commercials are Bearish with a score of 43.1 percent and the small traders (not shown in chart) are Bearish-Extreme with a score of 5.0 percent.

10-Year Treasury Note StatisticsSPECULATORSCOMMERCIALSSMALL TRADERS
– Percent of Open Interest Longs:20.471.07.1
– Percent of Open Interest Shorts:20.464.813.2
– Net Position:-2,312263,172-260,860
– Gross Longs:870,0323,031,108303,180
– Gross Shorts:872,3442,767,936564,040
– Long to Short Ratio:1.0 to 11.1 to 10.5 to 1
NET POSITION TREND:
– COT Index Score (3 Year Range Pct):81.143.15.0
– COT Index Reading (3 Year Range):Bullish-ExtremeBearishBearish-Extreme
NET POSITION MOVEMENT INDEX:
– 6-Week Change in Strength Index:-0.41.3-2.8


Ultra 10-Year Notes Futures:

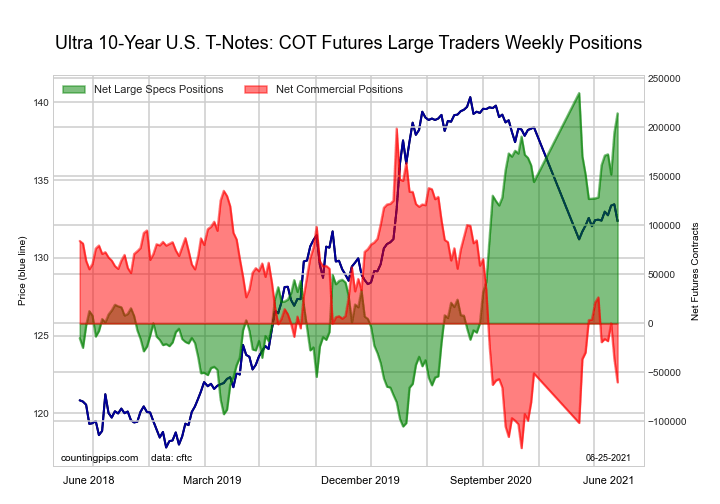
Ultra 10-Year Treasury Notes Bonds Futures COT ChartThe Ultra 10-Year Notes large speculator standing this week equaled a net position of 214,461 contracts in the data reported through Tuesday. This was a weekly increase of 19,854 contracts from the previous week which had a total of 194,607 net contracts.

This week’s current strength score (the trader positioning range over the past three years, measured from 0 to 100) shows the speculators are currently Bullish-Extreme with a score of 84.4 percent. The commercials are Bearish with a score of 27.4 percent and the small traders (not shown in chart) are Bearish-Extreme with a score of 2.9 percent.

Ultra 10-Year Notes StatisticsSPECULATORSCOMMERCIALSSMALL TRADERS
– Percent of Open Interest Longs:20.172.07.6
– Percent of Open Interest Shorts:6.075.917.8
– Net Position:214,461-60,111-154,350
– Gross Longs:305,0591,092,678115,510
– Gross Shorts:90,5981,152,789269,860
– Long to Short Ratio:3.4 to 10.9 to 10.4 to 1
NET POSITION TREND:
– COT Index Score (3 Year Range Pct):84.427.42.9
– COT Index Reading (3 Year Range):Bullish-ExtremeBearishBearish-Extreme
NET POSITION MOVEMENT INDEX:
– 6-Week Change in Strength Index:22.7-24.30.8


US Treasury Bonds Futures:

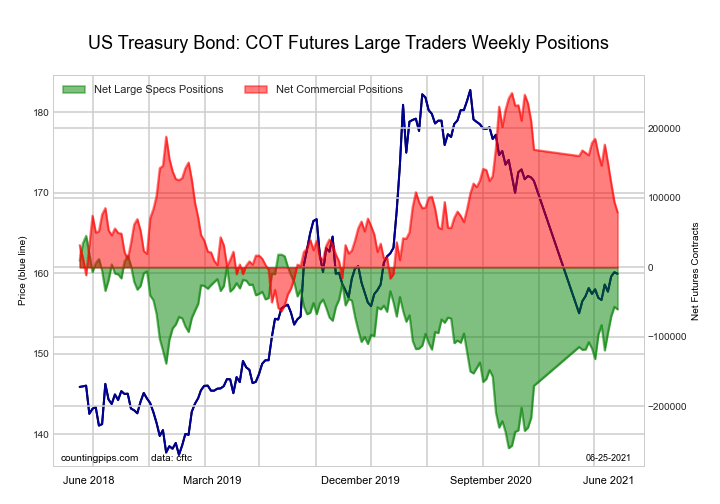
US Year Treasury Notes Long Bonds Futures COT ChartThe US Treasury Bonds large speculator standing this week equaled a net position of -60,354 contracts in the data reported through Tuesday. This was a weekly reduction of -3,667 contracts from the previous week which had a total of -56,687 net contracts.

This week’s current strength score (the trader positioning range over the past three years, measured from 0 to 100) shows the speculators are currently Bullish with a score of 71.7 percent. The commercials are Bearish with a score of 45.3 percent and the small traders (not shown in chart) are Bearish with a score of 37.8 percent.

US Treasury Bonds StatisticsSPECULATORSCOMMERCIALSSMALL TRADERS
– Percent of Open Interest Longs:9.374.114.3
– Percent of Open Interest Shorts:14.467.415.9
– Net Position:-60,35478,959-18,605
– Gross Longs:109,167873,996168,398
– Gross Shorts:169,521795,037187,003
– Long to Short Ratio:0.6 to 11.1 to 10.9 to 1
NET POSITION TREND:
– COT Index Score (3 Year Range Pct):71.745.337.8
– COT Index Reading (3 Year Range):BullishBearishBearish
NET POSITION MOVEMENT INDEX:
– 6-Week Change in Strength Index:13.0-26.737.8


Ultra US Treasury Bonds Futures:

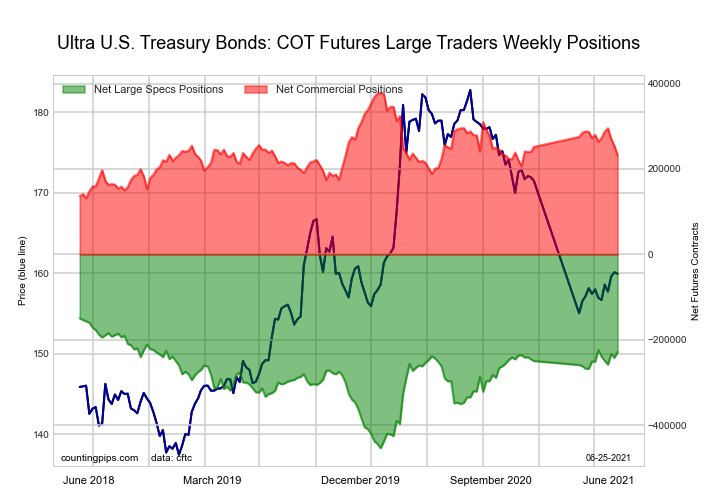
Ultra US Year Treasury Notes Long Bonds Futures COT ChartThe Ultra US Treasury Bonds large speculator standing this week equaled a net position of -228,949 contracts in the data reported through Tuesday. This was a weekly advance of 13,460 contracts from the previous week which had a total of -242,409 net contracts.

This week’s current strength score (the trader positioning range over the past three years, measured from 0 to 100) shows the speculators are currently Bullish-Extreme with a score of 85.5 percent. The commercials are Bearish with a score of 36.1 percent and the small traders (not shown in chart) are Bearish with a score of 25.9 percent.

Ultra US Treasury Bonds StatisticsSPECULATORSCOMMERCIALSSMALL TRADERS
– Percent of Open Interest Longs:8.679.112.0
– Percent of Open Interest Shorts:27.759.712.2
– Net Position:-228,949232,264-3,315
– Gross Longs:102,926947,822143,231
– Gross Shorts:331,875715,558146,546
– Long to Short Ratio:0.3 to 11.3 to 11.0 to 1
NET POSITION TREND:
– COT Index Score (3 Year Range Pct):85.536.125.9
– COT Index Reading (3 Year Range):Bullish-ExtremeBearishBearish
NET POSITION MOVEMENT INDEX:
– 6-Week Change in Strength Index:-1.7-13.825.9


Article By CountingPips.comReceive our weekly COT Reports by Email

*COT Report: The COT data, released weekly to the public each Friday, is updated through the most recent Tuesday (data is 3 days old) and shows a quick view of how large speculators or non-commercials (for-profit traders) were positioned in the futures markets.

The CFTC categorizes trader positions according to commercial hedgers (traders who use futures contracts for hedging as part of the business), non-commercials (large traders who speculate to realize trading profits) and nonreportable traders (usually small traders/speculators).

Find CFTC criteria here: (http://www.cftc.gov/MarketReports/CommitmentsofTraders/ExplanatoryNotes/index.htm).

COT Futures Metals Charts: Gold, Comex Silver, Copper Grade #1, Platinum and Palladium

By CountingPips.com COT Home | Data Tables | Data Downloads | Newsletter

Here are the latest charts and statistics for the Commitment of Traders (COT) data published by the Commodities Futures Trading Commission (CFTC).

The latest COT data is updated through Tuesday June 22 2021 and shows a quick view of how large traders (for-profit speculators and commercial entities) were positioned in the futures markets.


Gold Comex Futures:

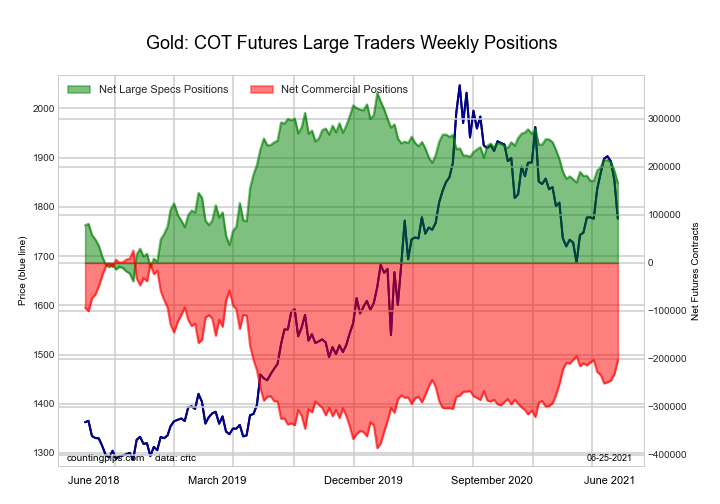
Federal Funds 30-Day Bonds Futures COT ChartThe Gold Comex Futures large speculator standing this week was a net position of 166,214 contracts in the data reported through Tuesday. This was a weekly reduction of -25,822 contracts from the previous week which had a total of 192,036 net contracts.

This week’s current strength score (the trader positioning range over the past three years, measured from 0 to 100) shows the speculators are currently Bullish with a score of 52.2 percent. The commercials are Bearish with a score of 44.5 percent and the small traders (not shown in chart) are Bullish with a score of 71.5 percent.

Gold Futures StatisticsSPECULATORSCOMMERCIALSSMALL TRADERS
– Percent of Open Interest Longs:55.823.311.7
– Percent of Open Interest Shorts:19.267.93.7
– Net Position:166,214-202,38236,168
– Gross Longs:253,153105,83053,152
– Gross Shorts:86,939308,21216,984
– Long to Short Ratio:2.9 to 10.3 to 13.1 to 1
NET POSITION TREND:
– COT Index Score (3 Year Range Pct):52.244.571.5
– COT Index Reading (3 Year Range):BullishBearishBullish
NET POSITION MOVEMENT INDEX:
– 6-Week Change in Strength Index:-6.66.03.3


Silver Comex Futures:

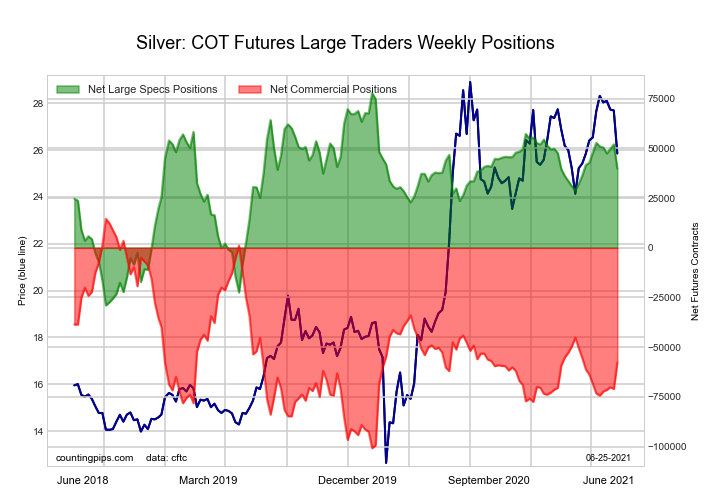
2-Year Treasury Bonds Futures COT ChartThe Silver Comex Futures large speculator standing this week was a net position of 39,871 contracts in the data reported through Tuesday. This was a weekly decline of -12,193 contracts from the previous week which had a total of 52,064 net contracts.

This week’s current strength score (the trader positioning range over the past three years, measured from 0 to 100) shows the speculators are currently Bullish with a score of 64.4 percent. The commercials are Bearish with a score of 37.3 percent and the small traders (not shown in chart) are Bearish with a score of 44.6 percent.

Silver Futures StatisticsSPECULATORSCOMMERCIALSSMALL TRADERS
– Percent of Open Interest Longs:42.033.716.7
– Percent of Open Interest Shorts:19.366.56.5
– Net Position:39,871-57,68217,811
– Gross Longs:73,84159,24329,267
– Gross Shorts:33,970116,92511,456
– Long to Short Ratio:2.2 to 10.5 to 12.6 to 1
NET POSITION TREND:
– COT Index Score (3 Year Range Pct):64.437.344.6
– COT Index Reading (3 Year Range):BullishBearishBearish
NET POSITION MOVEMENT INDEX:
– 6-Week Change in Strength Index:-12.113.5-15.8


Copper Grade #1 Futures:

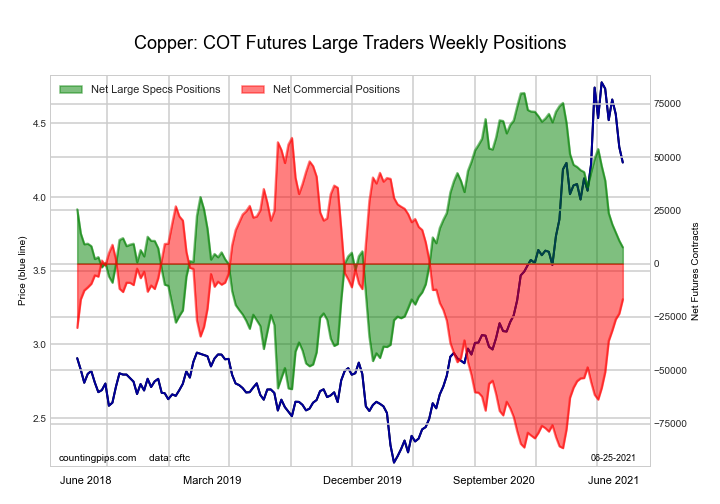
5-Year Treasury Bonds Futures COT ChartThe Copper Grade #1 Futures large speculator standing this week was a net position of 7,686 contracts in the data reported through Tuesday. This was a weekly decrease of -3,085 contracts from the previous week which had a total of 10,771 net contracts.

This week’s current strength score (the trader positioning range over the past three years, measured from 0 to 100) shows the speculators are currently Bearish with a score of 47.9 percent. The commercials are Bearish with a score of 48.0 percent and the small traders (not shown in chart) are Bullish with a score of 77.6 percent.

Copper Futures StatisticsSPECULATORSCOMMERCIALSSMALL TRADERS
– Percent of Open Interest Longs:40.038.210.6
– Percent of Open Interest Shorts:36.346.36.2
– Net Position:7,686-16,7249,038
– Gross Longs:82,54078,77821,914
– Gross Shorts:74,85495,50212,876
– Long to Short Ratio:1.1 to 10.8 to 11.7 to 1
NET POSITION TREND:
– COT Index Score (3 Year Range Pct):47.948.077.6
– COT Index Reading (3 Year Range):BearishBearishBullish
NET POSITION MOVEMENT INDEX:
– 6-Week Change in Strength Index:-27.528.6-20.0


Platinum Futures:

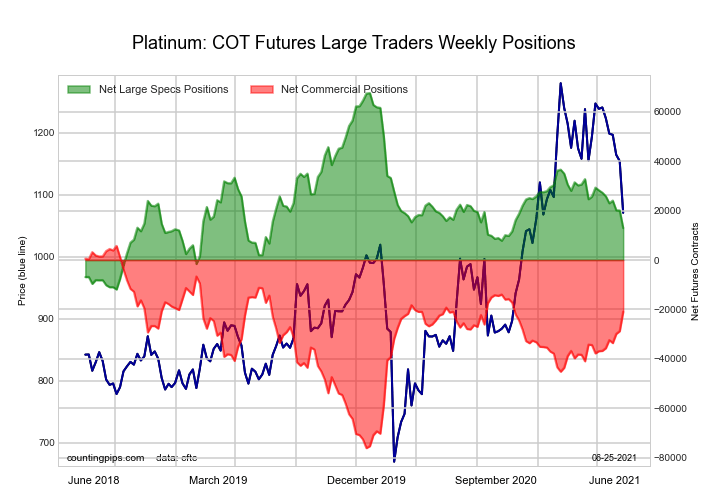
10-Year Treasury Notes Bonds Futures COT ChartThe Platinum Futures large speculator standing this week was a net position of 12,940 contracts in the data reported through Tuesday. This was a weekly decrease of -7,117 contracts from the previous week which had a total of 20,057 net contracts.

This week’s current strength score (the trader positioning range over the past three years, measured from 0 to 100) shows the speculators are currently Bearish with a score of 31.3 percent. The commercials are Bullish with a score of 67.5 percent and the small traders (not shown in chart) are Bullish with a score of 73.5 percent.

Platinum Futures StatisticsSPECULATORSCOMMERCIALSSMALL TRADERS
– Percent of Open Interest Longs:50.329.517.4
– Percent of Open Interest Shorts:29.962.54.8
– Net Position:12,940-20,9257,985
– Gross Longs:31,83018,64810,996
– Gross Shorts:18,89039,5733,011
– Long to Short Ratio:1.7 to 10.5 to 13.7 to 1
NET POSITION TREND:
– COT Index Score (3 Year Range Pct):31.367.573.5
– COT Index Reading (3 Year Range):BearishBullishBullish
NET POSITION MOVEMENT INDEX:
– 6-Week Change in Strength Index:-18.019.4-21.5


Palladium Futures:

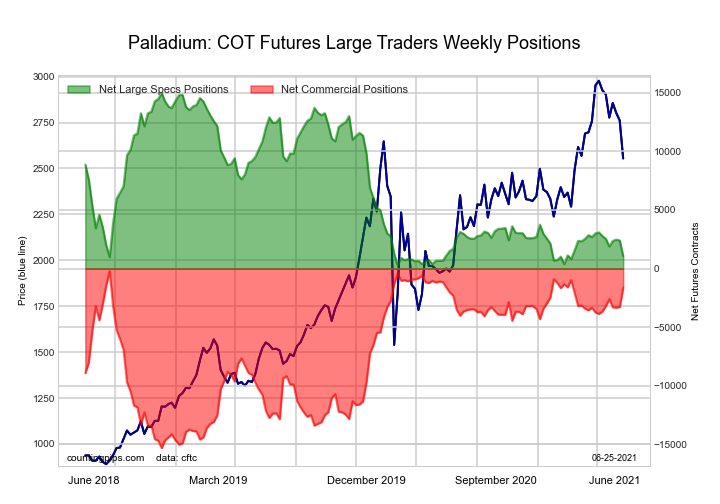
Ultra 10-Year Treasury Notes Bonds Futures COT ChartThe Palladium Futures large speculator standing this week was a net position of 1,072 contracts in the data reported through Tuesday. This was a weekly decrease of -1,331 contracts from the previous week which had a total of 2,403 net contracts.

This week’s current strength score (the trader positioning range over the past three years, measured from 0 to 100) shows the speculators are currently Bearish-Extreme with a score of 5.3 percent. The commercials are Bullish-Extreme with a score of 90.6 percent and the small traders (not shown in chart) are Bullish with a score of 77.5 percent.

Palladium Futures StatisticsSPECULATORSCOMMERCIALSSMALL TRADERS
– Percent of Open Interest Longs:48.634.414.7
– Percent of Open Interest Shorts:36.952.18.7
– Net Position:1,072-1,626554
– Gross Longs:4,4743,1731,353
– Gross Shorts:3,4024,799799
– Long to Short Ratio:1.3 to 10.7 to 11.7 to 1
NET POSITION TREND:
– COT Index Score (3 Year Range Pct):5.390.677.5
– COT Index Reading (3 Year Range):Bearish-ExtremeBullish-ExtremeBullish
NET POSITION MOVEMENT INDEX:
– 6-Week Change in Strength Index:-11.613.4-18.7


Article By CountingPips.comReceive our weekly COT Reports by Email

*COT Report: The COT data, released weekly to the public each Friday, is updated through the most recent Tuesday (data is 3 days old) and shows a quick view of how large speculators or non-commercials (for-profit traders) were positioned in the futures markets.

The CFTC categorizes trader positions according to commercial hedgers (traders who use futures contracts for hedging as part of the business), non-commercials (large traders who speculate to realize trading profits) and nonreportable traders (usually small traders/speculators).

Find CFTC criteria here: (http://www.cftc.gov/MarketReports/CommitmentsofTraders/ExplanatoryNotes/index.htm).