
By CountingPips.com COT Home | Data Tables | Data Downloads | Newsletter
Here are the latest charts and statistics for the Commitment of Traders (COT) data published by the Commodities Futures Trading Commission (CFTC).
The latest COT data is updated through Tuesday June 22 2021 and shows a quick view of how large traders (for-profit speculators and commercial entities) were positioned in the futures markets. All currency positions are in direct relation to the US dollar where, for example, a bet for the euro is a bet that the euro will rise versus the dollar while a bet against the euro will be a bet that the euro will decline versus the dollar.
US Dollar Index Futures:
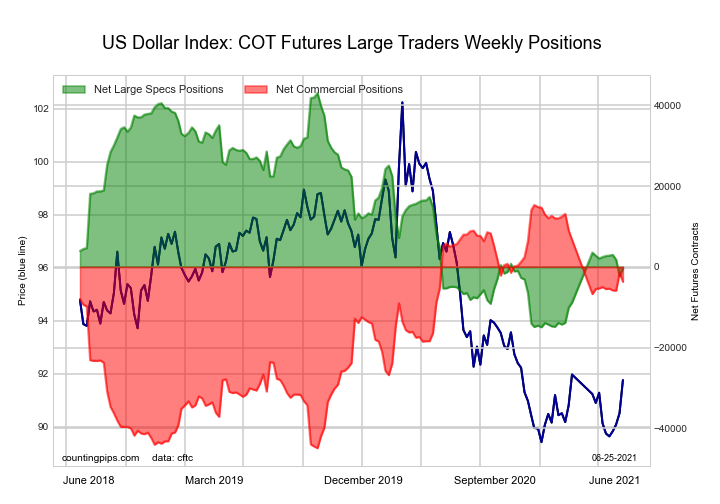 The US Dollar Index large speculator standing this week resulted in a net position of -510 contracts in the data reported through Tuesday. This was a weekly lift of 1,793 contracts from the previous week which had a total of -2,303 net contracts.
This week’s current strength score (the trader positioning range over the past three years, measured from 0 to 100) shows the speculators are currently Bearish with a score of 24.9 percent. The commercials are Bullish with a score of 68.4 percent and the small traders (not shown in chart) are Bullish with a score of 74.0 percent.
| US DOLLAR INDEX Statistics | SPECULATORS | COMMERCIALS | SMALL TRADERS |
| – Percent of Open Interest Longs: | 70.8 | 3.8 | 20.7 |
| – Percent of Open Interest Shorts: | 72.2 | 14.5 | 8.6 |
| – Net Position: | -510 | -3,707 | 4,217 |
| – Gross Longs: | 24,504 | 1,301 | 7,181 |
| – Gross Shorts: | 25,014 | 5,008 | 2,964 |
| – Long to Short Ratio: | 1.0 to 1 | 0.3 to 1 | 2.4 to 1 |
| NET POSITION TREND: | |||
| – COT Index Score (3 Year Range Pct): | 24.9 | 68.4 | 74.0 |
| – COT Index Reading (3 Year Range): | Bearish | Bullish | Bullish |
| NET POSITION MOVEMENT INDEX: | |||
| – 6-Week Change in Strength Index: | -5.1 | 2.2 | 21.1 |
Free Reports:
 Download Our Metatrader 4 Indicators – Put Our Free MetaTrader 4 Custom Indicators on your charts when you join our Weekly Newsletter
 Get our Weekly Commitment of Traders Reports - See where the biggest traders (Hedge Funds and Commercial Hedgers) are positioned in the futures markets on a weekly basis.
Euro Currency Futures:
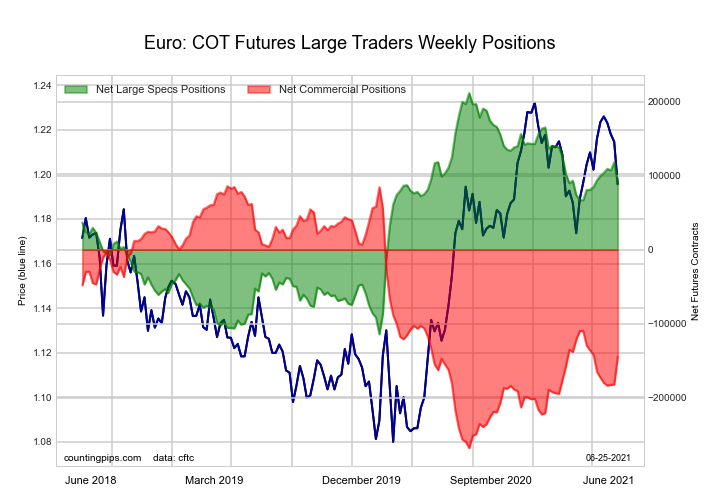 The Euro Currency large speculator standing this week resulted in a net position of 89,057 contracts in the data reported through Tuesday. This was a weekly lowering of -29,129 contracts from the previous week which had a total of 118,186 net contracts.
This week’s current strength score (the trader positioning range over the past three years, measured from 0 to 100) shows the speculators are currently Bullish with a score of 62.3 percent. The commercials are Bearish with a score of 34.9 percent and the small traders (not shown in chart) are Bullish with a score of 71.1 percent.
| EURO Currency Statistics | SPECULATORS | COMMERCIALS | SMALL TRADERS |
| – Percent of Open Interest Longs: | 29.9 | 55.3 | 13.9 |
| – Percent of Open Interest Shorts: | 17.1 | 76.1 | 5.9 |
| – Net Position: | 89,057 | -144,579 | 55,522 |
| – Gross Longs: | 207,863 | 383,894 | 96,568 |
| – Gross Shorts: | 118,806 | 528,473 | 41,046 |
| – Long to Short Ratio: | 1.7 to 1 | 0.7 to 1 | 2.4 to 1 |
| NET POSITION TREND: | |||
| – COT Index Score (3 Year Range Pct): | 62.3 | 34.9 | 71.1 |
| – COT Index Reading (3 Year Range): | Bullish | Bearish | Bullish |
| NET POSITION MOVEMENT INDEX: | |||
| – 6-Week Change in Strength Index: | -1.5 | 5.7 | -22.0 |
British Pound Sterling Futures:
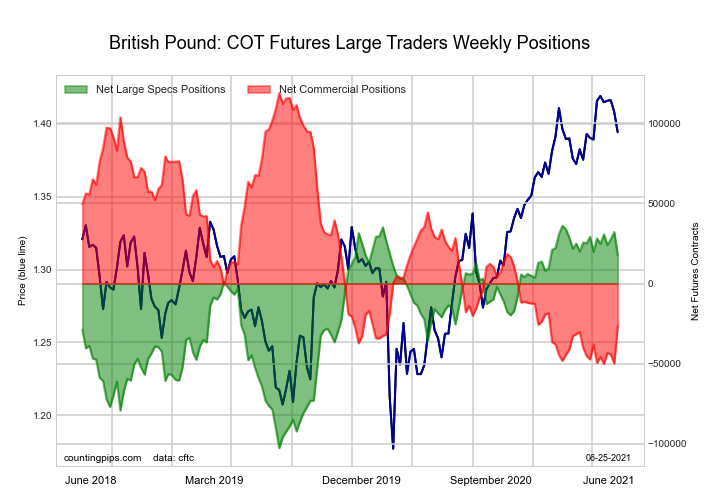 The British Pound Sterling large speculator standing this week resulted in a net position of 17,927 contracts in the data reported through Tuesday. This was a weekly reduction of -14,243 contracts from the previous week which had a total of 32,170 net contracts.
This week’s current strength score (the trader positioning range over the past three years, measured from 0 to 100) shows the speculators are currently Bullish-Extreme with a score of 86.9 percent. The commercials are Bearish-Extreme with a score of 14.0 percent and the small traders (not shown in chart) are Bullish with a score of 73.6 percent.
| BRITISH POUND Statistics | SPECULATORS | COMMERCIALS | SMALL TRADERS |
| – Percent of Open Interest Longs: | 30.0 | 49.7 | 19.0 |
| – Percent of Open Interest Shorts: | 19.6 | 65.2 | 13.9 |
| – Net Position: | 17,927 | -26,578 | 8,651 |
| – Gross Longs: | 51,445 | 85,169 | 32,470 |
| – Gross Shorts: | 33,518 | 111,747 | 23,819 |
| – Long to Short Ratio: | 1.5 to 1 | 0.8 to 1 | 1.4 to 1 |
| NET POSITION TREND: | |||
| – COT Index Score (3 Year Range Pct): | 86.9 | 14.0 | 73.6 |
| – COT Index Reading (3 Year Range): | Bullish-Extreme | Bearish-Extreme | Bullish |
| NET POSITION MOVEMENT INDEX: | |||
| – 6-Week Change in Strength Index: | -7.4 | 13.6 | -26.4 |
Japanese Yen Futures:
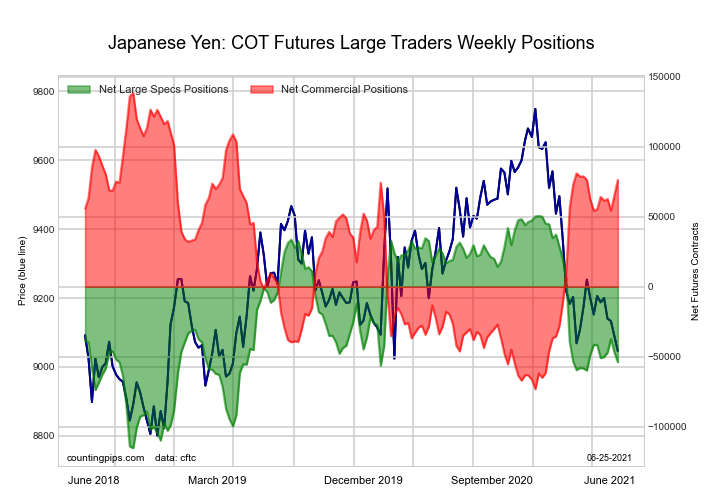 The Japanese Yen large speculator standing this week resulted in a net position of -53,862 contracts in the data reported through Tuesday. This was a weekly decline of -7,012 contracts from the previous week which had a total of -46,850 net contracts.
This week’s current strength score (the trader positioning range over the past three years, measured from 0 to 100) shows the speculators are currently Bearish with a score of 37.0 percent. The commercials are Bullish with a score of 70.6 percent and the small traders (not shown in chart) are Bearish-Extreme with a score of 13.6 percent.
| JAPANESE YEN Statistics | SPECULATORS | COMMERCIALS | SMALL TRADERS |
| – Percent of Open Interest Longs: | 17.9 | 72.6 | 8.9 |
| – Percent of Open Interest Shorts: | 46.2 | 32.6 | 20.6 |
| – Net Position: | -53,862 | 76,170 | -22,308 |
| – Gross Longs: | 34,118 | 138,242 | 16,991 |
| – Gross Shorts: | 87,980 | 62,072 | 39,299 |
| – Long to Short Ratio: | 0.4 to 1 | 2.2 to 1 | 0.4 to 1 |
| NET POSITION TREND: | |||
| – COT Index Score (3 Year Range Pct): | 37.0 | 70.6 | 13.6 |
| – COT Index Reading (3 Year Range): | Bearish | Bullish | Bearish-Extreme |
| NET POSITION MOVEMENT INDEX: | |||
| – 6-Week Change in Strength Index: | -7.3 | 9.9 | -16.8 |
Swiss Franc Futures:
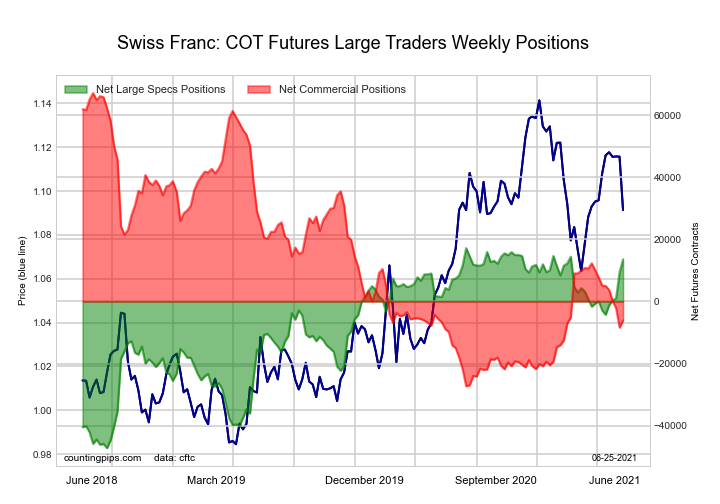 The Swiss Franc large speculator standing this week resulted in a net position of 13,552 contracts in the data reported through Tuesday. This was a weekly rise of 4,165 contracts from the previous week which had a total of 9,387 net contracts.
This week’s current strength score (the trader positioning range over the past three years, measured from 0 to 100) shows the speculators are currently Bullish-Extreme with a score of 94.4 percent. The commercials are Bearish with a score of 22.4 percent and the small traders (not shown in chart) are Bearish with a score of 43.6 percent.
| SWISS FRANC Statistics | SPECULATORS | COMMERCIALS | SMALL TRADERS |
| – Percent of Open Interest Longs: | 50.1 | 24.1 | 25.5 |
| – Percent of Open Interest Shorts: | 17.7 | 38.6 | 43.3 |
| – Net Position: | 13,552 | -6,085 | -7,467 |
| – Gross Longs: | 20,980 | 10,103 | 10,676 |
| – Gross Shorts: | 7,428 | 16,188 | 18,143 |
| – Long to Short Ratio: | 2.8 to 1 | 0.6 to 1 | 0.6 to 1 |
| NET POSITION TREND: | |||
| – COT Index Score (3 Year Range Pct): | 94.4 | 22.4 | 43.6 |
| – COT Index Reading (3 Year Range): | Bullish-Extreme | Bearish | Bearish |
| NET POSITION MOVEMENT INDEX: | |||
| – 6-Week Change in Strength Index: | 25.5 | -11.8 | -14.8 |
Canadian Dollar Futures:
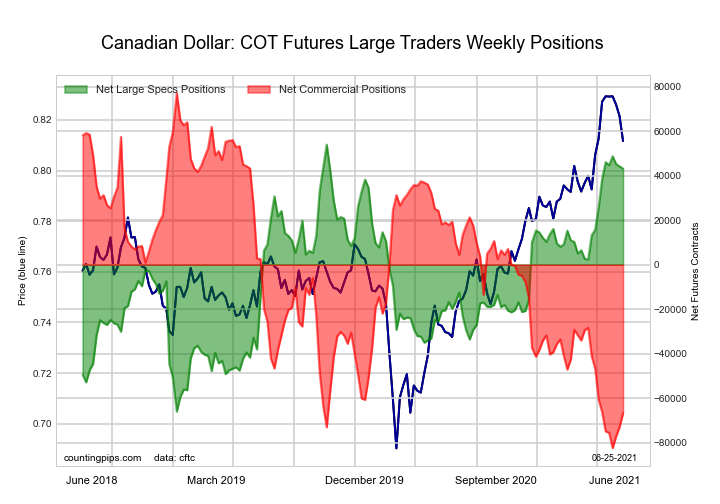 The Canadian Dollar large speculator standing this week resulted in a net position of 43,225 contracts in the data reported through Tuesday. This was a weekly fall of -1,029 contracts from the previous week which had a total of 44,254 net contracts.
This week’s current strength score (the trader positioning range over the past three years, measured from 0 to 100) shows the speculators are currently Bullish-Extreme with a score of 91.0 percent. The commercials are Bearish-Extreme with a score of 9.9 percent and the small traders (not shown in chart) are Bullish-Extreme with a score of 82.2 percent.
| CANADIAN DOLLAR Statistics | SPECULATORS | COMMERCIALS | SMALL TRADERS |
| – Percent of Open Interest Longs: | 34.1 | 43.6 | 21.2 |
| – Percent of Open Interest Shorts: | 12.7 | 76.5 | 9.7 |
| – Net Position: | 43,225 | -66,690 | 23,465 |
| – Gross Longs: | 69,074 | 88,461 | 43,060 |
| – Gross Shorts: | 25,849 | 155,151 | 19,595 |
| – Long to Short Ratio: | 2.7 to 1 | 0.6 to 1 | 2.2 to 1 |
| NET POSITION TREND: | |||
| – COT Index Score (3 Year Range Pct): | 91.0 | 9.9 | 82.2 |
| – COT Index Reading (3 Year Range): | Bullish-Extreme | Bearish-Extreme | Bullish-Extreme |
| NET POSITION MOVEMENT INDEX: | |||
| – 6-Week Change in Strength Index: | 3.8 | -0.3 | -6.3 |
Australian Dollar Futures:
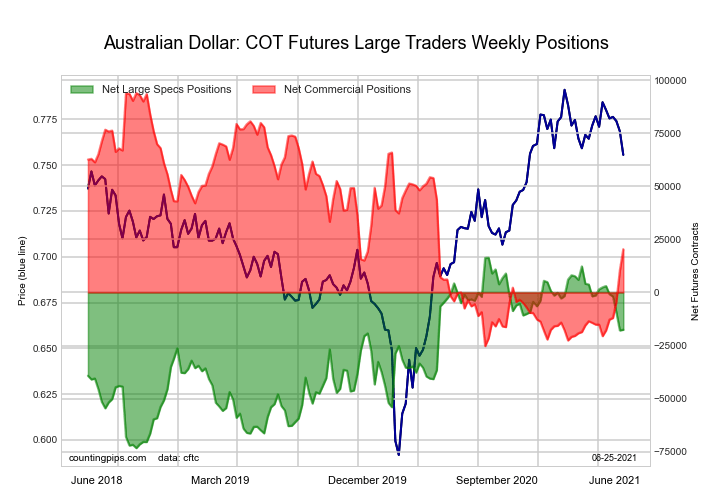 The Australian Dollar large speculator standing this week resulted in a net position of -17,575 contracts in the data reported through Tuesday. This was a weekly lift of 305 contracts from the previous week which had a total of -17,880 net contracts.
This week’s current strength score (the trader positioning range over the past three years, measured from 0 to 100) shows the speculators are currently Bullish with a score of 62.2 percent. The commercials are Bearish with a score of 38.3 percent and the small traders (not shown in chart) are Bullish with a score of 51.0 percent.
| AUSTRALIAN DOLLAR Statistics | SPECULATORS | COMMERCIALS | SMALL TRADERS |
| – Percent of Open Interest Longs: | 38.0 | 45.9 | 14.9 |
| – Percent of Open Interest Shorts: | 49.9 | 32.2 | 16.8 |
| – Net Position: | -17,575 | 20,348 | -2,773 |
| – Gross Longs: | 56,133 | 67,907 | 22,094 |
| – Gross Shorts: | 73,708 | 47,559 | 24,867 |
| – Long to Short Ratio: | 0.8 to 1 | 1.4 to 1 | 0.9 to 1 |
| NET POSITION TREND: | |||
| – COT Index Score (3 Year Range Pct): | 62.2 | 38.3 | 51.0 |
| – COT Index Reading (3 Year Range): | Bullish | Bearish | Bullish |
| NET POSITION MOVEMENT INDEX: | |||
| – 6-Week Change in Strength Index: | -22.3 | 34.3 | -46.0 |
New Zealand Dollar Futures:
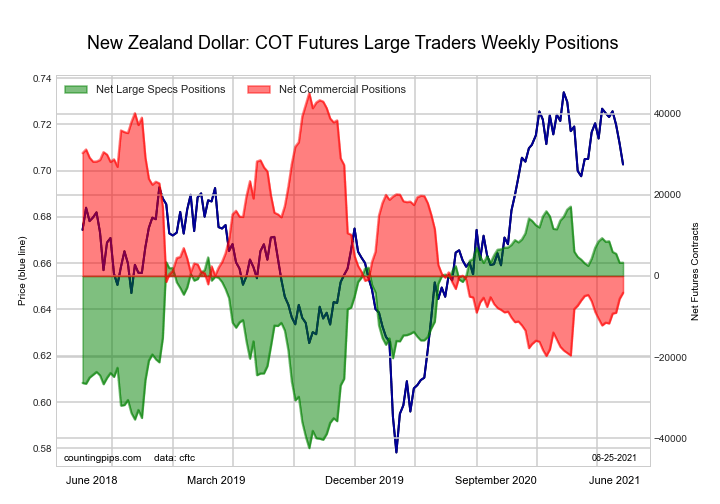 The New Zealand Dollar large speculator standing this week resulted in a net position of 3,286 contracts in the data reported through Tuesday. This was a weekly lift of 21 contracts from the previous week which had a total of 3,265 net contracts.
This week’s current strength score (the trader positioning range over the past three years, measured from 0 to 100) shows the speculators are currently Bullish with a score of 76.8 percent. The commercials are Bearish with a score of 24.0 percent and the small traders (not shown in chart) are Bullish with a score of 62.8 percent.
| NEW ZEALAND DOLLAR Statistics | SPECULATORS | COMMERCIALS | SMALL TRADERS |
| – Percent of Open Interest Longs: | 48.8 | 37.3 | 11.7 |
| – Percent of Open Interest Shorts: | 40.4 | 47.8 | 9.6 |
| – Net Position: | 3,286 | -4,130 | 844 |
| – Gross Longs: | 19,171 | 14,655 | 4,615 |
| – Gross Shorts: | 15,885 | 18,785 | 3,771 |
| – Long to Short Ratio: | 1.2 to 1 | 0.8 to 1 | 1.2 to 1 |
| NET POSITION TREND: | |||
| – COT Index Score (3 Year Range Pct): | 76.8 | 24.0 | 62.8 |
| – COT Index Reading (3 Year Range): | Bullish | Bearish | Bullish |
| NET POSITION MOVEMENT INDEX: | |||
| – 6-Week Change in Strength Index: | -10.2 | 12.4 | -22.2 |
Mexican Peso Futures:
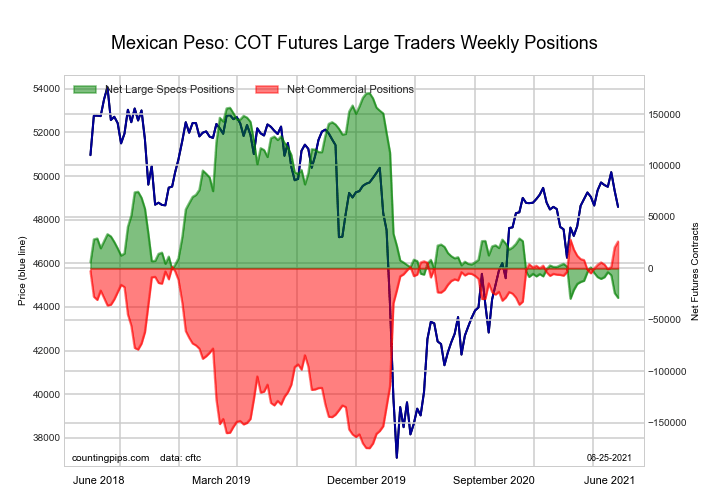 The Mexican Peso large speculator standing this week resulted in a net position of -28,591 contracts in the data reported through Tuesday. This was a weekly reduction of -4,661 contracts from the previous week which had a total of -23,930 net contracts.
This week’s current strength score (the trader positioning range over the past three years, measured from 0 to 100) shows the speculators are currently Bearish-Extreme with a score of 0.4 percent. The commercials are Bullish-Extreme with a score of 99.0 percent and the small traders (not shown in chart) are Bullish with a score of 53.6 percent.
| MEXICAN PESO Statistics | SPECULATORS | COMMERCIALS | SMALL TRADERS |
| – Percent of Open Interest Longs: | 44.3 | 50.4 | 4.3 |
| – Percent of Open Interest Shorts: | 64.7 | 31.8 | 2.5 |
| – Net Position: | -28,591 | 26,095 | 2,496 |
| – Gross Longs: | 61,955 | 70,553 | 5,973 |
| – Gross Shorts: | 90,546 | 44,458 | 3,477 |
| – Long to Short Ratio: | 0.7 to 1 | 1.6 to 1 | 1.7 to 1 |
| NET POSITION TREND: | |||
| – COT Index Score (3 Year Range Pct): | 0.4 | 99.0 | 53.6 |
| – COT Index Reading (3 Year Range): | Bearish-Extreme | Bullish-Extreme | Bullish |
| NET POSITION MOVEMENT INDEX: | |||
| – 6-Week Change in Strength Index: | -10.1 | 11.2 | -10.8 |
Brazilian Real Futures:
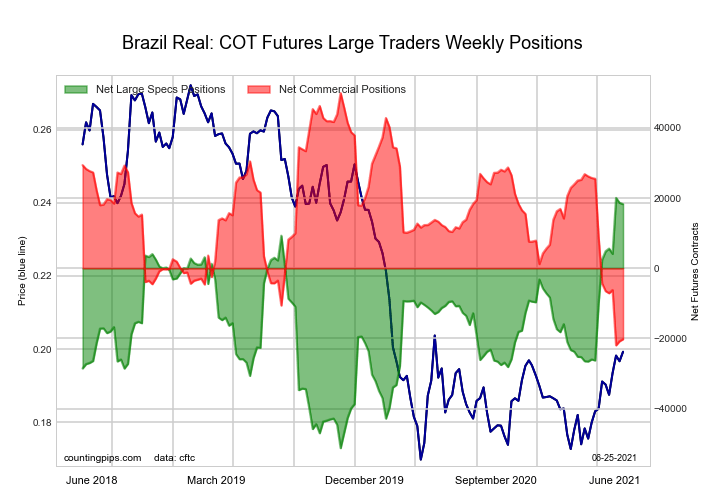 The Brazilian Real large speculator standing this week resulted in a net position of 18,265 contracts in the data reported through Tuesday. This was a weekly lowering of -394 contracts from the previous week which had a total of 18,659 net contracts.
This week’s current strength score (the trader positioning range over the past three years, measured from 0 to 100) shows the speculators are currently Bullish-Extreme with a score of 97.5 percent. The commercials are Bearish-Extreme with a score of 2.4 percent and the small traders (not shown in chart) are Bullish-Extreme with a score of 96.6 percent.
| BRAZIL REAL Statistics | SPECULATORS | COMMERCIALS | SMALL TRADERS |
| – Percent of Open Interest Longs: | 65.4 | 21.4 | 12.8 |
| – Percent of Open Interest Shorts: | 22.0 | 69.5 | 8.1 |
| – Net Position: | 18,265 | -20,239 | 1,974 |
| – Gross Longs: | 27,540 | 9,002 | 5,390 |
| – Gross Shorts: | 9,275 | 29,241 | 3,416 |
| – Long to Short Ratio: | 3.0 to 1 | 0.3 to 1 | 1.6 to 1 |
| NET POSITION TREND: | |||
| – COT Index Score (3 Year Range Pct): | 97.5 | 2.4 | 96.6 |
| – COT Index Reading (3 Year Range): | Bullish-Extreme | Bearish-Extreme | Bullish-Extreme |
| NET POSITION MOVEMENT INDEX: | |||
| – 6-Week Change in Strength Index: | 22.1 | -22.1 | 1.9 |
Russian Ruble Futures:
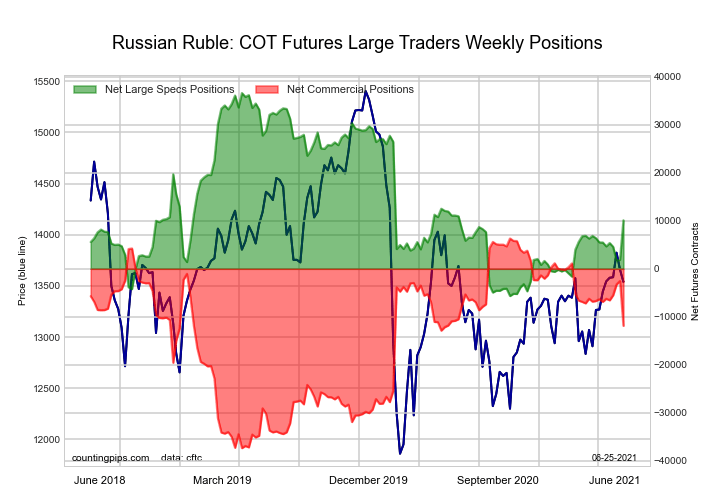 The Russian Ruble large speculator standing this week resulted in a net position of 10,096 contracts in the data reported through Tuesday. This was a weekly lift of 8,192 contracts from the previous week which had a total of 1,904 net contracts.
This week’s current strength score (the trader positioning range over the past three years, measured from 0 to 100) shows the speculators are currently Bearish with a score of 37.3 percent. The commercials are Bullish with a score of 58.4 percent and the small traders (not shown in chart) are Bullish-Extreme with a score of 100.0 percent.
| RUSSIAN RUBLE Statistics | SPECULATORS | COMMERCIALS | SMALL TRADERS |
| – Percent of Open Interest Longs: | 38.9 | 54.5 | 6.6 |
| – Percent of Open Interest Shorts: | 13.6 | 84.3 | 2.2 |
| – Net Position: | 10,096 | -11,859 | 1,763 |
| – Gross Longs: | 15,495 | 21,690 | 2,633 |
| – Gross Shorts: | 5,399 | 33,549 | 870 |
| – Long to Short Ratio: | 2.9 to 1 | 0.6 to 1 | 3.0 to 1 |
| NET POSITION TREND: | |||
| – COT Index Score (3 Year Range Pct): | 37.3 | 58.4 | 100.0 |
| – COT Index Reading (3 Year Range): | Bearish | Bullish | Bullish-Extreme |
| NET POSITION MOVEMENT INDEX: | |||
| – 6-Week Change in Strength Index: | 10.9 | -11.5 | 12.6 |
Bitcoin Futures:
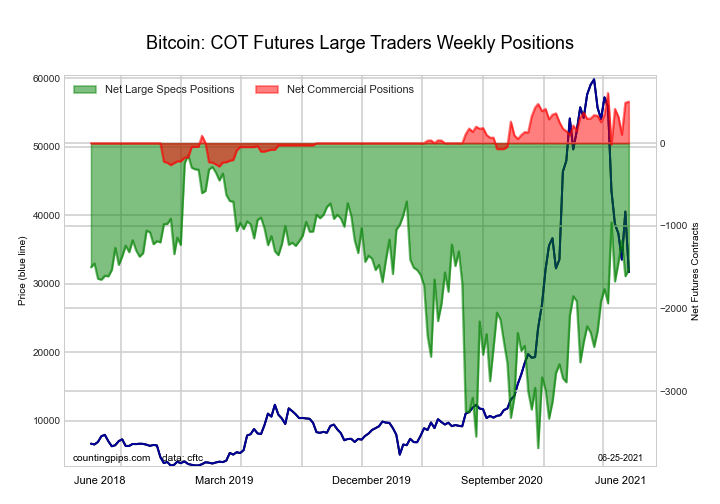 The Bitcoin large speculator standing this week resulted in a net position of -1,528 contracts in the data reported through Tuesday. This was a weekly lift of 81 contracts from the previous week which had a total of -1,609 net contracts.
This week’s current strength score (the trader positioning range over the past three years, measured from 0 to 100) shows the speculators are currently Bullish with a score of 60.9 percent. The commercials are Bullish-Extreme with a score of 88.3 percent and the small traders (not shown in chart) are Bearish with a score of 23.4 percent.
| BITCOIN Statistics | SPECULATORS | COMMERCIALS | SMALL TRADERS |
| – Percent of Open Interest Longs: | 56.9 | 8.2 | 24.2 |
| – Percent of Open Interest Shorts: | 76.2 | 1.8 | 11.2 |
| – Net Position: | -1,528 | 503 | 1,025 |
| – Gross Longs: | 4,502 | 645 | 1,913 |
| – Gross Shorts: | 6,030 | 142 | 888 |
| – Long to Short Ratio: | 0.7 to 1 | 4.5 to 1 | 2.2 to 1 |
| NET POSITION TREND: | |||
| – COT Index Score (3 Year Range Pct): | 60.9 | 88.3 | 23.4 |
| – COT Index Reading (3 Year Range): | Bullish | Bullish-Extreme | Bearish |
| NET POSITION MOVEMENT INDEX: | |||
| – 6-Week Change in Strength Index: | 11.6 | -11.7 | -10.1 |
Article By CountingPips.com – Receive our weekly COT Reports by Email
*COT Report: The COT data, released weekly to the public each Friday, is updated through the most recent Tuesday (data is 3 days old) and shows a quick view of how large speculators or non-commercials (for-profit traders) were positioned in the futures markets.
The CFTC categorizes trader positions according to commercial hedgers (traders who use futures contracts for hedging as part of the business), non-commercials (large traders who speculate to realize trading profits) and nonreportable traders (usually small traders/speculators).
Find CFTC criteria here: (http://www.cftc.gov/MarketReports/CommitmentsofTraders/ExplanatoryNotes/index.htm).

- GBP/USD at Month’s Lows: The Outlook Remains Weak Jul 29, 2026
- Crude oil falls below $80 per barrel. Australia sees inflation slowdown Jul 29, 2026
- The US Tech sector hit by sell‑off. Oil prices decline on renewed negotiations Jul 28, 2026
- Gold Declines, Focus on Fed and Falling Oil Prices Jul 28, 2026
- This week will be one of the most crowded for central‑bank meetings Jul 27, 2026
- EUR/USD Ahead of a Key Week: Holding Near Lows Jul 27, 2026
- COT Metals Charts: Weekly Speculator Changes led by Copper Jul 26, 2026
- COT Bonds Charts: Speculator Bets led by SOFR 3-Months & 5-Year Bonds Jul 26, 2026
- COT Energy Charts: Weekly Speculator Bets led by WTI Crude & Natural Gas Jul 26, 2026
- COT Soft Commodities Charts: Weekly Speculator Bets led by Corn & Soybeans Jul 26, 2026