
By CountingPips.com COT Home | Data Tables | Data Downloads | Newsletter
Here are the latest charts and statistics for the Commitment of Traders (COT) data published by the Commodities Futures Trading Commission (CFTC).
The latest COT data is updated through Tuesday June 22 2021 and shows a quick view of how large traders (for-profit speculators and commercial entities) were positioned in the futures markets.
3-Month Eurodollars Futures:
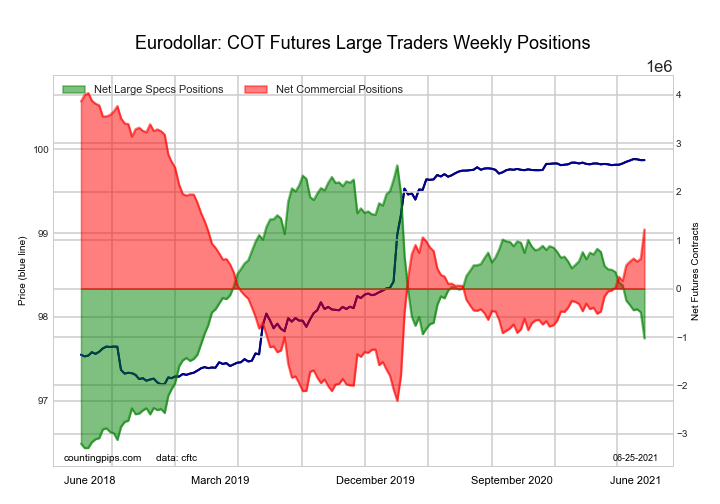 The 3-Month Eurodollars large speculator standing this week equaled a net position of -1,027,697 contracts in the data reported through Tuesday. This was a weekly fall of -539,388 contracts from the previous week which had a total of -488,309 net contracts.
This week’s current strength score (the trader positioning range over the past three years, measured from 0 to 100) shows the speculators are currently Bearish with a score of 38.8 percent. The commercials are Bullish with a score of 55.7 percent and the small traders (not shown in chart) are Bullish with a score of 77.8 percent.
| 3-Month Eurodollars Statistics | SPECULATORS | COMMERCIALS | SMALL TRADERS |
| – Percent of Open Interest Longs: | 14.6 | 59.3 | 5.0 |
| – Percent of Open Interest Shorts: | 23.0 | 49.3 | 6.6 |
| – Net Position: | -1,027,697 | 1,219,992 | -192,295 |
| – Gross Longs: | 1,777,412 | 7,230,673 | 607,765 |
| – Gross Shorts: | 2,805,109 | 6,010,681 | 800,060 |
| – Long to Short Ratio: | 0.6 to 1 | 1.2 to 1 | 0.8 to 1 |
| NET POSITION TREND: | |||
| – COT Index Score (3 Year Range Pct): | 38.8 | 55.7 | 77.8 |
| – COT Index Reading (3 Year Range): | Bearish | Bullish | Bullish |
| NET POSITION MOVEMENT INDEX: | |||
| – 6-Week Change in Strength Index: | -18.8 | 16.8 | 4.3 |
Free Reports:
 Get our Weekly Commitment of Traders Reports - See where the biggest traders (Hedge Funds and Commercial Hedgers) are positioned in the futures markets on a weekly basis.
 Download Our Metatrader 4 Indicators – Put Our Free MetaTrader 4 Custom Indicators on your charts when you join our Weekly Newsletter
30-Day Federal Funds Futures:
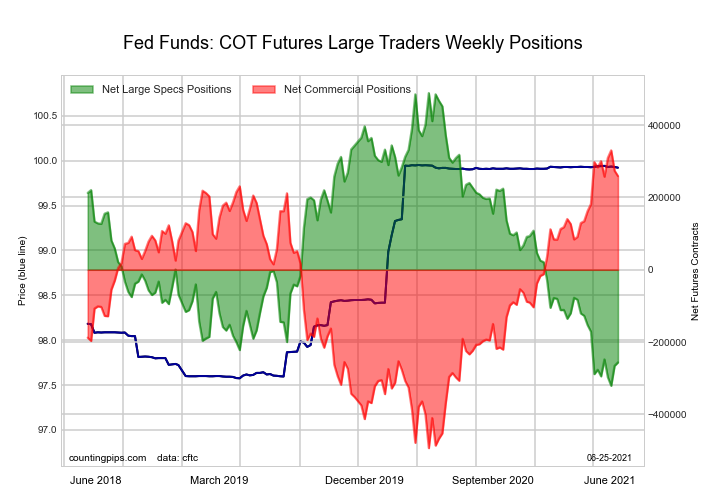 The 30-Day Federal Funds large speculator standing this week equaled a net position of -256,308 contracts in the data reported through Tuesday. This was a weekly gain of 9,371 contracts from the previous week which had a total of -265,679 net contracts.
This week’s current strength score (the trader positioning range over the past three years, measured from 0 to 100) shows the speculators are currently Bearish-Extreme with a score of 8.0 percent. The commercials are Bullish-Extreme with a score of 91.4 percent and the small traders (not shown in chart) are Bullish with a score of 65.5 percent.
| 30-Day Federal Funds Statistics | SPECULATORS | COMMERCIALS | SMALL TRADERS |
| – Percent of Open Interest Longs: | 2.3 | 79.9 | 2.7 |
| – Percent of Open Interest Shorts: | 26.2 | 55.7 | 3.0 |
| – Net Position: | -256,308 | 259,381 | -3,073 |
| – Gross Longs: | 25,000 | 856,205 | 29,216 |
| – Gross Shorts: | 281,308 | 596,824 | 32,289 |
| – Long to Short Ratio: | 0.1 to 1 | 1.4 to 1 | 0.9 to 1 |
| NET POSITION TREND: | |||
| – COT Index Score (3 Year Range Pct): | 8.0 | 91.4 | 65.5 |
| – COT Index Reading (3 Year Range): | Bearish-Extreme | Bullish-Extreme | Bullish |
| NET POSITION MOVEMENT INDEX: | |||
| – 6-Week Change in Strength Index: | 2.5 | -2.9 | 7.0 |
2-Year Treasury Note Futures:
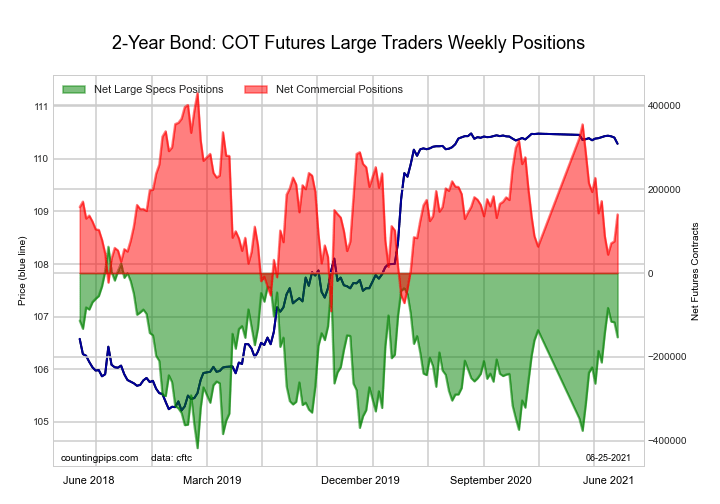 The 2-Year Treasury Note large speculator standing this week equaled a net position of -152,907 contracts in the data reported through Tuesday. This was a weekly lowering of -35,967 contracts from the previous week which had a total of -116,940 net contracts.
This week’s current strength score (the trader positioning range over the past three years, measured from 0 to 100) shows the speculators are currently Bullish with a score of 63.4 percent. The commercials are Bearish with a score of 44.4 percent and the small traders (not shown in chart) are Bearish with a score of 41.6 percent.
| 2-Year Treasury Note Statistics | SPECULATORS | COMMERCIALS | SMALL TRADERS |
| – Percent of Open Interest Longs: | 18.6 | 71.7 | 6.8 |
| – Percent of Open Interest Shorts: | 26.0 | 64.9 | 6.2 |
| – Net Position: | -152,907 | 140,046 | 12,861 |
| – Gross Longs: | 382,165 | 1,472,663 | 140,292 |
| – Gross Shorts: | 535,072 | 1,332,617 | 127,431 |
| – Long to Short Ratio: | 0.7 to 1 | 1.1 to 1 | 1.1 to 1 |
| NET POSITION TREND: | |||
| – COT Index Score (3 Year Range Pct): | 63.4 | 44.4 | 41.6 |
| – COT Index Reading (3 Year Range): | Bullish | Bearish | Bearish |
| NET POSITION MOVEMENT INDEX: | |||
| – 6-Week Change in Strength Index: | 7.8 | -0.5 | -15.8 |
5-Year Treasury Note Futures:
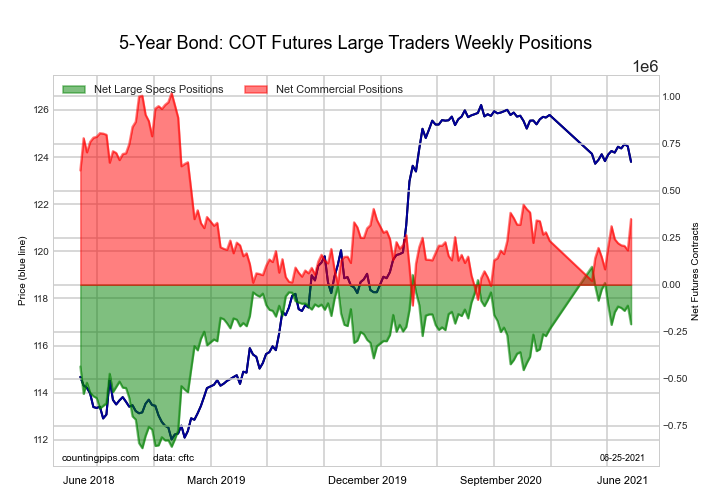 The 5-Year Treasury Note large speculator standing this week equaled a net position of -209,526 contracts in the data reported through Tuesday. This was a weekly reduction of -98,508 contracts from the previous week which had a total of -111,018 net contracts.
This week’s current strength score (the trader positioning range over the past three years, measured from 0 to 100) shows the speculators are currently Bullish with a score of 68.3 percent. The commercials are Bearish with a score of 40.7 percent and the small traders (not shown in chart) are Bearish-Extreme with a score of 8.1 percent.
| 5-Year Treasury Note Statistics | SPECULATORS | COMMERCIALS | SMALL TRADERS |
| – Percent of Open Interest Longs: | 11.5 | 79.0 | 7.9 |
| – Percent of Open Interest Shorts: | 17.6 | 68.8 | 11.9 |
| – Net Position: | -209,526 | 349,248 | -139,722 |
| – Gross Longs: | 397,254 | 2,721,853 | 271,622 |
| – Gross Shorts: | 606,780 | 2,372,605 | 411,344 |
| – Long to Short Ratio: | 0.7 to 1 | 1.1 to 1 | 0.7 to 1 |
| NET POSITION TREND: | |||
| – COT Index Score (3 Year Range Pct): | 68.3 | 40.7 | 8.1 |
| – COT Index Reading (3 Year Range): | Bullish | Bearish | Bearish-Extreme |
| NET POSITION MOVEMENT INDEX: | |||
| – 6-Week Change in Strength Index: | 0.3 | 3.4 | -18.2 |
10-Year Treasury Note Futures:
 The 10-Year Treasury Note large speculator standing this week equaled a net position of -2,312 contracts in the data reported through Tuesday. This was a weekly decline of -36,648 contracts from the previous week which had a total of 34,336 net contracts.
This week’s current strength score (the trader positioning range over the past three years, measured from 0 to 100) shows the speculators are currently Bullish-Extreme with a score of 81.1 percent. The commercials are Bearish with a score of 43.1 percent and the small traders (not shown in chart) are Bearish-Extreme with a score of 5.0 percent.
| 10-Year Treasury Note Statistics | SPECULATORS | COMMERCIALS | SMALL TRADERS |
| – Percent of Open Interest Longs: | 20.4 | 71.0 | 7.1 |
| – Percent of Open Interest Shorts: | 20.4 | 64.8 | 13.2 |
| – Net Position: | -2,312 | 263,172 | -260,860 |
| – Gross Longs: | 870,032 | 3,031,108 | 303,180 |
| – Gross Shorts: | 872,344 | 2,767,936 | 564,040 |
| – Long to Short Ratio: | 1.0 to 1 | 1.1 to 1 | 0.5 to 1 |
| NET POSITION TREND: | |||
| – COT Index Score (3 Year Range Pct): | 81.1 | 43.1 | 5.0 |
| – COT Index Reading (3 Year Range): | Bullish-Extreme | Bearish | Bearish-Extreme |
| NET POSITION MOVEMENT INDEX: | |||
| – 6-Week Change in Strength Index: | -0.4 | 1.3 | -2.8 |
Ultra 10-Year Notes Futures:
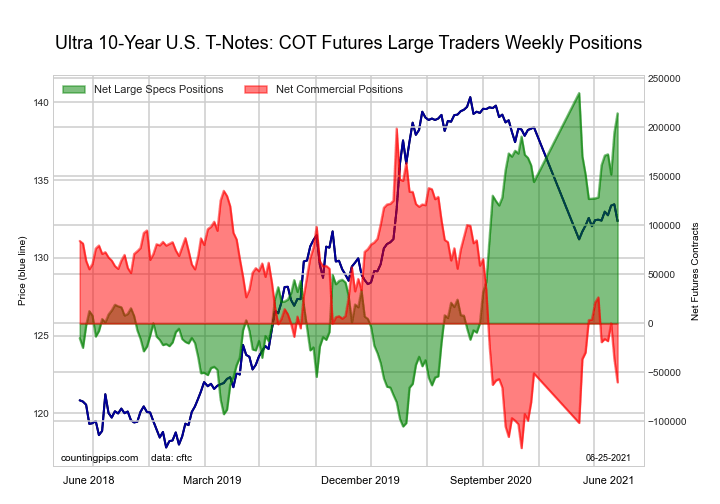 The Ultra 10-Year Notes large speculator standing this week equaled a net position of 214,461 contracts in the data reported through Tuesday. This was a weekly increase of 19,854 contracts from the previous week which had a total of 194,607 net contracts.
This week’s current strength score (the trader positioning range over the past three years, measured from 0 to 100) shows the speculators are currently Bullish-Extreme with a score of 84.4 percent. The commercials are Bearish with a score of 27.4 percent and the small traders (not shown in chart) are Bearish-Extreme with a score of 2.9 percent.
| Ultra 10-Year Notes Statistics | SPECULATORS | COMMERCIALS | SMALL TRADERS |
| – Percent of Open Interest Longs: | 20.1 | 72.0 | 7.6 |
| – Percent of Open Interest Shorts: | 6.0 | 75.9 | 17.8 |
| – Net Position: | 214,461 | -60,111 | -154,350 |
| – Gross Longs: | 305,059 | 1,092,678 | 115,510 |
| – Gross Shorts: | 90,598 | 1,152,789 | 269,860 |
| – Long to Short Ratio: | 3.4 to 1 | 0.9 to 1 | 0.4 to 1 |
| NET POSITION TREND: | |||
| – COT Index Score (3 Year Range Pct): | 84.4 | 27.4 | 2.9 |
| – COT Index Reading (3 Year Range): | Bullish-Extreme | Bearish | Bearish-Extreme |
| NET POSITION MOVEMENT INDEX: | |||
| – 6-Week Change in Strength Index: | 22.7 | -24.3 | 0.8 |
US Treasury Bonds Futures:
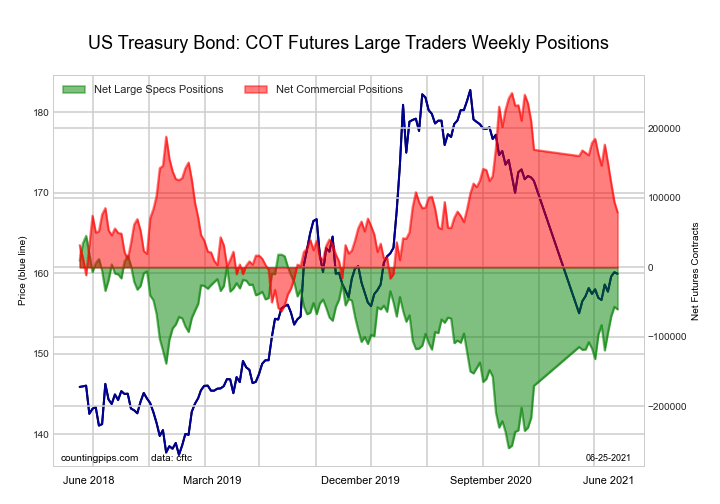 The US Treasury Bonds large speculator standing this week equaled a net position of -60,354 contracts in the data reported through Tuesday. This was a weekly reduction of -3,667 contracts from the previous week which had a total of -56,687 net contracts.
This week’s current strength score (the trader positioning range over the past three years, measured from 0 to 100) shows the speculators are currently Bullish with a score of 71.7 percent. The commercials are Bearish with a score of 45.3 percent and the small traders (not shown in chart) are Bearish with a score of 37.8 percent.
| US Treasury Bonds Statistics | SPECULATORS | COMMERCIALS | SMALL TRADERS |
| – Percent of Open Interest Longs: | 9.3 | 74.1 | 14.3 |
| – Percent of Open Interest Shorts: | 14.4 | 67.4 | 15.9 |
| – Net Position: | -60,354 | 78,959 | -18,605 |
| – Gross Longs: | 109,167 | 873,996 | 168,398 |
| – Gross Shorts: | 169,521 | 795,037 | 187,003 |
| – Long to Short Ratio: | 0.6 to 1 | 1.1 to 1 | 0.9 to 1 |
| NET POSITION TREND: | |||
| – COT Index Score (3 Year Range Pct): | 71.7 | 45.3 | 37.8 |
| – COT Index Reading (3 Year Range): | Bullish | Bearish | Bearish |
| NET POSITION MOVEMENT INDEX: | |||
| – 6-Week Change in Strength Index: | 13.0 | -26.7 | 37.8 |
Ultra US Treasury Bonds Futures:
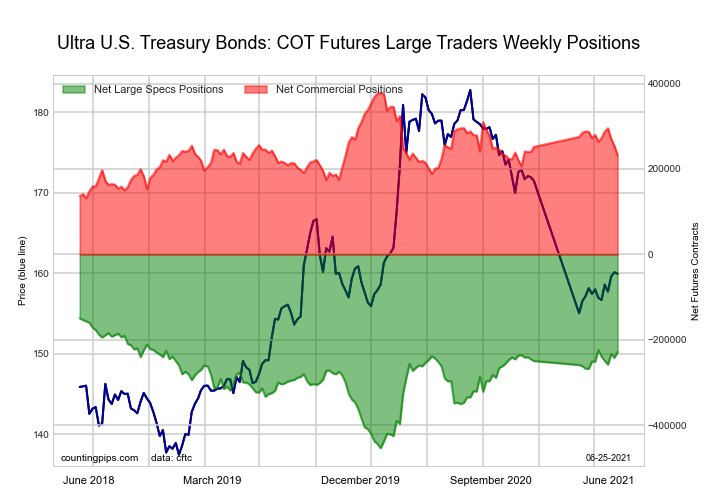 The Ultra US Treasury Bonds large speculator standing this week equaled a net position of -228,949 contracts in the data reported through Tuesday. This was a weekly advance of 13,460 contracts from the previous week which had a total of -242,409 net contracts.
This week’s current strength score (the trader positioning range over the past three years, measured from 0 to 100) shows the speculators are currently Bullish-Extreme with a score of 85.5 percent. The commercials are Bearish with a score of 36.1 percent and the small traders (not shown in chart) are Bearish with a score of 25.9 percent.
| Ultra US Treasury Bonds Statistics | SPECULATORS | COMMERCIALS | SMALL TRADERS |
| – Percent of Open Interest Longs: | 8.6 | 79.1 | 12.0 |
| – Percent of Open Interest Shorts: | 27.7 | 59.7 | 12.2 |
| – Net Position: | -228,949 | 232,264 | -3,315 |
| – Gross Longs: | 102,926 | 947,822 | 143,231 |
| – Gross Shorts: | 331,875 | 715,558 | 146,546 |
| – Long to Short Ratio: | 0.3 to 1 | 1.3 to 1 | 1.0 to 1 |
| NET POSITION TREND: | |||
| – COT Index Score (3 Year Range Pct): | 85.5 | 36.1 | 25.9 |
| – COT Index Reading (3 Year Range): | Bullish-Extreme | Bearish | Bearish |
| NET POSITION MOVEMENT INDEX: | |||
| – 6-Week Change in Strength Index: | -1.7 | -13.8 | 25.9 |
Article By CountingPips.com – Receive our weekly COT Reports by Email
*COT Report: The COT data, released weekly to the public each Friday, is updated through the most recent Tuesday (data is 3 days old) and shows a quick view of how large speculators or non-commercials (for-profit traders) were positioned in the futures markets.
The CFTC categorizes trader positions according to commercial hedgers (traders who use futures contracts for hedging as part of the business), non-commercials (large traders who speculate to realize trading profits) and nonreportable traders (usually small traders/speculators).
Find CFTC criteria here: (http://www.cftc.gov/MarketReports/CommitmentsofTraders/ExplanatoryNotes/index.htm).

- GBP/USD at Month’s Lows: The Outlook Remains Weak Jul 29, 2026
- Crude oil falls below $80 per barrel. Australia sees inflation slowdown Jul 29, 2026
- The US Tech sector hit by sell‑off. Oil prices decline on renewed negotiations Jul 28, 2026
- Gold Declines, Focus on Fed and Falling Oil Prices Jul 28, 2026
- This week will be one of the most crowded for central‑bank meetings Jul 27, 2026
- EUR/USD Ahead of a Key Week: Holding Near Lows Jul 27, 2026
- COT Metals Charts: Weekly Speculator Changes led by Copper Jul 26, 2026
- COT Bonds Charts: Speculator Bets led by SOFR 3-Months & 5-Year Bonds Jul 26, 2026
- COT Energy Charts: Weekly Speculator Bets led by WTI Crude & Natural Gas Jul 26, 2026
- COT Soft Commodities Charts: Weekly Speculator Bets led by Corn & Soybeans Jul 26, 2026