COT Currency Futures Charts: Dollars, Euro, Yen, Pound, Kiwi, Loonie, Peso

By CountingPips.com COT Home | Data Tables | Data Downloads | Newsletter

Here are the latest charts and statistics for the Commitment of Traders (COT) data published by the Commodities Futures Trading Commission (CFTC).

The latest COT data is updated through Tuesday August 17 2021 and shows a quick view of how large traders (for-profit speculators and commercial entities) were positioned in the futures markets. All currency positions are in direct relation to the US dollar where, for example, a bet for the euro is a bet that the euro will rise versus the dollar while a bet against the euro will be a bet that the euro will decline versus the dollar.


US Dollar Index Futures:
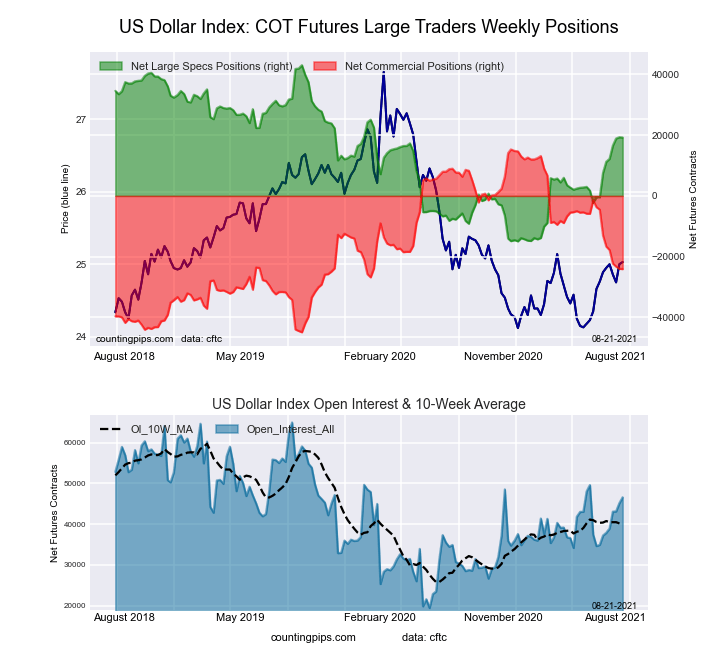
Federal Funds 30-Day Bonds Futures COT ChartThe US Dollar Index large speculator standing this week was a net position of 19,211 contracts in the data reported through Tuesday. This was a weekly reduction of -115 contracts from the previous week which had a total of 19,326 net contracts.

This week’s current strength score (the trader positioning range over the past three years, measured from 0 to 100) shows the speculators are currently Bullish with a score of 58.9 percent. The commercials are Bearish with a score of 34.6 percent and the small traders (not shown in chart) are Bullish-Extreme with a score of 83.3 percent.

US DOLLAR INDEX StatisticsSPECULATORSCOMMERCIALSSMALL TRADERS
– Percent of Open Interest Longs:76.13.515.1
– Percent of Open Interest Shorts:34.955.24.6
– Net Position:19,211-24,0894,878
– Gross Longs:35,4601,6437,014
– Gross Shorts:16,24925,7322,136
– Long to Short Ratio:2.2 to 10.1 to 13.3 to 1
NET POSITION TREND:
– COT Index Score (3 Year Range Pct):58.934.683.3
– COT Index Reading (3 Year Range):BullishBearishBullish-Extreme
NET POSITION MOVEMENT INDEX:
– 6-Week Change in Strength Index:20.1-18.4-7.5


Euro Currency Futures:

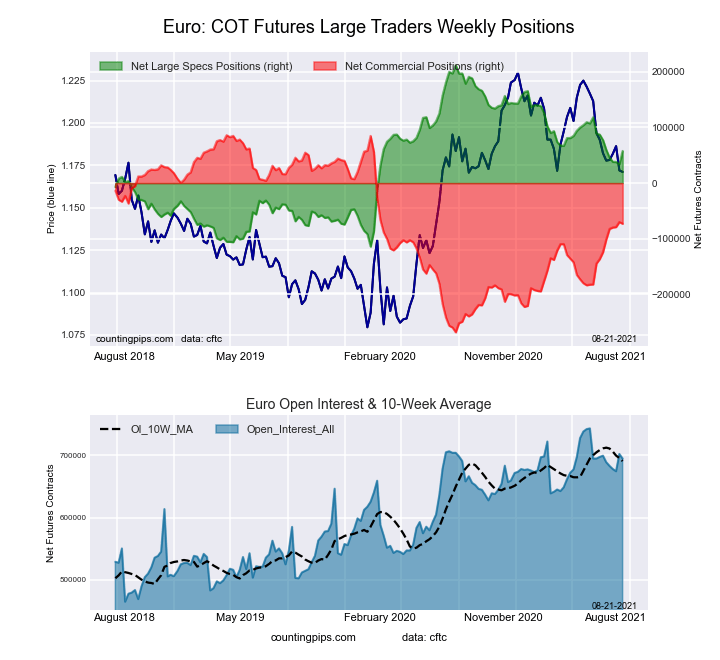
2-Year Treasury Bonds Futures COT ChartThe Euro Currency large speculator standing this week was a net position of 57,640 contracts in the data reported through Tuesday. This was a weekly increase of 23,783 contracts from the previous week which had a total of 33,857 net contracts.

This week’s current strength score (the trader positioning range over the past three years, measured from 0 to 100) shows the speculators are currently Bullish with a score of 52.7 percent. The commercials are Bullish with a score of 55.1 percent and the small traders (not shown in chart) are Bearish-Extreme with a score of 4.4 percent.

EURO Currency StatisticsSPECULATORSCOMMERCIALSSMALL TRADERS
– Percent of Open Interest Longs:33.655.210.1
– Percent of Open Interest Shorts:25.365.77.9
– Net Position:57,640-73,08315,443
– Gross Longs:233,529383,68470,047
– Gross Shorts:175,889456,76754,604
– Long to Short Ratio:1.3 to 10.8 to 11.3 to 1
NET POSITION TREND:
– COT Index Score (3 Year Range Pct):52.755.14.4
– COT Index Reading (3 Year Range):BullishBullishBearish-Extreme
NET POSITION MOVEMENT INDEX:
– 6-Week Change in Strength Index:-6.014.4-49.9


British Pound Sterling Futures:

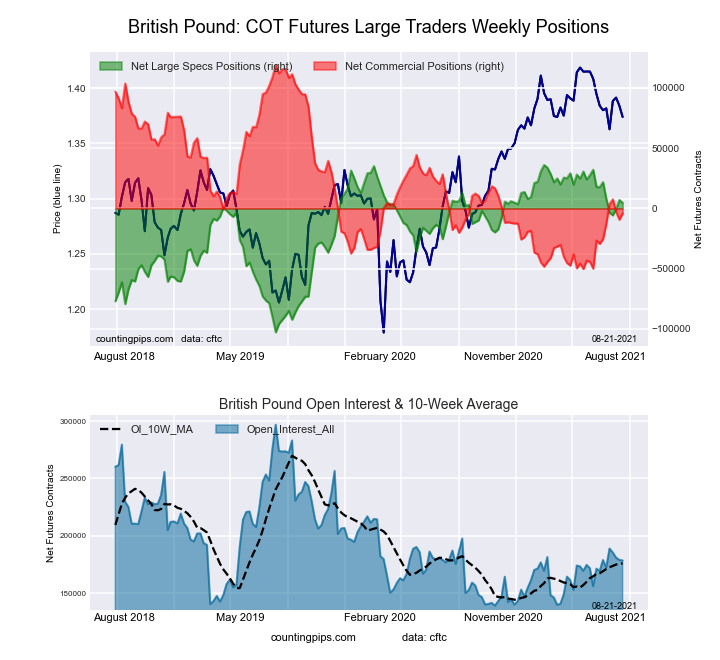
5-Year Treasury Bonds Futures COT ChartThe British Pound Sterling large speculator standing this week was a net position of 4,651 contracts in the data reported through Tuesday. This was a weekly fall of -2,419 contracts from the previous week which had a total of 7,070 net contracts.

This week’s current strength score (the trader positioning range over the past three years, measured from 0 to 100) shows the speculators are currently Bullish with a score of 77.4 percent. The commercials are Bearish with a score of 27.3 percent and the small traders (not shown in chart) are Bullish with a score of 54.4 percent.

BRITISH POUND StatisticsSPECULATORSCOMMERCIALSSMALL TRADERS
– Percent of Open Interest Longs:23.558.116.2
– Percent of Open Interest Shorts:20.960.416.6
– Net Position:4,651-4,054-597
– Gross Longs:41,898103,66728,967
– Gross Shorts:37,247107,72129,564
– Long to Short Ratio:1.1 to 11.0 to 11.0 to 1
NET POSITION TREND:
– COT Index Score (3 Year Range Pct):77.427.354.4
– COT Index Reading (3 Year Range):BullishBearishBullish
NET POSITION MOVEMENT INDEX:
– 6-Week Change in Strength Index:-12.412.6-8.6


Japanese Yen Futures:

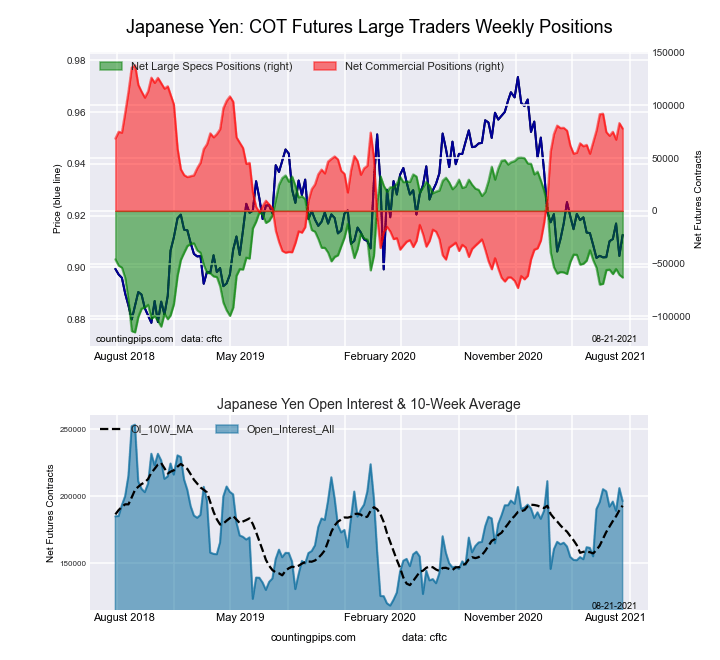
10-Year Treasury Notes Bonds Futures COT ChartThe Japanese Yen large speculator standing this week was a net position of -63,208 contracts in the data reported through Tuesday. This was a weekly reduction of -2,551 contracts from the previous week which had a total of -60,657 net contracts.

This week’s current strength score (the trader positioning range over the past three years, measured from 0 to 100) shows the speculators are currently Bearish with a score of 31.4 percent. The commercials are Bullish with a score of 71.6 percent and the small traders (not shown in chart) are Bearish with a score of 27.8 percent.

JAPANESE YEN StatisticsSPECULATORSCOMMERCIALSSMALL TRADERS
– Percent of Open Interest Longs:14.075.010.3
– Percent of Open Interest Shorts:46.235.317.8
– Net Position:-63,20878,091-14,883
– Gross Longs:27,532147,40320,156
– Gross Shorts:90,74069,31235,039
– Long to Short Ratio:0.3 to 12.1 to 10.6 to 1
NET POSITION TREND:
– COT Index Score (3 Year Range Pct):31.471.627.8
– COT Index Reading (3 Year Range):BearishBullishBearish
NET POSITION MOVEMENT INDEX:
– 6-Week Change in Strength Index:3.6-6.615.5


Swiss Franc Futures:

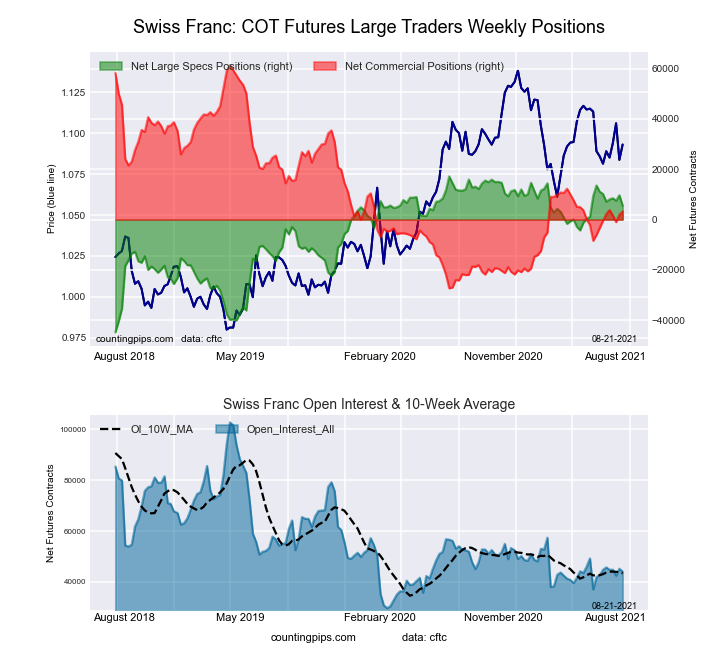
Ultra 10-Year Treasury Notes Bonds Futures COT ChartThe Swiss Franc large speculator standing this week was a net position of 5,547 contracts in the data reported through Tuesday. This was a weekly fall of -4,131 contracts from the previous week which had a total of 9,678 net contracts.

This week’s current strength score (the trader positioning range over the past three years, measured from 0 to 100) shows the speculators are currently Bullish-Extreme with a score of 81.2 percent. The commercials are Bearish with a score of 34.5 percent and the small traders (not shown in chart) are Bearish with a score of 37.4 percent.

SWISS FRANC StatisticsSPECULATORSCOMMERCIALSSMALL TRADERS
– Percent of Open Interest Longs:32.643.723.3
– Percent of Open Interest Shorts:20.036.243.4
– Net Position:5,5473,277-8,824
– Gross Longs:14,35419,21110,255
– Gross Shorts:8,80715,93419,079
– Long to Short Ratio:1.6 to 11.2 to 10.5 to 1
NET POSITION TREND:
– COT Index Score (3 Year Range Pct):81.234.537.4
– COT Index Reading (3 Year Range):Bullish-ExtremeBearishBearish
NET POSITION MOVEMENT INDEX:
– 6-Week Change in Strength Index:-7.54.22.6


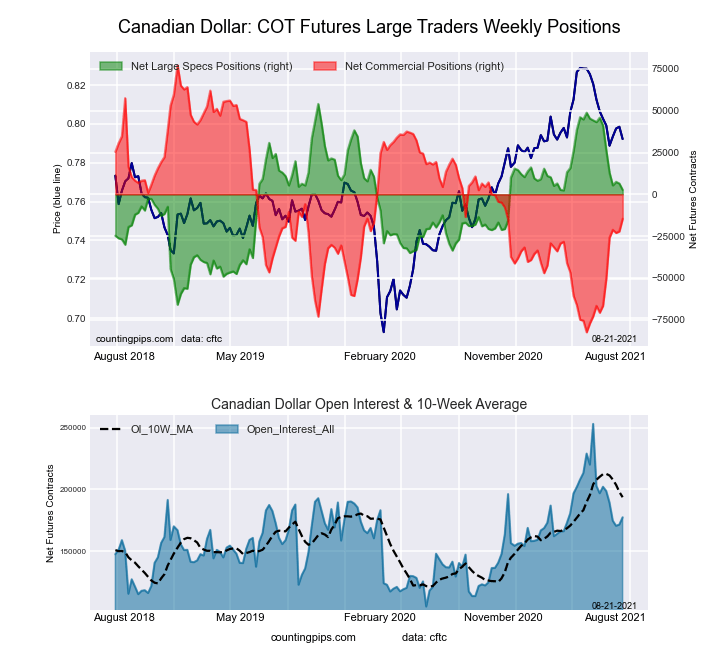
Canadian Dollar Futures:

US Year Treasury Notes Long Bonds Futures COT ChartThe Canadian Dollar large speculator standing this week was a net position of 2,660 contracts in the data reported through Tuesday. This was a weekly reduction of -3,805 contracts from the previous week which had a total of 6,465 net contracts.

This week’s current strength score (the trader positioning range over the past three years, measured from 0 to 100) shows the speculators are currently Bullish with a score of 57.2 percent. The commercials are Bearish with a score of 42.5 percent and the small traders (not shown in chart) are Bullish with a score of 64.9 percent.

CANADIAN DOLLAR StatisticsSPECULATORSCOMMERCIALSSMALL TRADERS
– Percent of Open Interest Longs:26.252.520.3
– Percent of Open Interest Shorts:24.760.813.6
– Net Position:2,660-14,64211,982
– Gross Longs:46,49993,23436,107
– Gross Shorts:43,839107,87624,125
– Long to Short Ratio:1.1 to 10.9 to 11.5 to 1
NET POSITION TREND:
– COT Index Score (3 Year Range Pct):57.242.564.9
– COT Index Reading (3 Year Range):BullishBearishBullish
NET POSITION MOVEMENT INDEX:
– 6-Week Change in Strength Index:-32.132.6-20.4


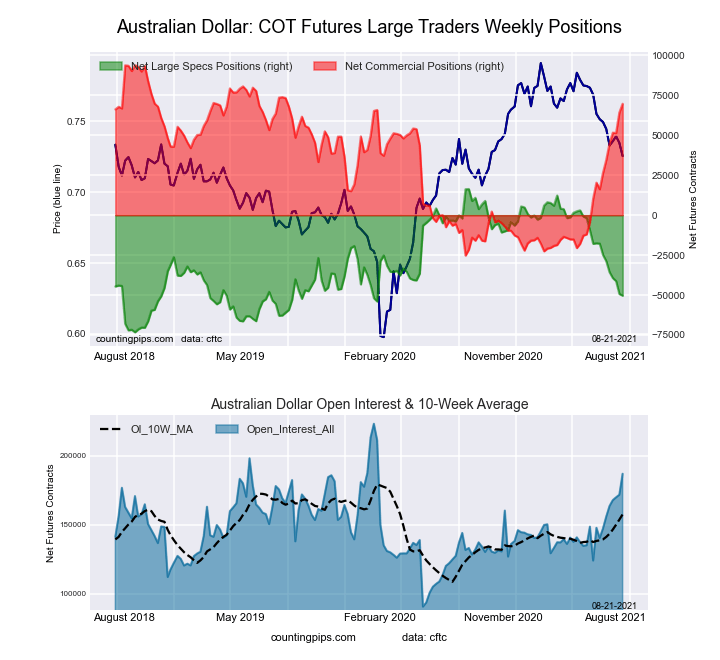
Australian Dollar Futures:

Ultra US Year Treasury Notes Long Bonds Futures COT ChartThe Australian Dollar large speculator standing this week was a net position of -50,367 contracts in the data reported through Tuesday. This was a weekly lowering of -1,054 contracts from the previous week which had a total of -49,313 net contracts.

This week’s current strength score (the trader positioning range over the past three years, measured from 0 to 100) shows the speculators are currently Bearish with a score of 25.6 percent. The commercials are Bullish with a score of 79.7 percent and the small traders (not shown in chart) are Bearish-Extreme with a score of 14.2 percent.

AUSTRALIAN DOLLAR StatisticsSPECULATORSCOMMERCIALSSMALL TRADERS
– Percent of Open Interest Longs:34.354.49.2
– Percent of Open Interest Shorts:61.317.119.6
– Net Position:-50,36769,709-19,342
– Gross Longs:64,169101,69417,213
– Gross Shorts:114,53631,98536,555
– Long to Short Ratio:0.6 to 13.2 to 10.5 to 1
NET POSITION TREND:
– COT Index Score (3 Year Range Pct):25.679.714.2
– COT Index Reading (3 Year Range):BearishBullishBearish-Extreme
NET POSITION MOVEMENT INDEX:
– 6-Week Change in Strength Index:-28.436.3-39.1


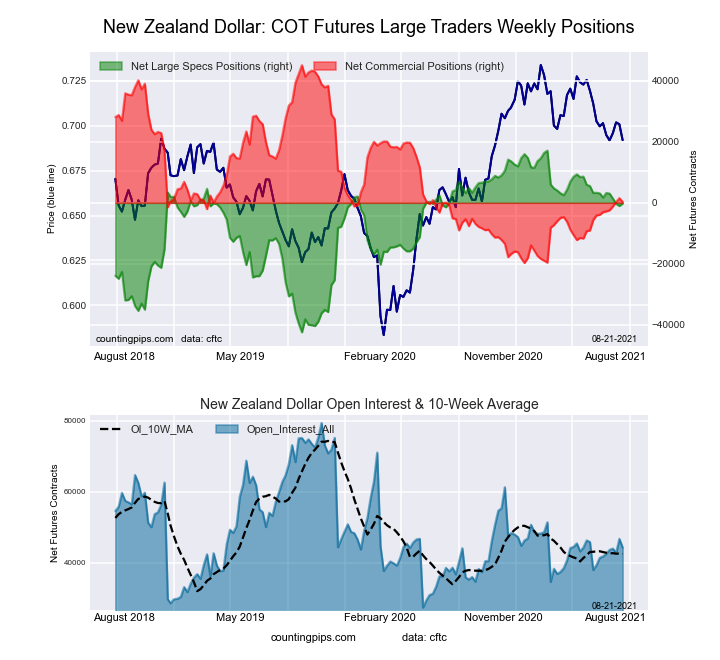
New Zealand Dollar Futures:

Eurodollar Bonds Futures COT ChartThe New Zealand Dollar large speculator standing this week was a net position of -235 contracts in the data reported through Tuesday. This was a weekly increase of 797 contracts from the previous week which had a total of -1,032 net contracts.

This week’s current strength score (the trader positioning range over the past three years, measured from 0 to 100) shows the speculators are currently Bullish with a score of 70.9 percent. The commercials are Bearish with a score of 30.9 percent and the small traders (not shown in chart) are Bullish with a score of 52.0 percent.

NEW ZEALAND DOLLAR StatisticsSPECULATORSCOMMERCIALSSMALL TRADERS
– Percent of Open Interest Longs:37.746.89.3
– Percent of Open Interest Shorts:38.246.09.5
– Net Position:-235344-109
– Gross Longs:16,67420,7074,111
– Gross Shorts:16,90920,3634,220
– Long to Short Ratio:1.0 to 11.0 to 11.0 to 1
NET POSITION TREND:
– COT Index Score (3 Year Range Pct):70.930.952.0
– COT Index Reading (3 Year Range):BullishBearishBullish
NET POSITION MOVEMENT INDEX:
– 6-Week Change in Strength Index:-3.35.3-15.7


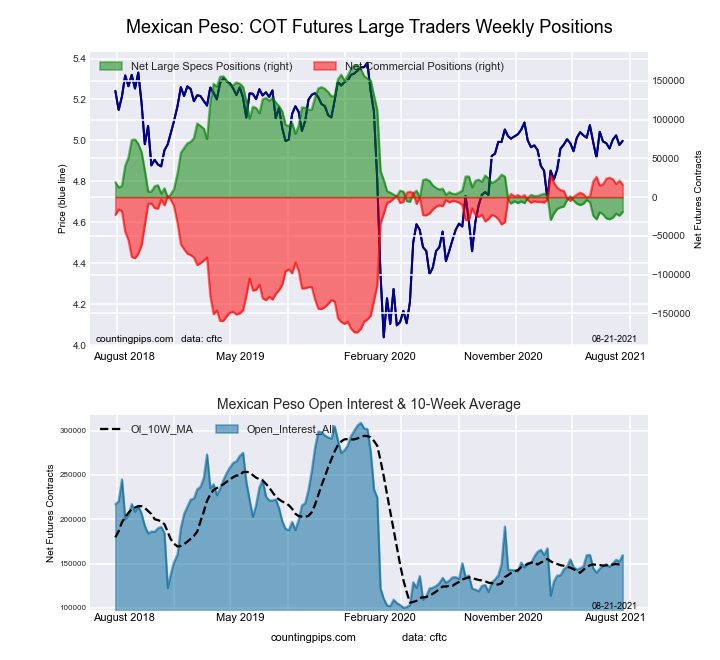
Mexican Peso Futures:

Ultra 10-Year Treasury Notes Bonds Futures COT ChartThe Mexican Peso large speculator standing this week was a net position of -19,117 contracts in the data reported through Tuesday. This was a weekly boost of 4,770 contracts from the previous week which had a total of -23,887 net contracts.

This week’s current strength score (the trader positioning range over the past three years, measured from 0 to 100) shows the speculators are currently Bearish-Extreme with a score of 5.2 percent. The commercials are Bullish-Extreme with a score of 94.0 percent and the small traders (not shown in chart) are Bullish with a score of 56.5 percent.

MEXICAN PESO StatisticsSPECULATORSCOMMERCIALSSMALL TRADERS
– Percent of Open Interest Longs:48.046.14.1
– Percent of Open Interest Shorts:59.936.22.1
– Net Position:-19,11715,9433,174
– Gross Longs:76,53073,6526,522
– Gross Shorts:95,64757,7093,348
– Long to Short Ratio:0.8 to 11.3 to 11.9 to 1
NET POSITION TREND:
– COT Index Score (3 Year Range Pct):5.294.056.5
– COT Index Reading (3 Year Range):Bearish-ExtremeBullish-ExtremeBullish
NET POSITION MOVEMENT INDEX:
– 6-Week Change in Strength Index:1.6-0.4-10.2


Brazilian Real Futures:

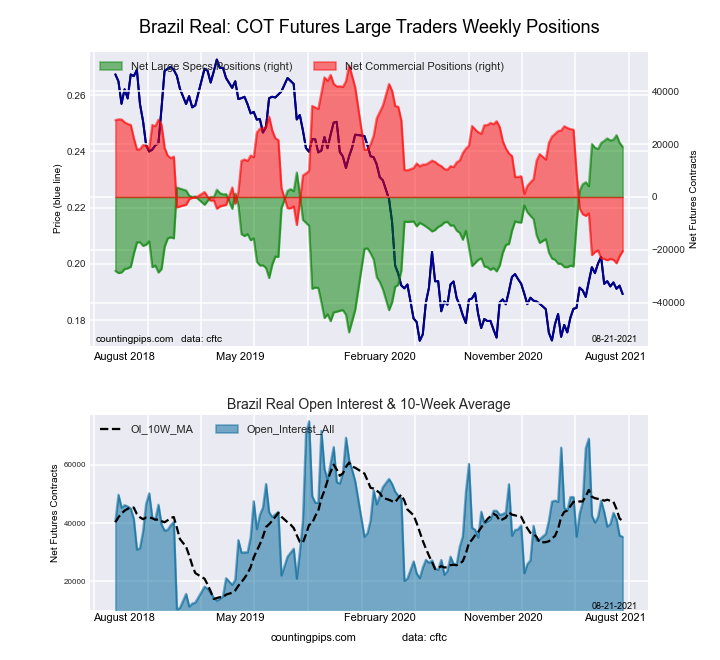
US Year Treasury Notes Long Bonds Futures COT ChartThe Brazilian Real large speculator standing this week was a net position of 18,989 contracts in the data reported through Tuesday. This was a weekly reduction of -1,549 contracts from the previous week which had a total of 20,538 net contracts.

This week’s current strength score (the trader positioning range over the past three years, measured from 0 to 100) shows the speculators are currently Bullish-Extreme with a score of 94.0 percent. The commercials are Bearish-Extreme with a score of 6.1 percent and the small traders (not shown in chart) are Bullish-Extreme with a score of 85.0 percent.

BRAZIL REAL StatisticsSPECULATORSCOMMERCIALSSMALL TRADERS
– Percent of Open Interest Longs:73.317.59.2
– Percent of Open Interest Shorts:19.475.64.9
– Net Position:18,989-20,4891,500
– Gross Longs:25,8466,1763,230
– Gross Shorts:6,85726,6651,730
– Long to Short Ratio:3.8 to 10.2 to 11.9 to 1
NET POSITION TREND:
– COT Index Score (3 Year Range Pct):94.06.185.0
– COT Index Reading (3 Year Range):Bullish-ExtremeBearish-ExtremeBullish-Extreme
NET POSITION MOVEMENT INDEX:
– 6-Week Change in Strength Index:-3.14.0-8.0


Russian Ruble Futures:

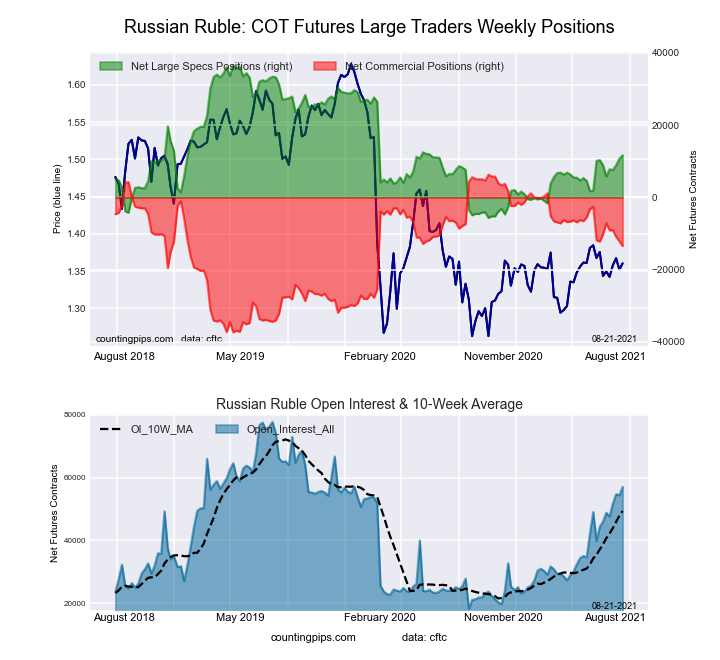
Ultra US Year Treasury Notes Long Bonds Futures COT ChartThe Russian Ruble large speculator standing this week was a net position of 11,701 contracts in the data reported through Tuesday. This was a weekly gain of 999 contracts from the previous week which had a total of 10,702 net contracts.

This week’s current strength score (the trader positioning range over the past three years, measured from 0 to 100) shows the speculators are currently Bearish with a score of 41.1 percent. The commercials are Bullish with a score of 54.7 percent and the small traders (not shown in chart) are Bullish-Extreme with a score of 93.1 percent.

RUSSIAN RUBLE StatisticsSPECULATORSCOMMERCIALSSMALL TRADERS
– Percent of Open Interest Longs:42.552.54.9
– Percent of Open Interest Shorts:22.076.01.8
– Net Position:11,701-13,4481,747
– Gross Longs:24,23929,9472,796
– Gross Shorts:12,53843,3951,049
– Long to Short Ratio:1.9 to 10.7 to 12.7 to 1
NET POSITION TREND:
– COT Index Score (3 Year Range Pct):41.154.793.1
– COT Index Reading (3 Year Range):BearishBullishBullish-Extreme
NET POSITION MOVEMENT INDEX:
– 6-Week Change in Strength Index:6.6-7.615.1


Bitcoin Futures:

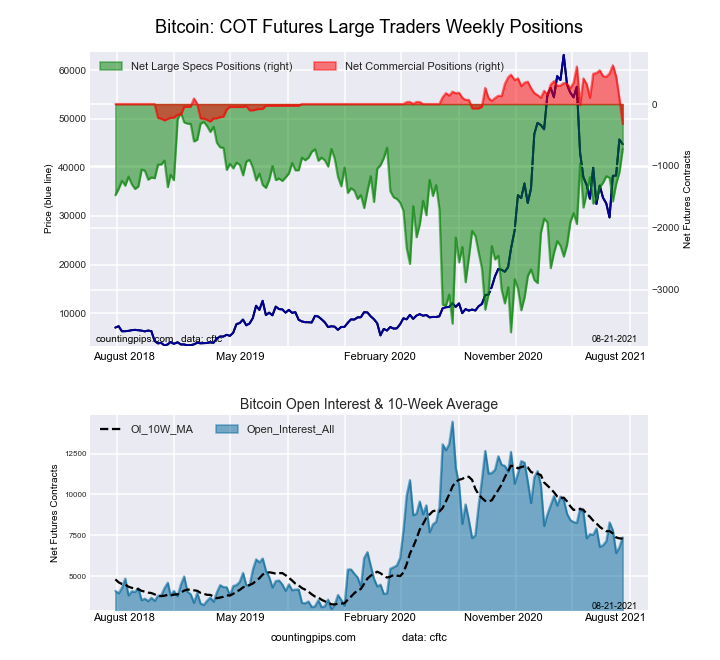
Eurodollar Bonds Futures COT ChartThe Bitcoin large speculator standing this week was a net position of -726 contracts in the data reported through Tuesday. This was a weekly gain of 378 contracts from the previous week which had a total of -1,104 net contracts.

This week’s current strength score (the trader positioning range over the past three years, measured from 0 to 100) shows the speculators are currently Bullish-Extreme with a score of 83.5 percent. The commercials are Bearish-Extreme with a score of 0.0 percent and the small traders (not shown in chart) are Bearish with a score of 24.1 percent.

BITCOIN StatisticsSPECULATORSCOMMERCIALSSMALL TRADERS
– Percent of Open Interest Longs:65.24.025.3
– Percent of Open Interest Shorts:75.18.311.1
– Net Position:-726-3211,047
– Gross Longs:4,8042931,863
– Gross Shorts:5,530614816
– Long to Short Ratio:0.9 to 10.5 to 12.3 to 1
NET POSITION TREND:
– COT Index Score (3 Year Range Pct):83.50.024.1
– COT Index Reading (3 Year Range):Bullish-ExtremeBearish-ExtremeBearish
NET POSITION MOVEMENT INDEX:
– 6-Week Change in Strength Index:15.4-81.27.4


Article By CountingPips.comReceive our weekly COT Reports by Email

*COT Report: The COT data, released weekly to the public each Friday, is updated through the most recent Tuesday (data is 3 days old) and shows a quick view of how large speculators or non-commercials (for-profit traders) were positioned in the futures markets.

The CFTC categorizes trader positions according to commercial hedgers (traders who use futures contracts for hedging as part of the business), non-commercials (large traders who speculate to realize trading profits) and nonreportable traders (usually small traders/speculators).

Find CFTC criteria here: (http://www.cftc.gov/MarketReports/CommitmentsofTraders/ExplanatoryNotes/index.htm).

COT Bonds Futures Charts: 30-Day Fed Funds, 10-Year Treasuries, US Bonds, Eurodollar

By CountingPips.com COT Home | Data Tables | Data Downloads | Newsletter

Here are the latest charts and statistics for the Commitment of Traders (COT) data published by the Commodities Futures Trading Commission (CFTC).

The latest COT data is updated through Tuesday August 17 2021 and shows a quick view of how large traders (for-profit speculators and commercial entities) were positioned in the futures markets.


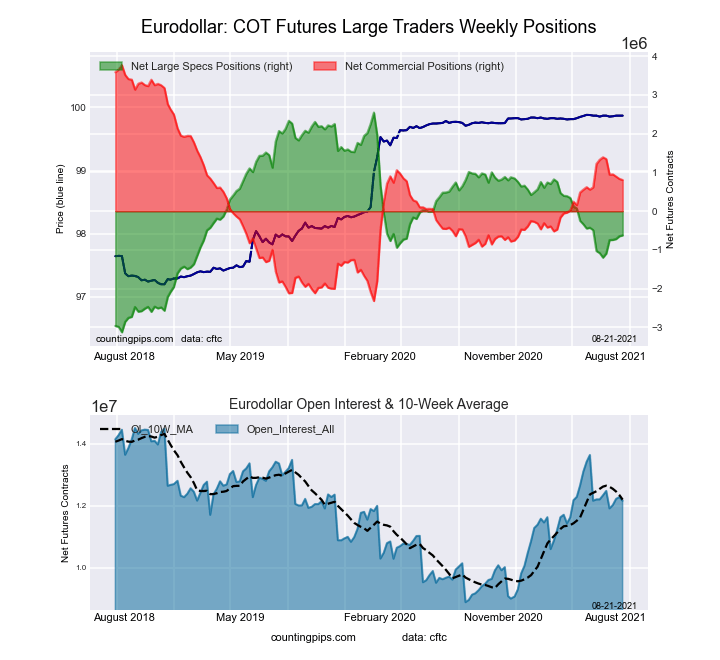
3-Month Eurodollars Futures:

Eurodollar Bonds Futures COT ChartThe 3-Month Eurodollars large speculator standing this week was a net position of -623,428 contracts in the data reported through Tuesday. This was a weekly boost of 22,955 contracts from the previous week which had a total of -646,383 net contracts.

This week’s current strength score (the trader positioning range over the past three years, measured from 0 to 100) shows the speculators are currently Bearish with a score of 44.1 percent. The commercials are Bullish with a score of 51.3 percent and the small traders (not shown in chart) are Bullish with a score of 79.2 percent.

3-Month Eurodollars StatisticsSPECULATORSCOMMERCIALSSMALL TRADERS
– Percent of Open Interest Longs:16.958.95.2
– Percent of Open Interest Shorts:22.052.36.7
– Net Position:-623,428804,569-181,141
– Gross Longs:2,048,7657,161,441628,988
– Gross Shorts:2,672,1936,356,872810,129
– Long to Short Ratio:0.8 to 11.1 to 10.8 to 1
NET POSITION TREND:
– COT Index Score (3 Year Range Pct):44.151.379.2
– COT Index Reading (3 Year Range):BearishBullishBullish
NET POSITION MOVEMENT INDEX:
– 6-Week Change in Strength Index:10.1-9.61.5


30-Day Federal Funds Futures:

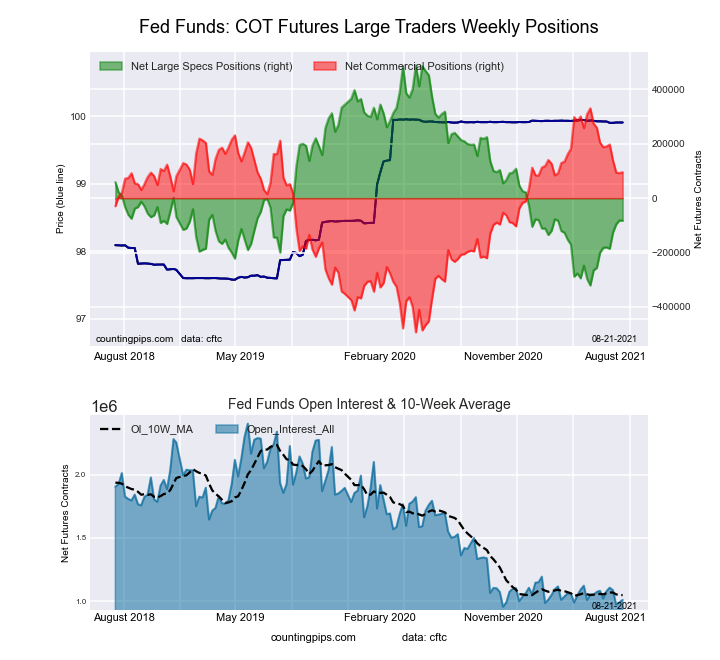
Federal Funds 30-Day Bonds Futures COT ChartThe 30-Day Federal Funds large speculator standing this week was a net position of -83,089 contracts in the data reported through Tuesday. This was a weekly decrease of -1,374 contracts from the previous week which had a total of -81,715 net contracts.

This week’s current strength score (the trader positioning range over the past three years, measured from 0 to 100) shows the speculators are currently Bearish with a score of 29.4 percent. The commercials are Bullish with a score of 71.5 percent and the small traders (not shown in chart) are Bearish with a score of 48.4 percent.

30-Day Federal Funds StatisticsSPECULATORSCOMMERCIALSSMALL TRADERS
– Percent of Open Interest Longs:5.674.82.2
– Percent of Open Interest Shorts:13.865.33.5
– Net Position:-83,08995,569-12,480
– Gross Longs:56,245755,22222,549
– Gross Shorts:139,334659,65335,029
– Long to Short Ratio:0.4 to 11.1 to 10.6 to 1
NET POSITION TREND:
– COT Index Score (3 Year Range Pct):29.471.548.4
– COT Index Reading (3 Year Range):BearishBullishBearish
NET POSITION MOVEMENT INDEX:
– 6-Week Change in Strength Index:12.3-11.2-13.6


2-Year Treasury Note Futures:

2-Year Treasury Bonds Futures COT ChartThe 2-Year Treasury Note large speculator standing this week was a net position of 30,197 contracts in the data reported through Tuesday. This was a weekly fall of -4,431 contracts from the previous week which had a total of 34,628 net contracts.

This week’s current strength score (the trader positioning range over the past three years, measured from 0 to 100) shows the speculators are currently Bullish-Extreme with a score of 99.0 percent. The commercials are Bearish-Extreme with a score of 9.1 percent and the small traders (not shown in chart) are Bearish with a score of 38.1 percent.

2-Year Treasury Note StatisticsSPECULATORSCOMMERCIALSSMALL TRADERS
– Percent of Open Interest Longs:21.269.07.8
– Percent of Open Interest Shorts:19.771.27.1
– Net Position:30,197-43,29813,101
– Gross Longs:418,0521,360,604153,083
– Gross Shorts:387,8551,403,902139,982
– Long to Short Ratio:1.1 to 11.0 to 11.1 to 1
NET POSITION TREND:
– COT Index Score (3 Year Range Pct):99.09.138.1
– COT Index Reading (3 Year Range):Bullish-ExtremeBearish-ExtremeBearish
NET POSITION MOVEMENT INDEX:
– 6-Week Change in Strength Index:50.6-46.98.6


5-Year Treasury Note Futures:

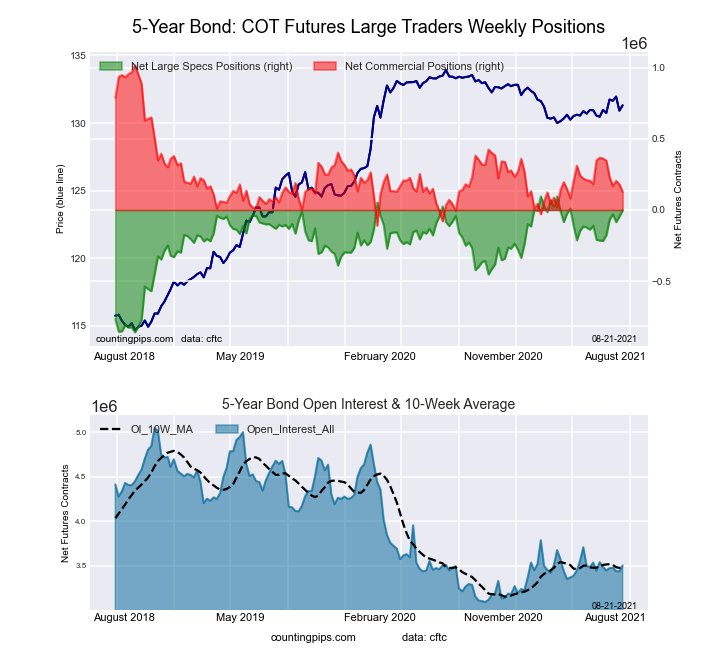
5-Year Treasury Bonds Futures COT ChartThe 5-Year Treasury Note large speculator standing this week was a net position of -2,082 contracts in the data reported through Tuesday. This was a weekly lift of 43,876 contracts from the previous week which had a total of -45,958 net contracts.

This week’s current strength score (the trader positioning range over the past three years, measured from 0 to 100) shows the speculators are currently Bullish-Extreme with a score of 89.8 percent. The commercials are Bearish with a score of 21.0 percent and the small traders (not shown in chart) are Bearish-Extreme with a score of 18.4 percent.

5-Year Treasury Note StatisticsSPECULATORSCOMMERCIALSSMALL TRADERS
– Percent of Open Interest Longs:12.874.98.9
– Percent of Open Interest Shorts:12.871.312.5
– Net Position:-2,082126,967-124,885
– Gross Longs:447,4192,627,057313,260
– Gross Shorts:449,5012,500,090438,145
– Long to Short Ratio:1.0 to 11.1 to 10.7 to 1
NET POSITION TREND:
– COT Index Score (3 Year Range Pct):89.821.018.4
– COT Index Reading (3 Year Range):Bullish-ExtremeBearishBearish-Extreme
NET POSITION MOVEMENT INDEX:
– 6-Week Change in Strength Index:22.5-20.88.2


10-Year Treasury Note Futures:

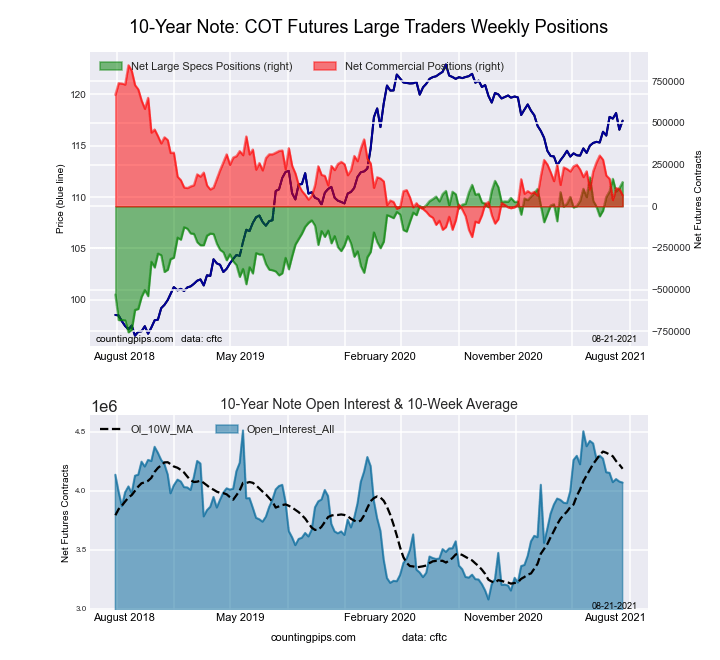
10-Year Treasury Notes Bonds Futures COT ChartThe 10-Year Treasury Note large speculator standing this week was a net position of 145,216 contracts in the data reported through Tuesday. This was a weekly boost of 36,407 contracts from the previous week which had a total of 108,809 net contracts.

This week’s current strength score (the trader positioning range over the past three years, measured from 0 to 100) shows the speculators are currently Bullish-Extreme with a score of 97.0 percent. The commercials are Bearish with a score of 24.2 percent and the small traders (not shown in chart) are Bearish-Extreme with a score of 18.5 percent.

10-Year Treasury Note StatisticsSPECULATORSCOMMERCIALSSMALL TRADERS
– Percent of Open Interest Longs:22.067.49.0
– Percent of Open Interest Shorts:18.465.814.1
– Net Position:145,21665,390-210,606
– Gross Longs:895,4452,741,764364,476
– Gross Shorts:750,2292,676,374575,082
– Long to Short Ratio:1.2 to 11.0 to 10.6 to 1
NET POSITION TREND:
– COT Index Score (3 Year Range Pct):97.024.218.5
– COT Index Reading (3 Year Range):Bullish-ExtremeBearishBearish-Extreme
NET POSITION MOVEMENT INDEX:
– 6-Week Change in Strength Index:18.4-20.811.6


Ultra 10-Year Notes Futures:

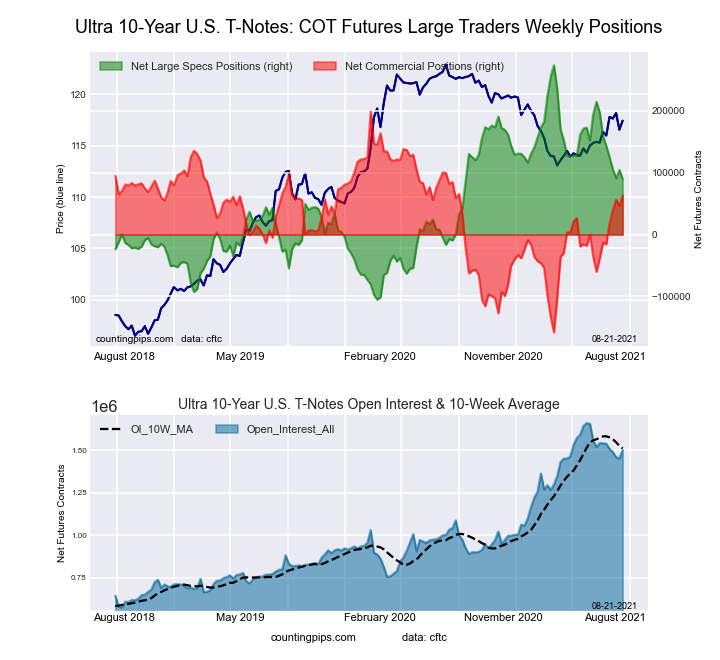
Ultra 10-Year Treasury Notes Bonds Futures COT ChartThe Ultra 10-Year Notes large speculator standing this week was a net position of 89,783 contracts in the data reported through Tuesday. This was a weekly lowering of -14,662 contracts from the previous week which had a total of 104,445 net contracts.

This week’s current strength score (the trader positioning range over the past three years, measured from 0 to 100) shows the speculators are currently Bullish with a score of 51.5 percent. The commercials are Bullish with a score of 62.0 percent and the small traders (not shown in chart) are Bearish-Extreme with a score of 4.5 percent.

Ultra 10-Year Notes StatisticsSPECULATORSCOMMERCIALSSMALL TRADERS
– Percent of Open Interest Longs:14.573.98.8
– Percent of Open Interest Shorts:8.569.719.0
– Net Position:89,78363,177-152,960
– Gross Longs:217,6901,108,556132,048
– Gross Shorts:127,9071,045,379285,008
– Long to Short Ratio:1.7 to 11.1 to 10.5 to 1
NET POSITION TREND:
– COT Index Score (3 Year Range Pct):51.562.04.5
– COT Index Reading (3 Year Range):BullishBullishBearish-Extreme
NET POSITION MOVEMENT INDEX:
– 6-Week Change in Strength Index:-18.321.4-5.3


US Treasury Bonds Futures:

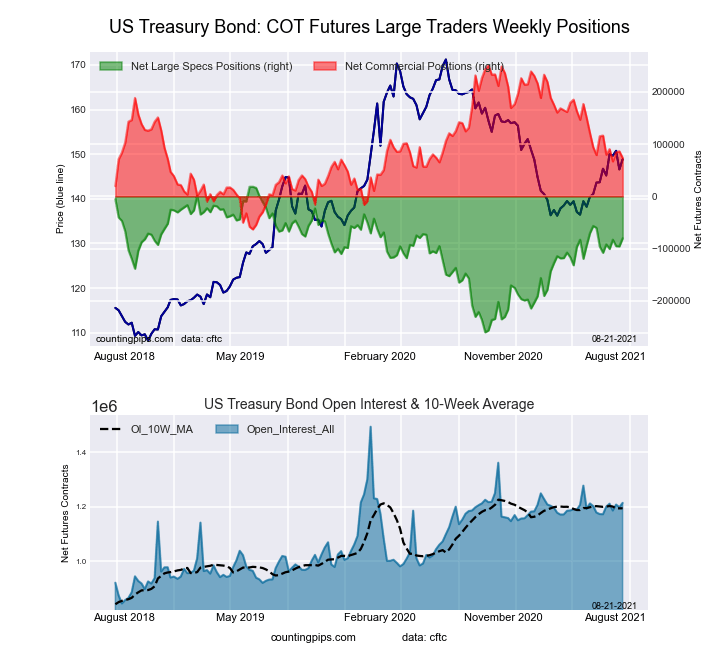
US Year Treasury Notes Long Bonds Futures COT ChartThe US Treasury Bonds large speculator standing this week was a net position of -80,205 contracts in the data reported through Tuesday. This was a weekly boost of 15,432 contracts from the previous week which had a total of -95,637 net contracts.

This week’s current strength score (the trader positioning range over the past three years, measured from 0 to 100) shows the speculators are currently Bullish with a score of 64.6 percent. The commercials are Bearish with a score of 43.5 percent and the small traders (not shown in chart) are Bullish with a score of 58.0 percent.

US Treasury Bonds StatisticsSPECULATORSCOMMERCIALSSMALL TRADERS
– Percent of Open Interest Longs:11.971.315.2
– Percent of Open Interest Shorts:18.565.214.6
– Net Position:-80,20573,3656,840
– Gross Longs:144,224865,340184,410
– Gross Shorts:224,429791,975177,570
– Long to Short Ratio:0.6 to 11.1 to 11.0 to 1
NET POSITION TREND:
– COT Index Score (3 Year Range Pct):64.643.558.0
– COT Index Reading (3 Year Range):BullishBearishBullish
NET POSITION MOVEMENT INDEX:
– 6-Week Change in Strength Index:10.0-13.612.0


Ultra US Treasury Bonds Futures:

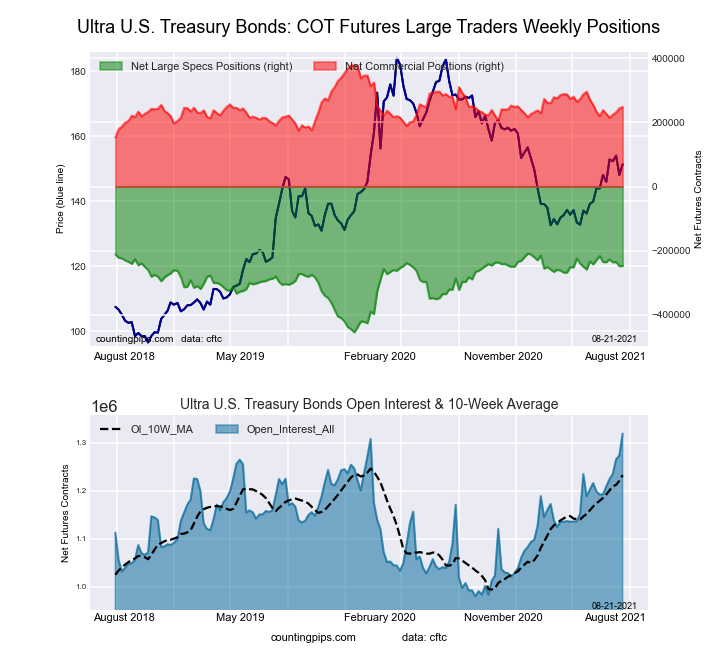
Ultra US Year Treasury Notes Long Bonds Futures COT ChartThe Ultra US Treasury Bonds large speculator standing this week was a net position of -247,347 contracts in the data reported through Tuesday. This was a weekly gain of 580 contracts from the previous week which had a total of -247,927 net contracts.

This week’s current strength score (the trader positioning range over the past three years, measured from 0 to 100) shows the speculators are currently Bullish-Extreme with a score of 84.3 percent. The commercials are Bearish with a score of 42.1 percent and the small traders (not shown in chart) are Bearish with a score of 27.9 percent.

Ultra US Treasury Bonds StatisticsSPECULATORSCOMMERCIALSSMALL TRADERS
– Percent of Open Interest Longs:9.175.611.4
– Percent of Open Interest Shorts:27.856.811.5
– Net Position:-247,347247,849-502
– Gross Longs:119,649997,296150,871
– Gross Shorts:366,996749,447151,373
– Long to Short Ratio:0.3 to 11.3 to 11.0 to 1
NET POSITION TREND:
– COT Index Score (3 Year Range Pct):84.342.127.9
– COT Index Reading (3 Year Range):Bullish-ExtremeBearishBearish
NET POSITION MOVEMENT INDEX:
– 6-Week Change in Strength Index:-5.04.41.7


Article By CountingPips.comReceive our weekly COT Reports by Email

*COT Report: The COT data, released weekly to the public each Friday, is updated through the most recent Tuesday (data is 3 days old) and shows a quick view of how large speculators or non-commercials (for-profit traders) were positioned in the futures markets.

The CFTC categorizes trader positions according to commercial hedgers (traders who use futures contracts for hedging as part of the business), non-commercials (large traders who speculate to realize trading profits) and nonreportable traders (usually small traders/speculators).

Find CFTC criteria here: (http://www.cftc.gov/MarketReports/CommitmentsofTraders/ExplanatoryNotes/index.htm).
COT Futures Metals Charts: Gold, Silver, Platinum, Palladium & Copper Grade #1

By CountingPips.com COT Home | Data Tables | Data Downloads | Newsletter

Here are the latest charts and statistics for the Commitment of Traders (COT) data published by the Commodities Futures Trading Commission (CFTC).

The latest COT data is updated through Tuesday August 17 2021 and shows a quick view of how large traders (for-profit speculators and commercial entities) were positioned in the futures markets.


Gold Comex Futures:

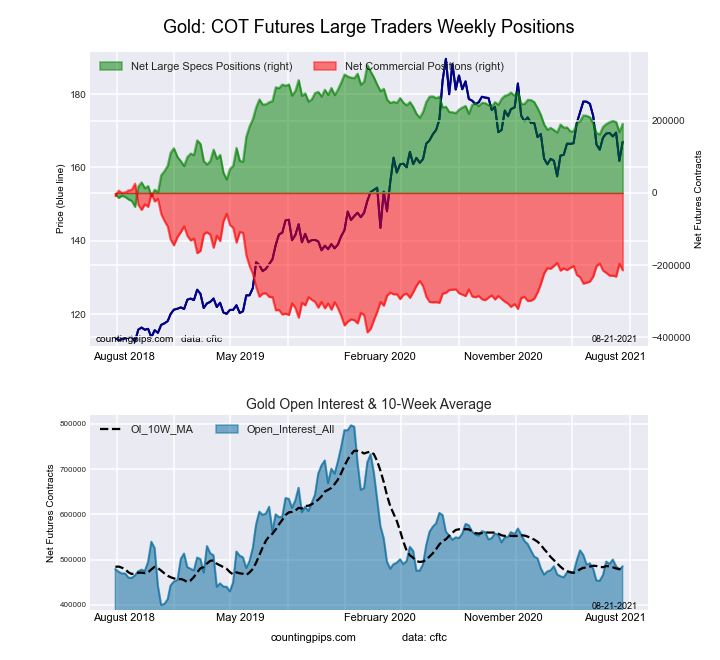
Federal Funds 30-Day Bonds Futures COT ChartThe Gold Comex Futures large speculator standing this week resulted in a net position of 191,542 contracts in the data reported through Tuesday. This was a weekly increase of 23,136 contracts from the previous week which had a total of 168,406 net contracts.

This week’s current strength score (the trader positioning range over the past three years, measured from 0 to 100) shows the speculators are currently Bullish with a score of 58.6 percent. The commercials are Bearish with a score of 41.7 percent and the small traders (not shown in chart) are Bearish with a score of 37.9 percent.

Gold Futures StatisticsSPECULATORSCOMMERCIALSSMALL TRADERS
– Percent of Open Interest Longs:58.625.49.1
– Percent of Open Interest Shorts:19.169.54.5
– Net Position:191,542-214,00022,458
– Gross Longs:284,437123,30144,315
– Gross Shorts:92,895337,30121,857
– Long to Short Ratio:3.1 to 10.4 to 12.0 to 1
NET POSITION TREND:
– COT Index Score (3 Year Range Pct):58.641.737.9
– COT Index Reading (3 Year Range):BullishBearishBearish
NET POSITION MOVEMENT INDEX:
– 6-Week Change in Strength Index:2.20.2-23.1


Silver Comex Futures:

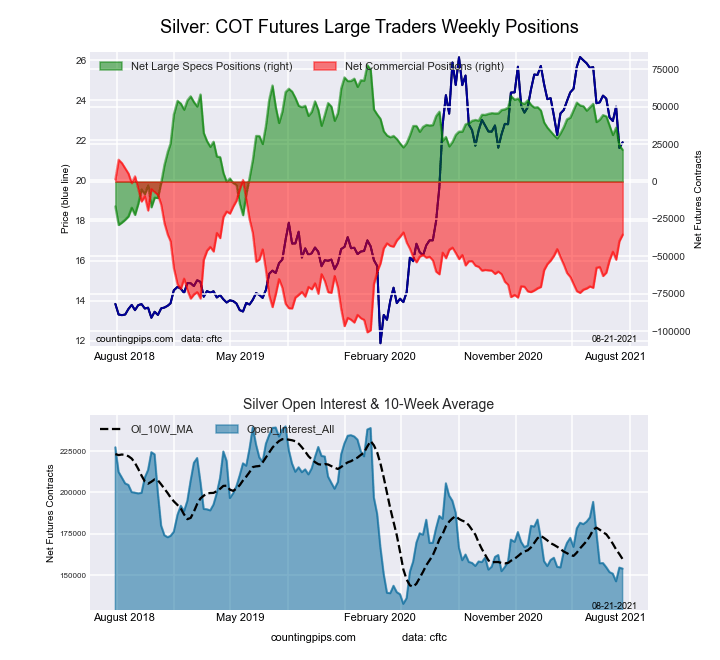
2-Year Treasury Bonds Futures COT ChartThe Silver Comex Futures large speculator standing this week resulted in a net position of 21,220 contracts in the data reported through Tuesday. This was a weekly reduction of -3,254 contracts from the previous week which had a total of 24,474 net contracts.

This week’s current strength score (the trader positioning range over the past three years, measured from 0 to 100) shows the speculators are currently Bearish with a score of 47.0 percent. The commercials are Bullish with a score of 56.6 percent and the small traders (not shown in chart) are Bearish with a score of 23.2 percent.

Silver Futures StatisticsSPECULATORSCOMMERCIALSSMALL TRADERS
– Percent of Open Interest Longs:41.236.317.3
– Percent of Open Interest Shorts:27.459.48.0
– Net Position:21,220-35,49014,270
– Gross Longs:63,39055,83126,597
– Gross Shorts:42,17091,32112,327
– Long to Short Ratio:1.5 to 10.6 to 12.2 to 1
NET POSITION TREND:
– COT Index Score (3 Year Range Pct):47.056.623.2
– COT Index Reading (3 Year Range):BearishBullishBearish
NET POSITION MOVEMENT INDEX:
– 6-Week Change in Strength Index:-21.823.9-26.2


Copper Grade #1 Futures:

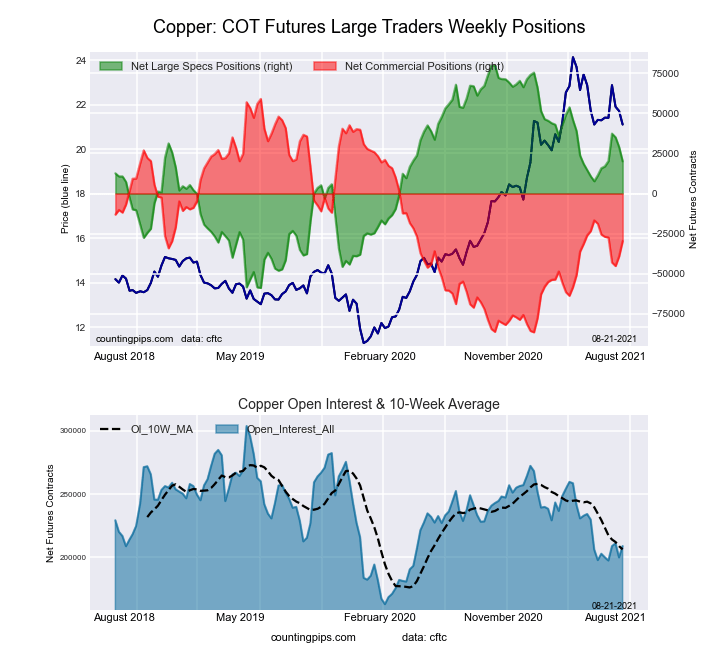
5-Year Treasury Bonds Futures COT ChartThe Copper Grade #1 Futures large speculator standing this week resulted in a net position of 20,080 contracts in the data reported through Tuesday. This was a weekly decrease of -8,951 contracts from the previous week which had a total of 29,031 net contracts.

This week’s current strength score (the trader positioning range over the past three years, measured from 0 to 100) shows the speculators are currently Bullish with a score of 56.8 percent. The commercials are Bearish with a score of 39.1 percent and the small traders (not shown in chart) are Bullish-Extreme with a score of 80.7 percent.

Copper Futures StatisticsSPECULATORSCOMMERCIALSSMALL TRADERS
– Percent of Open Interest Longs:41.139.09.8
– Percent of Open Interest Shorts:31.553.25.2
– Net Position:20,080-29,6559,575
– Gross Longs:85,95381,42420,453
– Gross Shorts:65,873111,07910,878
– Long to Short Ratio:1.3 to 10.7 to 11.9 to 1
NET POSITION TREND:
– COT Index Score (3 Year Range Pct):56.839.180.7
– COT Index Reading (3 Year Range):BullishBearishBullish-Extreme
NET POSITION MOVEMENT INDEX:
– 6-Week Change in Strength Index:3.1-2.8-1.4


Platinum Futures:

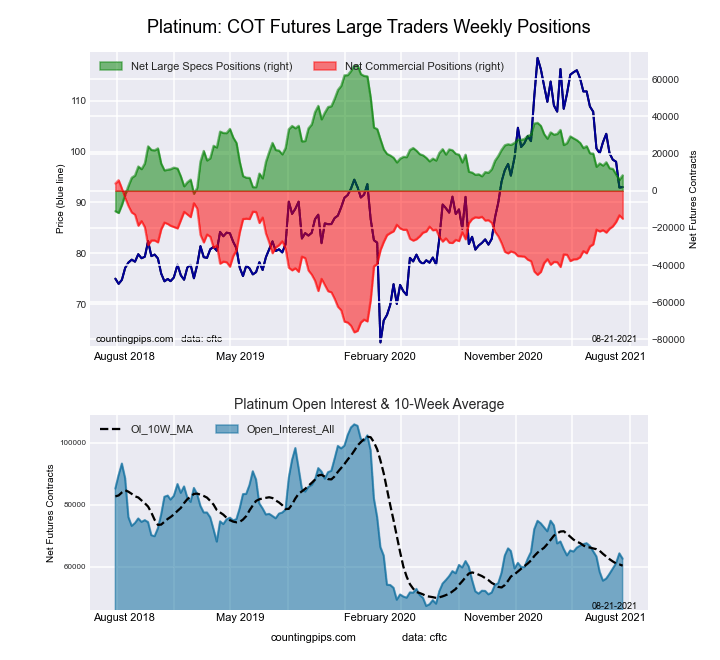
10-Year Treasury Notes Bonds Futures COT ChartThe Platinum Futures large speculator standing this week resulted in a net position of 8,358 contracts in the data reported through Tuesday. This was a weekly increase of 2,539 contracts from the previous week which had a total of 5,819 net contracts.

This week’s current strength score (the trader positioning range over the past three years, measured from 0 to 100) shows the speculators are currently Bearish with a score of 25.5 percent. The commercials are Bullish with a score of 74.7 percent and the small traders (not shown in chart) are Bullish with a score of 54.6 percent.

Platinum Futures StatisticsSPECULATORSCOMMERCIALSSMALL TRADERS
– Percent of Open Interest Longs:51.330.316.1
– Percent of Open Interest Shorts:38.054.35.5
– Net Position:8,358-14,9976,639
– Gross Longs:32,12418,98410,103
– Gross Shorts:23,76633,9813,464
– Long to Short Ratio:1.4 to 10.6 to 12.9 to 1
NET POSITION TREND:
– COT Index Score (3 Year Range Pct):25.574.754.6
– COT Index Reading (3 Year Range):BearishBullishBullish
NET POSITION MOVEMENT INDEX:
– 6-Week Change in Strength Index:-6.67.6-13.5


Palladium Futures:

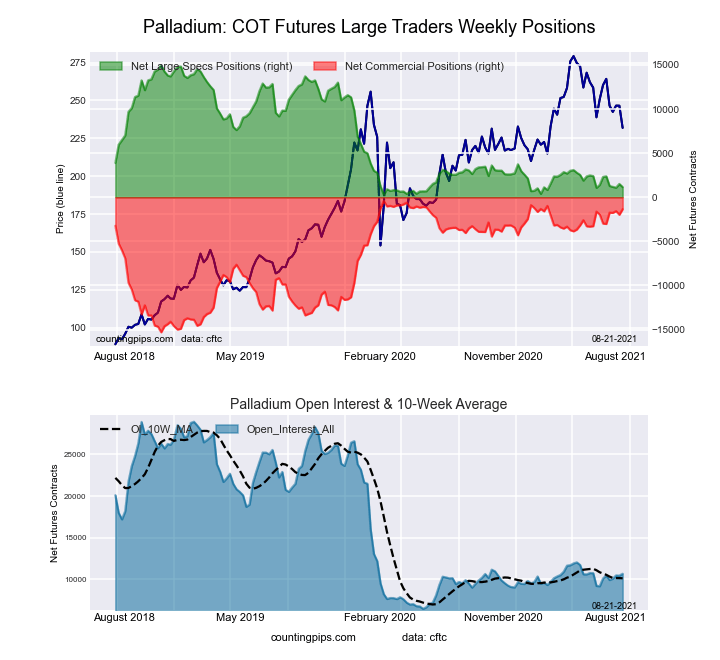
Ultra 10-Year Treasury Notes Bonds Futures COT ChartThe Palladium Futures large speculator standing this week resulted in a net position of 1,151 contracts in the data reported through Tuesday. This was a weekly reduction of -357 contracts from the previous week which had a total of 1,508 net contracts.

This week’s current strength score (the trader positioning range over the past three years, measured from 0 to 100) shows the speculators are currently Bearish-Extreme with a score of 5.9 percent. The commercials are Bullish-Extreme with a score of 93.7 percent and the small traders (not shown in chart) are Bullish with a score of 56.2 percent.

Palladium Futures StatisticsSPECULATORSCOMMERCIALSSMALL TRADERS
– Percent of Open Interest Longs:44.034.713.4
– Percent of Open Interest Shorts:33.247.311.6
– Net Position:1,151-1,347196
– Gross Longs:4,6973,7061,436
– Gross Shorts:3,5465,0531,240
– Long to Short Ratio:1.3 to 10.7 to 11.2 to 1
NET POSITION TREND:
– COT Index Score (3 Year Range Pct):5.993.756.2
– COT Index Reading (3 Year Range):Bearish-ExtremeBullish-ExtremeBullish
NET POSITION MOVEMENT INDEX:
– 6-Week Change in Strength Index:-7.810.9-28.1


Article By CountingPips.comReceive our weekly COT Reports by Email

*COT Report: The COT data, released weekly to the public each Friday, is updated through the most recent Tuesday (data is 3 days old) and shows a quick view of how large speculators or non-commercials (for-profit traders) were positioned in the futures markets.

The CFTC categorizes trader positions according to commercial hedgers (traders who use futures contracts for hedging as part of the business), non-commercials (large traders who speculate to realize trading profits) and nonreportable traders (usually small traders/speculators).

Find CFTC criteria here: (http://www.cftc.gov/MarketReports/CommitmentsofTraders/ExplanatoryNotes/index.htm).

COT Stock Market Futures Charts: VIX, Dow, Nasdaq, SP500, Russell-2000, Emerging Markets

By CountingPips.com COT Home | Data Tables | Data Downloads | Newsletter

Here are the latest charts and statistics for the Commitment of Traders (COT) data published by the Commodities Futures Trading Commission (CFTC).

The latest COT data is updated through Tuesday August 17 2021 and shows a quick view of how large traders (for-profit speculators and commercial entities) were positioned in the futures markets.


VIX Volatility Futures:

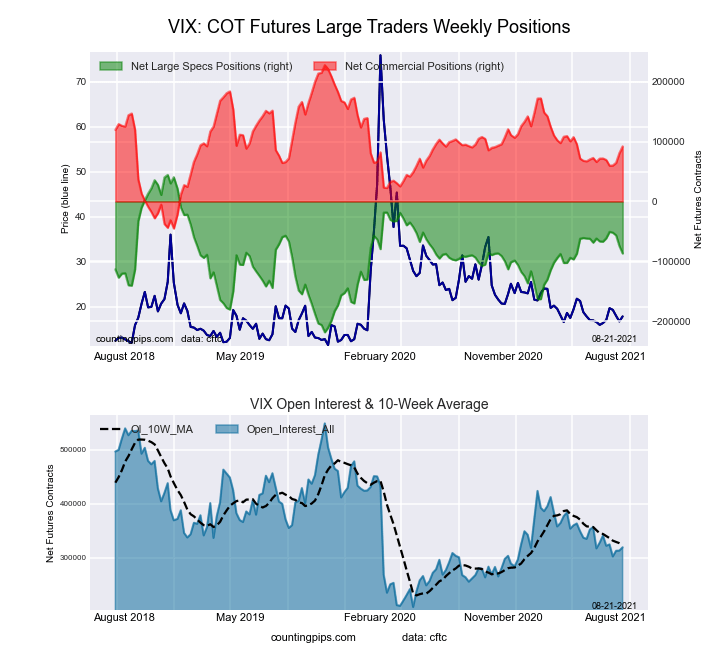
Federal Funds 30-Day Bonds Futures COT ChartThe VIX Volatility large speculator standing this week was a net position of -86,826 contracts in the data reported through Tuesday. This was a weekly decrease of -12,575 contracts from the previous week which had a total of -74,251 net contracts.

This week’s current strength score (the trader positioning range over the past three years, measured from 0 to 100) shows the speculators are currently Bullish with a score of 50.1 percent. The commercials are Bullish with a score of 50.3 percent and the small traders (not shown in chart) are Bearish with a score of 37.2 percent.

VIX Volatility Futures StatisticsSPECULATORSCOMMERCIALSSMALL TRADERS
– Percent of Open Interest Longs:19.354.16.1
– Percent of Open Interest Shorts:46.525.37.7
– Net Position:-86,82691,878-5,052
– Gross Longs:61,631172,81519,485
– Gross Shorts:148,45780,93724,537
– Long to Short Ratio:0.4 to 12.1 to 10.8 to 1
NET POSITION TREND:
– COT Index Score (3 Year Range Pct):50.150.337.2
– COT Index Reading (3 Year Range):BullishBullishBearish
NET POSITION MOVEMENT INDEX:
– 6-Week Change in Strength Index:-7.57.4-1.7


S&P500 Mini Futures:

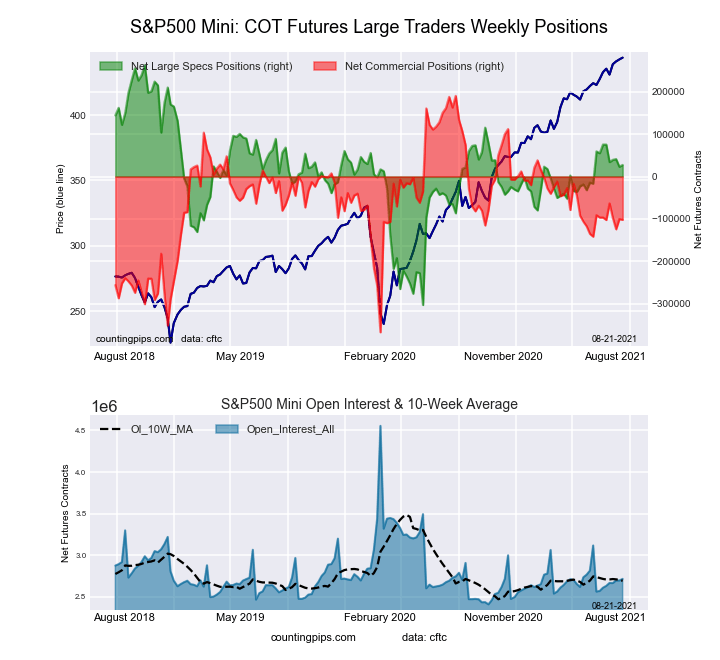
2-Year Treasury Bonds Futures COT ChartThe S&P500 Mini large speculator standing this week was a net position of 27,335 contracts in the data reported through Tuesday. This was a weekly boost of 4,224 contracts from the previous week which had a total of 23,111 net contracts.

This week’s current strength score (the trader positioning range over the past three years, measured from 0 to 100) shows the speculators are currently Bullish with a score of 58.4 percent. The commercials are Bearish with a score of 47.6 percent and the small traders (not shown in chart) are Bearish with a score of 42.1 percent.

S&P500 Mini Futures StatisticsSPECULATORSCOMMERCIALSSMALL TRADERS
– Percent of Open Interest Longs:15.868.312.1
– Percent of Open Interest Shorts:14.872.19.3
– Net Position:27,335-102,13974,804
– Gross Longs:429,3951,855,263327,326
– Gross Shorts:402,0601,957,402252,522
– Long to Short Ratio:1.1 to 10.9 to 11.3 to 1
NET POSITION TREND:
– COT Index Score (3 Year Range Pct):58.447.642.1
– COT Index Reading (3 Year Range):BullishBearishBearish
NET POSITION MOVEMENT INDEX:
– 6-Week Change in Strength Index:-8.5-1.011.2


Dow Jones Mini Futures:

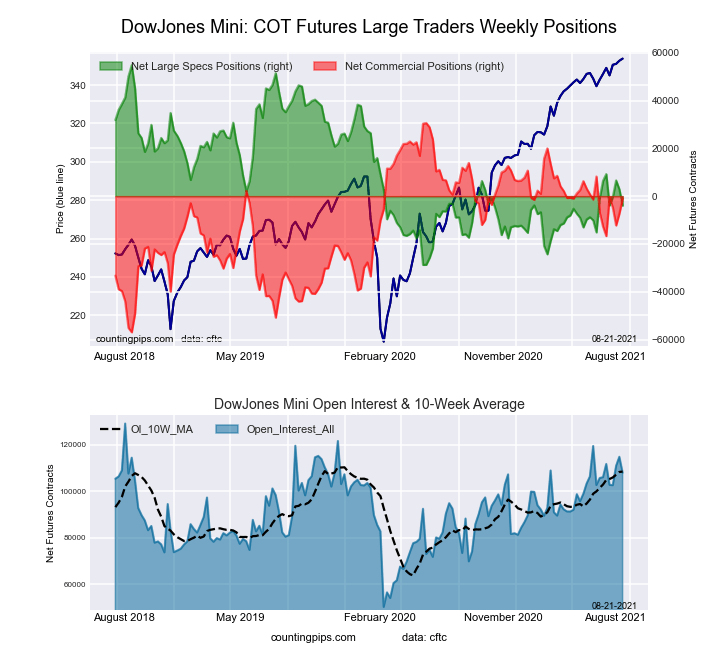
5-Year Treasury Bonds Futures COT ChartThe Dow Jones Mini large speculator standing this week was a net position of -3,946 contracts in the data reported through Tuesday. This was a weekly lowering of -6,834 contracts from the previous week which had a total of 2,888 net contracts.

This week’s current strength score (the trader positioning range over the past three years, measured from 0 to 100) shows the speculators are currently Bearish with a score of 29.7 percent. The commercials are Bullish with a score of 63.8 percent and the small traders (not shown in chart) are Bullish with a score of 65.4 percent.

Dow Jones Mini Futures StatisticsSPECULATORSCOMMERCIALSSMALL TRADERS
– Percent of Open Interest Longs:39.142.816.1
– Percent of Open Interest Shorts:42.843.811.4
– Net Position:-3,946-1,0845,030
– Gross Longs:42,25046,21517,326
– Gross Shorts:46,19647,29912,296
– Long to Short Ratio:0.9 to 11.0 to 11.4 to 1
NET POSITION TREND:
– COT Index Score (3 Year Range Pct):29.763.865.4
– COT Index Reading (3 Year Range):BearishBullishBullish
NET POSITION MOVEMENT INDEX:
– 6-Week Change in Strength Index:-12.313.3-7.1


Nasdaq Mini Futures:

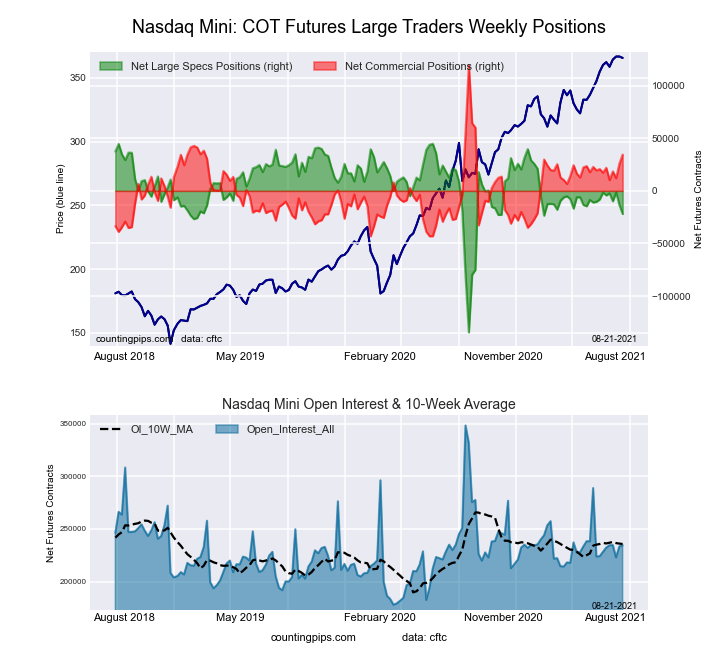
10-Year Treasury Notes Bonds Futures COT ChartThe Nasdaq Mini large speculator standing this week was a net position of -21,928 contracts in the data reported through Tuesday. This was a weekly lowering of -8,659 contracts from the previous week which had a total of -13,269 net contracts.

This week’s current strength score (the trader positioning range over the past three years, measured from 0 to 100) shows the speculators are currently Bullish with a score of 62.8 percent. The commercials are Bearish with a score of 47.7 percent and the small traders (not shown in chart) are Bearish-Extreme with a score of 15.9 percent.

Nasdaq Mini Futures StatisticsSPECULATORSCOMMERCIALSSMALL TRADERS
– Percent of Open Interest Longs:23.459.114.6
– Percent of Open Interest Shorts:32.844.420.0
– Net Position:-21,92834,449-12,521
– Gross Longs:54,913138,64134,286
– Gross Shorts:76,841104,19246,807
– Long to Short Ratio:0.7 to 11.3 to 10.7 to 1
NET POSITION TREND:
– COT Index Score (3 Year Range Pct):62.847.715.9
– COT Index Reading (3 Year Range):BullishBearishBearish-Extreme
NET POSITION MOVEMENT INDEX:
– 6-Week Change in Strength Index:-11.410.67.2


Russell 2000 Mini Futures:

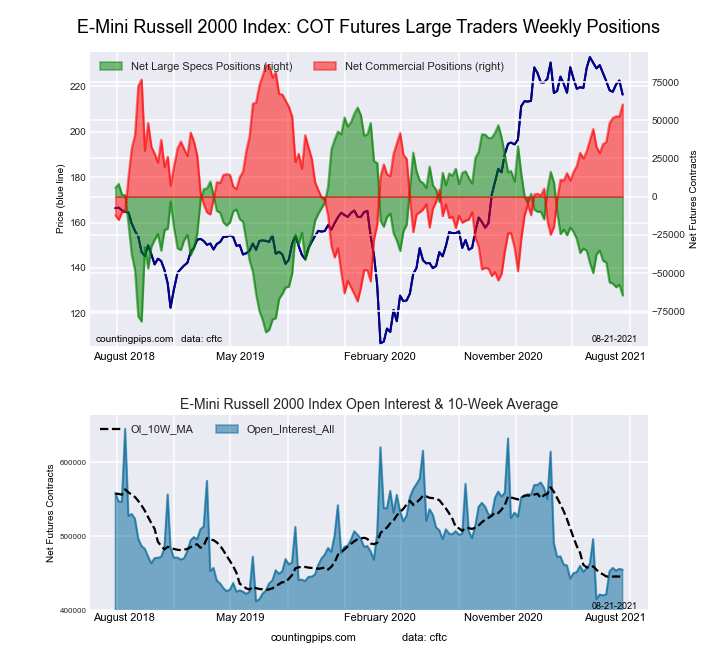
Ultra 10-Year Treasury Notes Bonds Futures COT ChartThe Russell 2000 Mini large speculator standing this week was a net position of -64,687 contracts in the data reported through Tuesday. This was a weekly decline of -7,152 contracts from the previous week which had a total of -57,535 net contracts.

This week’s current strength score (the trader positioning range over the past three years, measured from 0 to 100) shows the speculators are currently Bearish-Extreme with a score of 16.4 percent. The commercials are Bullish-Extreme with a score of 83.4 percent and the small traders (not shown in chart) are Bearish with a score of 45.4 percent.

Russell 2000 Mini Futures StatisticsSPECULATORSCOMMERCIALSSMALL TRADERS
– Percent of Open Interest Longs:11.181.66.1
– Percent of Open Interest Shorts:25.468.35.1
– Net Position:-64,68760,3204,367
– Gross Longs:50,577370,58627,602
– Gross Shorts:115,264310,26623,235
– Long to Short Ratio:0.4 to 11.2 to 11.2 to 1
NET POSITION TREND:
– COT Index Score (3 Year Range Pct):16.483.445.4
– COT Index Reading (3 Year Range):Bearish-ExtremeBullish-ExtremeBearish
NET POSITION MOVEMENT INDEX:
– 6-Week Change in Strength Index:-15.516.8-9.1


Nikkei Stock Average (USD) Futures:

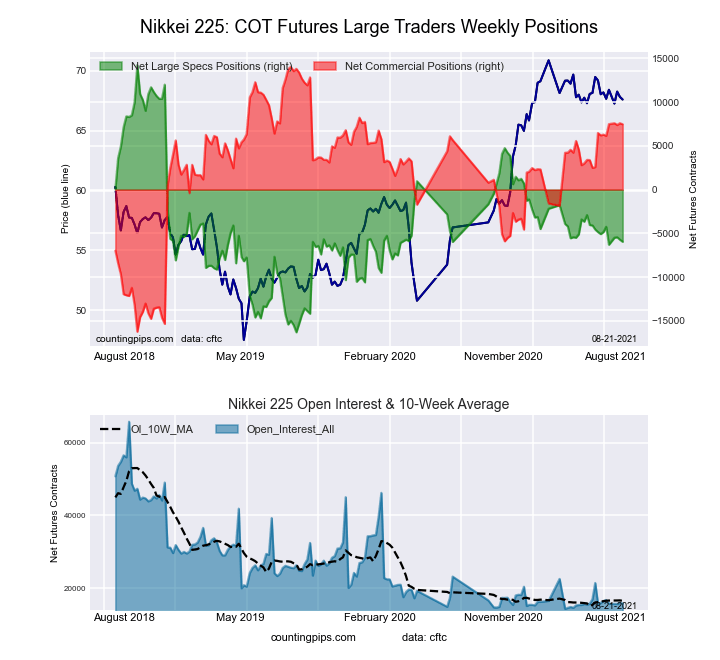
US Year Treasury Notes Long Bonds Futures COT ChartThe Nikkei Stock Average (USD) large speculator standing this week was a net position of -5,952 contracts in the data reported through Tuesday. This was a weekly decrease of -230 contracts from the previous week which had a total of -5,722 net contracts.

This week’s current strength score (the trader positioning range over the past three years, measured from 0 to 100) shows the speculators are currently Bearish with a score of 33.9 percent. The commercials are Bullish with a score of 78.3 percent and the small traders (not shown in chart) are Bearish-Extreme with a score of 6.4 percent.

Nikkei Stock Average Futures StatisticsSPECULATORSCOMMERCIALSSMALL TRADERS
– Percent of Open Interest Longs:13.362.424.3
– Percent of Open Interest Shorts:50.915.333.9
– Net Position:-5,9527,464-1,512
– Gross Longs:2,1079,8803,850
– Gross Shorts:8,0592,4165,362
– Long to Short Ratio:0.3 to 14.1 to 10.7 to 1
NET POSITION TREND:
– COT Index Score (3 Year Range Pct):33.978.36.4
– COT Index Reading (3 Year Range):BearishBullishBearish-Extreme
NET POSITION MOVEMENT INDEX:
– 6-Week Change in Strength Index:-3.63.9-0.8


MSCI EAFE Mini Futures:

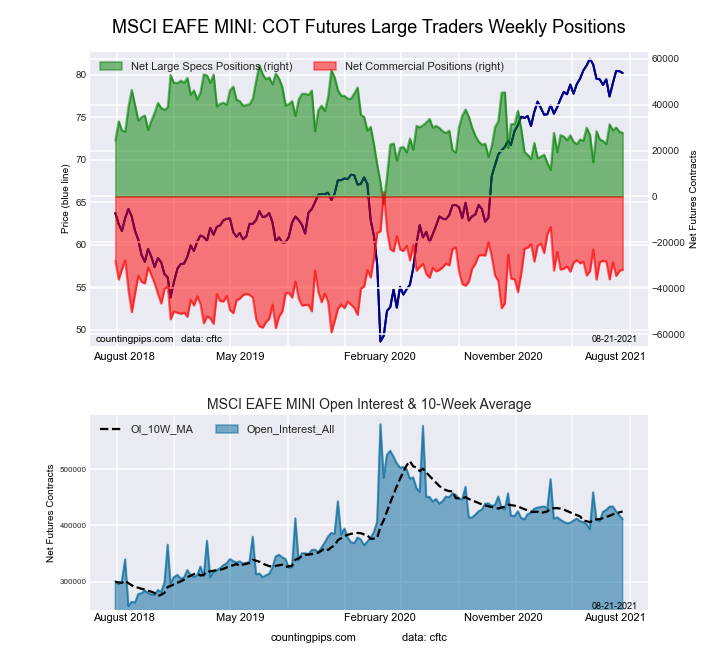
Ultra US Year Treasury Notes Long Bonds Futures COT ChartThe MSCI EAFE Mini large speculator standing this week was a net position of 27,720 contracts in the data reported through Tuesday. This was a weekly reduction of -480 contracts from the previous week which had a total of 28,200 net contracts.

This week’s current strength score (the trader positioning range over the past three years, measured from 0 to 100) shows the speculators are currently Bullish with a score of 51.4 percent. The commercials are Bearish with a score of 44.7 percent and the small traders (not shown in chart) are Bullish with a score of 53.6 percent.

MSCI EAFE Mini Futures StatisticsSPECULATORSCOMMERCIALSSMALL TRADERS
– Percent of Open Interest Longs:10.786.42.7
– Percent of Open Interest Shorts:3.994.11.7
– Net Position:27,720-31,8764,156
– Gross Longs:43,823355,11410,973
– Gross Shorts:16,103386,9906,817
– Long to Short Ratio:2.7 to 10.9 to 11.6 to 1
NET POSITION TREND:
– COT Index Score (3 Year Range Pct):51.444.753.6
– COT Index Reading (3 Year Range):BullishBearishBullish
NET POSITION MOVEMENT INDEX:
– 6-Week Change in Strength Index:5.9-6.32.9


MSCI Emerging Mkts Mini Futures:

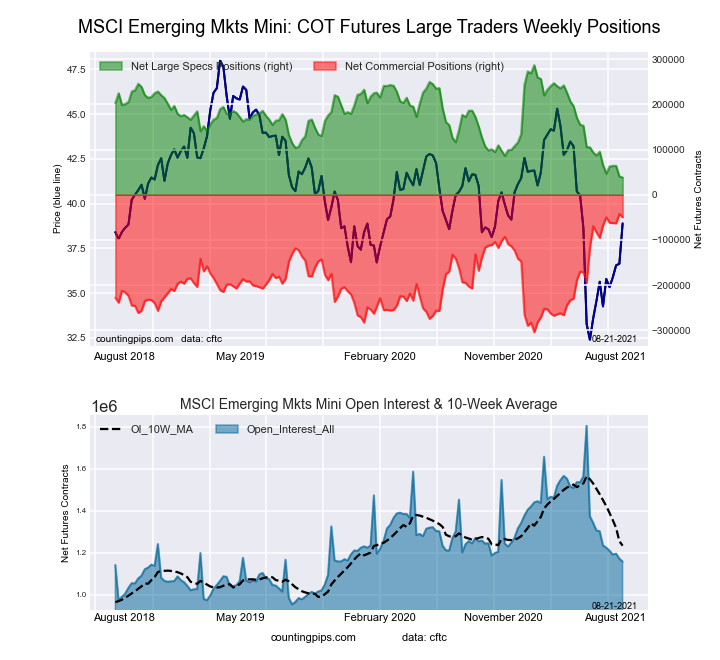
Eurodollar Bonds Futures COT ChartThe MSCI Emerging Mkts Mini large speculator standing this week was a net position of 38,211 contracts in the data reported through Tuesday. This was a weekly decline of -2,219 contracts from the previous week which had a total of 40,430 net contracts.

This week’s current strength score (the trader positioning range over the past three years, measured from 0 to 100) shows the speculators are currently Bearish-Extreme with a score of 0.0 percent. The commercials are Bullish-Extreme with a score of 97.2 percent and the small traders (not shown in chart) are Bearish with a score of 40.4 percent.

MSCI Emerging Mkts Mini Futures StatisticsSPECULATORSCOMMERCIALSSMALL TRADERS
– Percent of Open Interest Longs:14.382.22.4
– Percent of Open Interest Shorts:11.086.51.3
– Net Position:38,211-49,88611,675
– Gross Longs:165,150950,68527,250
– Gross Shorts:126,9391,000,57115,575
– Long to Short Ratio:1.3 to 11.0 to 11.7 to 1
NET POSITION TREND:
– COT Index Score (3 Year Range Pct):0.097.240.4
– COT Index Reading (3 Year Range):Bearish-ExtremeBullish-ExtremeBearish
NET POSITION MOVEMENT INDEX:
– 6-Week Change in Strength Index:-11.06.87.3


Article By CountingPips.comReceive our weekly COT Reports by Email

*COT Report: The COT data, released weekly to the public each Friday, is updated through the most recent Tuesday (data is 3 days old) and shows a quick view of how large speculators or non-commercials (for-profit traders) were positioned in the futures markets.

The CFTC categorizes trader positions according to commercial hedgers (traders who use futures contracts for hedging as part of the business), non-commercials (large traders who speculate to realize trading profits) and nonreportable traders (usually small traders/speculators).

Find CFTC criteria here: (http://www.cftc.gov/MarketReports/CommitmentsofTraders/ExplanatoryNotes/index.htm).
COT Energy Futures Charts: Brent Crude Oil, NatGas, Bloomberg Com Index, Heating Oil, WTI Oil

By CountingPips.com COT Home | Data Tables | Data Downloads | Newsletter

Here are the latest charts and statistics for the Commitment of Traders (COT) data published by the Commodities Futures Trading Commission (CFTC).

The latest COT data is updated through Tuesday August 17 2021 and shows a quick view of how large traders (for-profit speculators and commercial entities) were positioned in the futures markets.


WTI Crude Oil Futures :

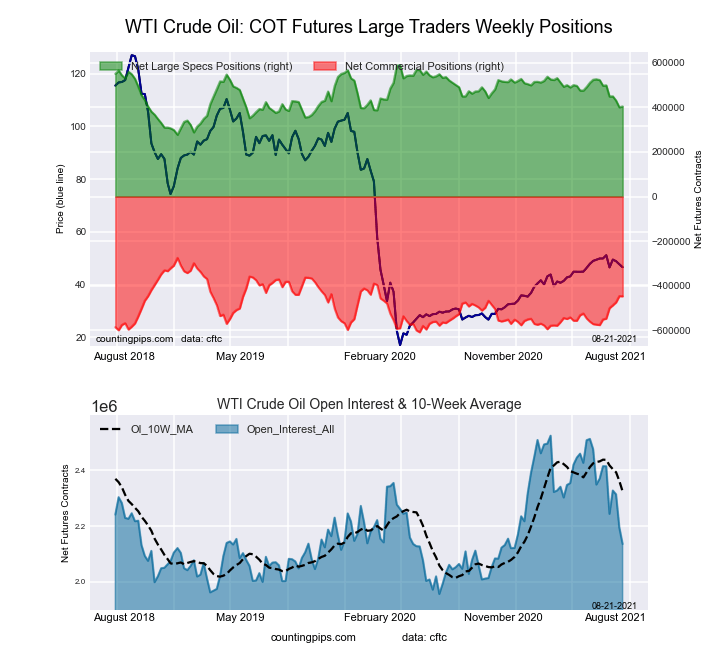
WTI Crude Oil Futures COT ChartThe WTI Crude Oil Futures large speculator standing this week recorded a net position of 404,323 contracts in the data reported through Tuesday. This was a weekly advance of 3,910 contracts from the previous week which had a total of 400,413 net contracts.

This week’s current strength score (the trader positioning range over the past three years, measured from 0 to 100) shows the speculators are currently Bearish with a score of 40.7 percent. The commercials are Bearish with a score of 48.4 percent and the small traders (not shown in chart) are Bullish with a score of 75.5 percent.

WTI Crude Oil Futures StatisticsSPECULATORSCOMMERCIALSSMALL TRADERS
– Percent of Open Interest Longs:25.233.44.3
– Percent of Open Interest Shorts:6.354.32.3
– Net Position:404,323-447,25442,931
– Gross Longs:538,862712,34791,029
– Gross Shorts:134,5391,159,60148,098
– Long to Short Ratio:4.0 to 10.6 to 11.9 to 1
NET POSITION TREND:
– COT Index Score (3 Year Range Pct):40.748.475.5
– COT Index Reading (3 Year Range):BearishBearishBullish
NET POSITION MOVEMENT INDEX:
– 6-Week Change in Strength Index:-29.831.2-15.6


Brent Crude Oil Futures :

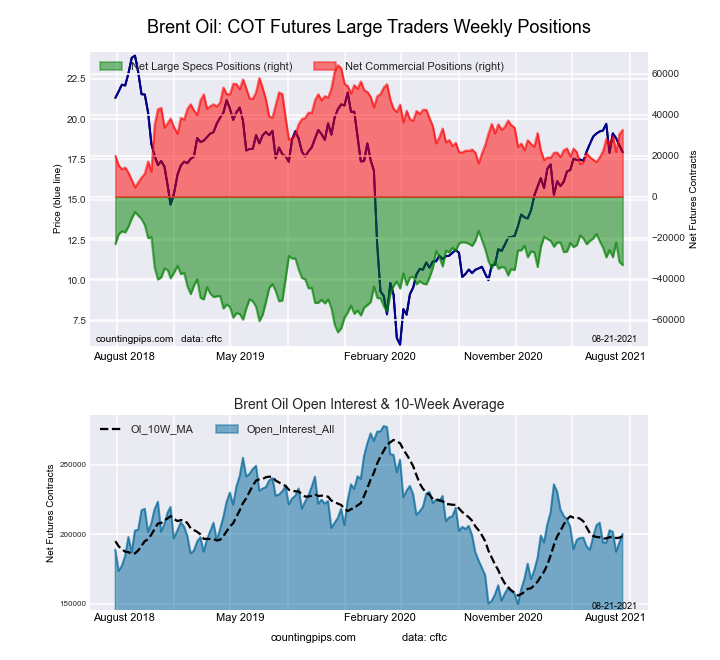
Brent Last Day Crude Oil Futures COT ChartThe Brent Crude Oil Futures large speculator standing this week recorded a net position of -33,377 contracts in the data reported through Tuesday. This was a weekly decline of -1,553 contracts from the previous week which had a total of -31,824 net contracts.

This week’s current strength score (the trader positioning range over the past three years, measured from 0 to 100) shows the speculators are currently Bullish with a score of 55.8 percent. The commercials are Bearish with a score of 47.1 percent and the small traders (not shown in chart) are Bearish with a score of 42.1 percent.

Brent Crude Oil Futures StatisticsSPECULATORSCOMMERCIALSSMALL TRADERS
– Percent of Open Interest Longs:17.054.23.8
– Percent of Open Interest Shorts:33.737.93.4
– Net Position:-33,37732,613764
– Gross Longs:33,994108,3747,522
– Gross Shorts:67,37175,7616,758
– Long to Short Ratio:0.5 to 11.4 to 11.1 to 1
NET POSITION TREND:
– COT Index Score (3 Year Range Pct):55.847.142.1
– COT Index Reading (3 Year Range):BullishBearishBearish
NET POSITION MOVEMENT INDEX:
– 6-Week Change in Strength Index:-14.517.4-16.3


Natural Gas Futures :

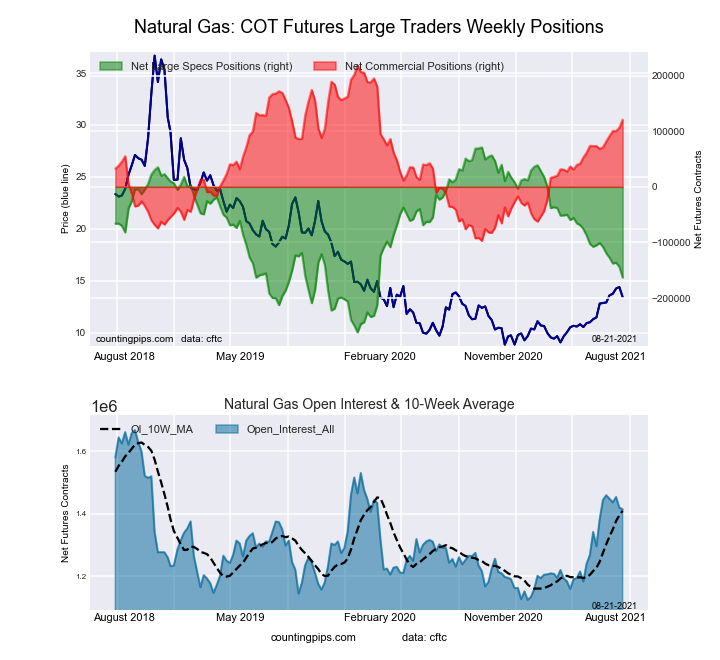
Natural Gas Futures COT ChartThe Natural Gas Futures large speculator standing this week recorded a net position of -163,065 contracts in the data reported through Tuesday. This was a weekly fall of -19,145 contracts from the previous week which had a total of -143,920 net contracts.

This week’s current strength score (the trader positioning range over the past three years, measured from 0 to 100) shows the speculators are currently Bearish with a score of 29.6 percent. The commercials are Bullish with a score of 69.0 percent and the small traders (not shown in chart) are Bullish-Extreme with a score of 82.4 percent.

Natural Gas Futures StatisticsSPECULATORSCOMMERCIALSSMALL TRADERS
– Percent of Open Interest Longs:23.744.35.0
– Percent of Open Interest Shorts:35.235.72.0
– Net Position:-163,065120,76842,297
– Gross Longs:335,240626,40370,417
– Gross Shorts:498,305505,63528,120
– Long to Short Ratio:0.7 to 11.2 to 12.5 to 1
NET POSITION TREND:
– COT Index Score (3 Year Range Pct):29.669.082.4
– COT Index Reading (3 Year Range):BearishBullishBullish-Extreme
NET POSITION MOVEMENT INDEX:
– 6-Week Change in Strength Index:-16.515.618.2


Gasoline Blendstock Futures :

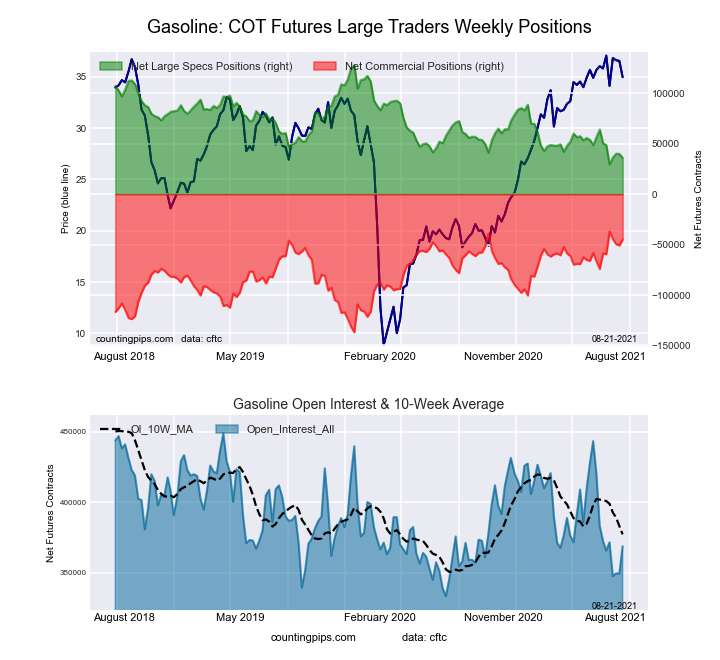
RBOB Gasoline Energy Futures COT ChartThe Gasoline Blendstock Futures large speculator standing this week recorded a net position of 35,747 contracts in the data reported through Tuesday. This was a weekly decline of -4,091 contracts from the previous week which had a total of 39,838 net contracts.

This week’s current strength score (the trader positioning range over the past three years, measured from 0 to 100) shows the speculators are currently Bearish-Extreme with a score of 6.5 percent. The commercials are Bullish-Extreme with a score of 92.0 percent and the small traders (not shown in chart) are Bullish with a score of 67.1 percent.

Nasdaq Mini Futures StatisticsSPECULATORSCOMMERCIALSSMALL TRADERS
– Percent of Open Interest Longs:26.751.16.3
– Percent of Open Interest Shorts:17.063.33.8
– Net Position:35,747-45,0469,299
– Gross Longs:98,409188,29423,373
– Gross Shorts:62,662233,34014,074
– Long to Short Ratio:1.6 to 10.8 to 11.7 to 1
NET POSITION TREND:
– COT Index Score (3 Year Range Pct):6.592.067.1
– COT Index Reading (3 Year Range):Bearish-ExtremeBullish-ExtremeBullish
NET POSITION MOVEMENT INDEX:
– 6-Week Change in Strength Index:-14.913.76.0


#2 Heating Oil NY-Harbor Futures :

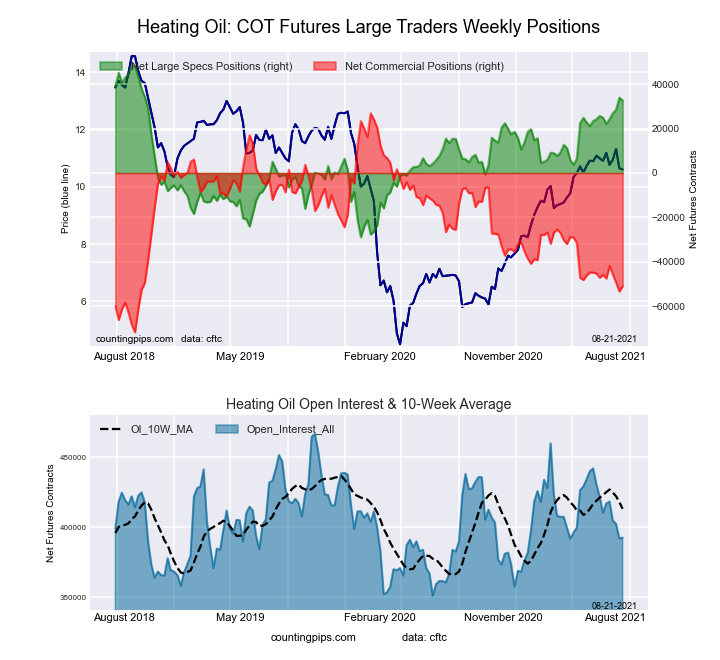
NY Harbor Heating Oil Energy Futures COT ChartThe #2 Heating Oil NY-Harbor Futures large speculator standing this week recorded a net position of 32,579 contracts in the data reported through Tuesday. This was a weekly decrease of -1,336 contracts from the previous week which had a total of 33,915 net contracts.

This week’s current strength score (the trader positioning range over the past three years, measured from 0 to 100) shows the speculators are currently Bullish with a score of 79.4 percent. The commercials are Bearish with a score of 21.0 percent and the small traders (not shown in chart) are Bullish with a score of 72.0 percent.

Heating Oil Futures StatisticsSPECULATORSCOMMERCIALSSMALL TRADERS
– Percent of Open Interest Longs:18.652.511.1
– Percent of Open Interest Shorts:10.365.56.4
– Net Position:32,579-50,96218,383
– Gross Longs:72,810206,12043,399
– Gross Shorts:40,231257,08225,016
– Long to Short Ratio:1.8 to 10.8 to 11.7 to 1
NET POSITION TREND:
– COT Index Score (3 Year Range Pct):79.421.072.0
– COT Index Reading (3 Year Range):BullishBearishBullish
NET POSITION MOVEMENT INDEX:
– 6-Week Change in Strength Index:10.0-5.3-10.1


Bloomberg Commodity Index Futures :

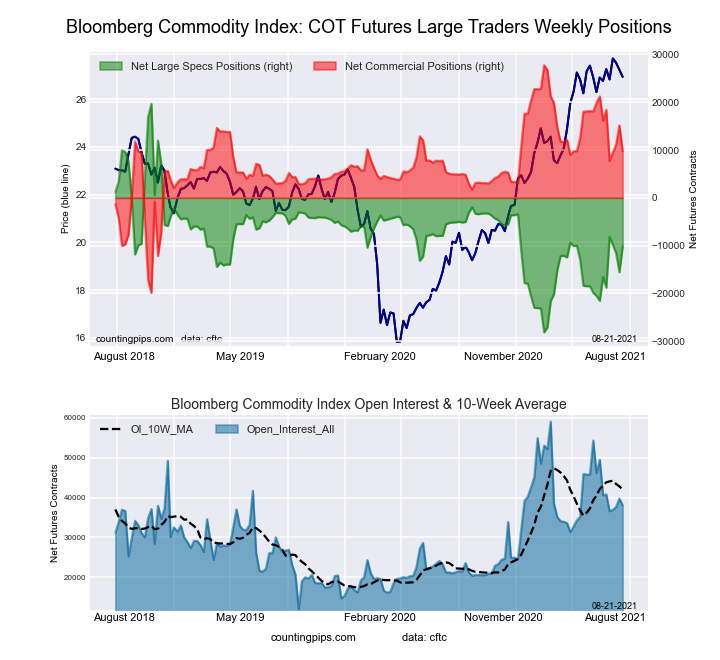
Bloomberg Commodity Index Futures COT ChartThe Bloomberg Commodity Index Futures large speculator standing this week recorded a net position of -10,133 contracts in the data reported through Tuesday. This was a weekly lift of 5,417 contracts from the previous week which had a total of -15,550 net contracts.

This week’s current strength score (the trader positioning range over the past three years, measured from 0 to 100) shows the speculators are currently Bearish with a score of 37.6 percent. The commercials are Bullish with a score of 62.2 percent and the small traders (not shown in chart) are Bearish with a score of 40.4 percent.

Bloomberg Index Futures StatisticsSPECULATORSCOMMERCIALSSMALL TRADERS
– Percent of Open Interest Longs:63.534.61.2
– Percent of Open Interest Shorts:90.18.90.3
– Net Position:-10,1339,766367
– Gross Longs:24,15013,166475
– Gross Shorts:34,2833,400108
– Long to Short Ratio:0.7 to 13.9 to 14.4 to 1
NET POSITION TREND:
– COT Index Score (3 Year Range Pct):37.662.240.4
– COT Index Reading (3 Year Range):BearishBullishBearish
NET POSITION MOVEMENT INDEX:
– 6-Week Change in Strength Index:13.4-13.51.1


Article By CountingPips.comReceive our weekly COT Reports by Email

*COT Report: The COT data, released weekly to the public each Friday, is updated through the most recent Tuesday (data is 3 days old) and shows a quick view of how large speculators or non-commercials (for-profit traders) were positioned in the futures markets.

The CFTC categorizes trader positions according to commercial hedgers (traders who use futures contracts for hedging as part of the business), non-commercials (large traders who speculate to realize trading profits) and nonreportable traders (usually small traders/speculators).

Find CFTC criteria here: (http://www.cftc.gov/MarketReports/CommitmentsofTraders/ExplanatoryNotes/index.htm).
COT Soft Commodities Futures Charts: Corn, Soybeans, Wheat, Cattle, Hogs, Sugar, Coffee, Cotton

By CountingPips.com COT Home | Data Tables | Data Downloads | Newsletter

Here are the latest charts and statistics for the Commitment of Traders (COT) data published by the Commodities Futures Trading Commission (CFTC).

The latest COT data is updated through Tuesday August 17 2021 and shows a quick view of how large traders (for-profit speculators and commercial entities) were positioned in the futures markets.


CORN Futures:

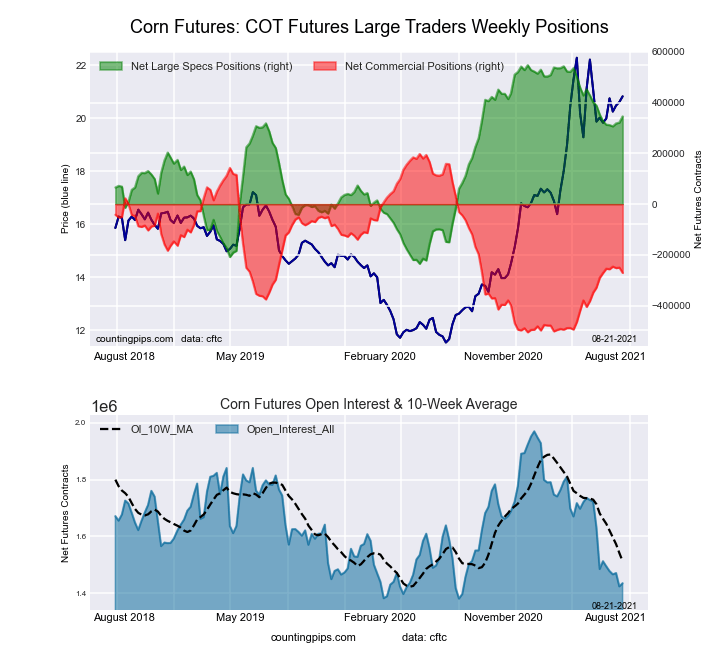
Federal Funds 30-Day Bonds Futures COT ChartThe CORN large speculator standing this week was a net position of 345,846 contracts in the data reported through Tuesday. This was a weekly gain of 24,287 contracts from the previous week which had a total of 321,559 net contracts.

This week’s current strength score (the trader positioning range over the past three years, measured from 0 to 100) shows the speculators are currently Bullish with a score of 74.2 percent. The commercials are Bearish with a score of 33.3 percent and the small traders (not shown in chart) are Bearish-Extreme with a score of 0.0 percent.

CORN Futures StatisticsSPECULATORSCOMMERCIALSSMALL TRADERS
– Percent of Open Interest Longs:30.147.68.4
– Percent of Open Interest Shorts:6.066.513.6
– Net Position:345,846-270,993-74,853
– Gross Longs:432,298683,412119,894
– Gross Shorts:86,452954,405194,747
– Long to Short Ratio:5.0 to 10.7 to 10.6 to 1
NET POSITION TREND:
– COT Index Score (3 Year Range Pct):74.233.30.0
– COT Index Reading (3 Year Range):BullishBearishBearish-Extreme
NET POSITION MOVEMENT INDEX:
– 6-Week Change in Strength Index:2.40.1-11.2


SUGAR Futures:

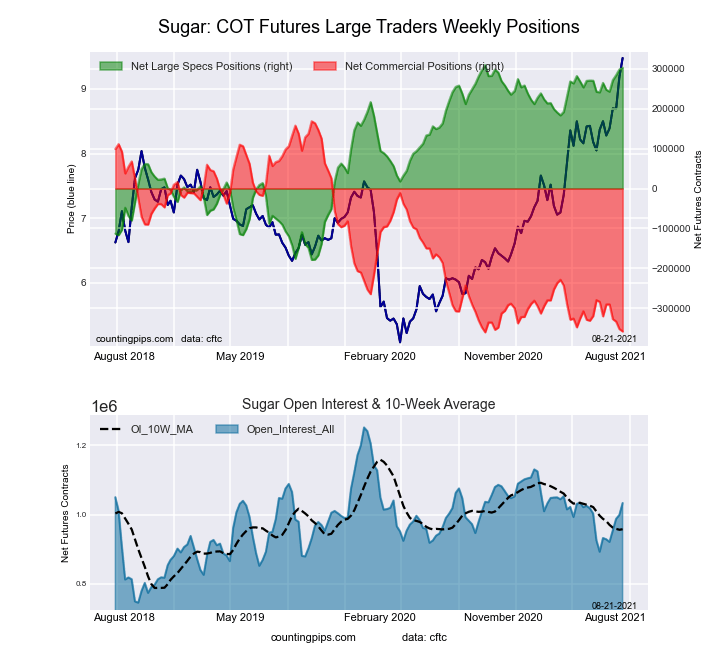
2-Year Treasury Bonds Futures COT ChartThe SUGAR large speculator standing this week was a net position of 302,267 contracts in the data reported through Tuesday. This was a weekly rise of 4,846 contracts from the previous week which had a total of 297,421 net contracts.

This week’s current strength score (the trader positioning range over the past three years, measured from 0 to 100) shows the speculators are currently Bullish-Extreme with a score of 98.7 percent. The commercials are Bearish-Extreme with a score of 0.4 percent and the small traders (not shown in chart) are Bullish with a score of 76.0 percent.

SUGAR Futures StatisticsSPECULATORSCOMMERCIALSSMALL TRADERS
– Percent of Open Interest Longs:32.942.89.3
– Percent of Open Interest Shorts:3.677.43.9
– Net Position:302,267-357,40655,139
– Gross Longs:339,414442,14195,926
– Gross Shorts:37,147799,54740,787
– Long to Short Ratio:9.1 to 10.6 to 12.4 to 1
NET POSITION TREND:
– COT Index Score (3 Year Range Pct):98.70.476.0
– COT Index Reading (3 Year Range):Bullish-ExtremeBearish-ExtremeBullish
NET POSITION MOVEMENT INDEX:
– 6-Week Change in Strength Index:7.9-7.2-0.6


COFFEE Futures:

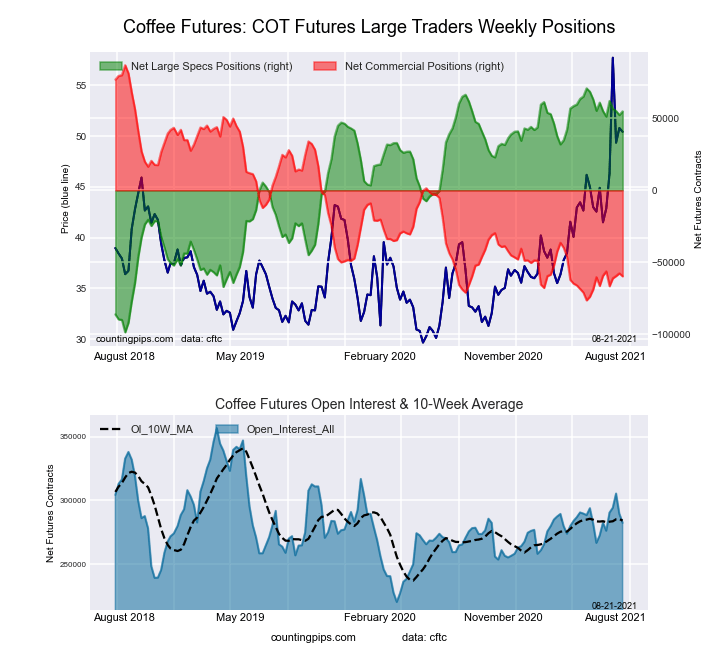
5-Year Treasury Bonds Futures COT ChartThe COFFEE large speculator standing this week was a net position of 54,797 contracts in the data reported through Tuesday. This was a weekly gain of 2,531 contracts from the previous week which had a total of 52,266 net contracts.

This week’s current strength score (the trader positioning range over the past three years, measured from 0 to 100) shows the speculators are currently Bullish-Extreme with a score of 90.6 percent. The commercials are Bearish-Extreme with a score of 10.2 percent and the small traders (not shown in chart) are Bearish with a score of 21.9 percent.

COFFEE Futures StatisticsSPECULATORSCOMMERCIALSSMALL TRADERS
– Percent of Open Interest Longs:26.346.03.9
– Percent of Open Interest Shorts:6.967.12.2
– Net Position:54,797-59,6434,846
– Gross Longs:74,249129,83811,124
– Gross Shorts:19,452189,4816,278
– Long to Short Ratio:3.8 to 10.7 to 11.8 to 1
NET POSITION TREND:
– COT Index Score (3 Year Range Pct):90.610.221.9
– COT Index Reading (3 Year Range):Bullish-ExtremeBearish-ExtremeBearish
NET POSITION MOVEMENT INDEX:
– 6-Week Change in Strength Index:-0.1-0.23.8


SOYBEANS Futures:

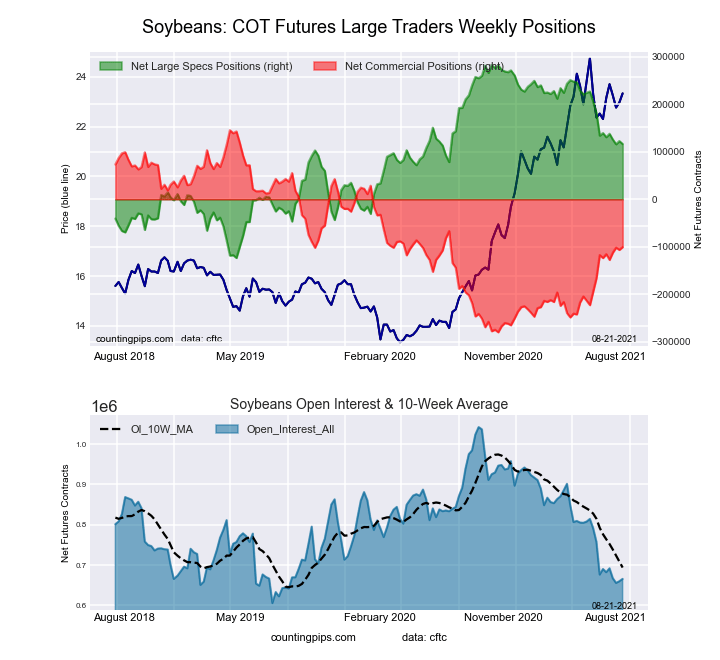
10-Year Treasury Notes Bonds Futures COT ChartThe SOYBEANS large speculator standing this week was a net position of 116,404 contracts in the data reported through Tuesday. This was a weekly reduction of -5,992 contracts from the previous week which had a total of 122,396 net contracts.

This week’s current strength score (the trader positioning range over the past three years, measured from 0 to 100) shows the speculators are currently Bullish with a score of 59.1 percent. The commercials are Bearish with a score of 42.2 percent and the small traders (not shown in chart) are Bearish with a score of 45.5 percent.

SOYBEANS Futures StatisticsSPECULATORSCOMMERCIALSSMALL TRADERS
– Percent of Open Interest Longs:27.451.66.9
– Percent of Open Interest Shorts:9.966.79.3
– Net Position:116,404-100,593-15,811
– Gross Longs:182,539343,27545,953
– Gross Shorts:66,135443,86861,764
– Long to Short Ratio:2.8 to 10.8 to 10.7 to 1
NET POSITION TREND:
– COT Index Score (3 Year Range Pct):59.142.245.5
– COT Index Reading (3 Year Range):BullishBearishBearish
NET POSITION MOVEMENT INDEX:
– 6-Week Change in Strength Index:-5.65.4-0.3


SOYBEAN OIL Futures:

Ultra 10-Year Treasury Notes Bonds Futures COT ChartThe SOYBEAN OIL large speculator standing this week was a net position of 59,517 contracts in the data reported through Tuesday. This was a weekly gain of 3,102 contracts from the previous week which had a total of 56,415 net contracts.

This week’s current strength score (the trader positioning range over the past three years, measured from 0 to 100) shows the speculators are currently Bullish with a score of 61.3 percent. The commercials are Bearish with a score of 40.4 percent and the small traders (not shown in chart) are Bearish with a score of 47.7 percent.

SOYBEAN OIL Futures StatisticsSPECULATORSCOMMERCIALSSMALL TRADERS
– Percent of Open Interest Longs:19.850.97.2
– Percent of Open Interest Shorts:7.465.25.3
– Net Position:59,517-68,6909,173
– Gross Longs:95,068243,98334,536
– Gross Shorts:35,551312,67325,363
– Long to Short Ratio:2.7 to 10.8 to 11.4 to 1
NET POSITION TREND:
– COT Index Score (3 Year Range Pct):61.340.447.7
– COT Index Reading (3 Year Range):BullishBearishBearish
NET POSITION MOVEMENT INDEX:
– 6-Week Change in Strength Index:-14.117.1-32.9


SOYBEAN MEAL Futures:

US Year Treasury Notes Long Bonds Futures COT ChartThe SOYBEAN MEAL large speculator standing this week was a net position of 54,947 contracts in the data reported through Tuesday. This was a weekly increase of 2,089 contracts from the previous week which had a total of 52,858 net contracts.

This week’s current strength score (the trader positioning range over the past three years, measured from 0 to 100) shows the speculators are currently Bullish with a score of 61.0 percent. The commercials are Bearish with a score of 37.9 percent and the small traders (not shown in chart) are Bullish with a score of 62.2 percent.

SOYBEAN MEAL Futures StatisticsSPECULATORSCOMMERCIALSSMALL TRADERS
– Percent of Open Interest Longs:22.951.512.8
– Percent of Open Interest Shorts:8.072.76.6
– Net Position:54,947-77,80022,853
– Gross Longs:84,323189,48347,117
– Gross Shorts:29,376267,28324,264
– Long to Short Ratio:2.9 to 10.7 to 11.9 to 1
NET POSITION TREND:
– COT Index Score (3 Year Range Pct):61.037.962.2
– COT Index Reading (3 Year Range):BullishBearishBullish
NET POSITION MOVEMENT INDEX:
– 6-Week Change in Strength Index:1.9-2.98.0


LIVE CATTLE Futures:

Ultra US Year Treasury Notes Long Bonds Futures COT ChartThe LIVE CATTLE large speculator standing this week was a net position of 77,785 contracts in the data reported through Tuesday. This was a weekly increase of 2,709 contracts from the previous week which had a total of 75,076 net contracts.

This week’s current strength score (the trader positioning range over the past three years, measured from 0 to 100) shows the speculators are currently Bearish with a score of 41.3 percent. The commercials are Bullish with a score of 55.6 percent and the small traders (not shown in chart) are Bullish with a score of 52.2 percent.

LIVE CATTLE Futures StatisticsSPECULATORSCOMMERCIALSSMALL TRADERS
– Percent of Open Interest Longs:39.239.89.5
– Percent of Open Interest Shorts:12.062.014.5
– Net Position:77,785-63,483-14,302
– Gross Longs:112,252113,92827,221
– Gross Shorts:34,467177,41141,523
– Long to Short Ratio:3.3 to 10.6 to 10.7 to 1
NET POSITION TREND:
– COT Index Score (3 Year Range Pct):41.355.652.2
– COT Index Reading (3 Year Range):BearishBullishBullish
NET POSITION MOVEMENT INDEX:
– 6-Week Change in Strength Index:3.80.4-15.0


LEAN HOGS Futures:

Eurodollar Bonds Futures COT ChartThe LEAN HOGS large speculator standing this week was a net position of 73,725 contracts in the data reported through Tuesday. This was a weekly decrease of -4,363 contracts from the previous week which had a total of 78,088 net contracts.

This week’s current strength score (the trader positioning range over the past three years, measured from 0 to 100) shows the speculators are currently Bullish-Extreme with a score of 87.9 percent. The commercials are Bearish-Extreme with a score of 18.3 percent and the small traders (not shown in chart) are Bearish-Extreme with a score of 10.7 percent.

LEAN HOGS Futures StatisticsSPECULATORSCOMMERCIALSSMALL TRADERS
– Percent of Open Interest Longs:44.530.47.3
– Percent of Open Interest Shorts:16.952.712.6
– Net Position:73,725-59,577-14,148
– Gross Longs:118,72581,13519,482
– Gross Shorts:45,000140,71233,630
– Long to Short Ratio:2.6 to 10.6 to 10.6 to 1
NET POSITION TREND:
– COT Index Score (3 Year Range Pct):87.918.310.7
– COT Index Reading (3 Year Range):Bullish-ExtremeBearish-ExtremeBearish-Extreme
NET POSITION MOVEMENT INDEX:
– 6-Week Change in Strength Index:3.8-1.2-11.4


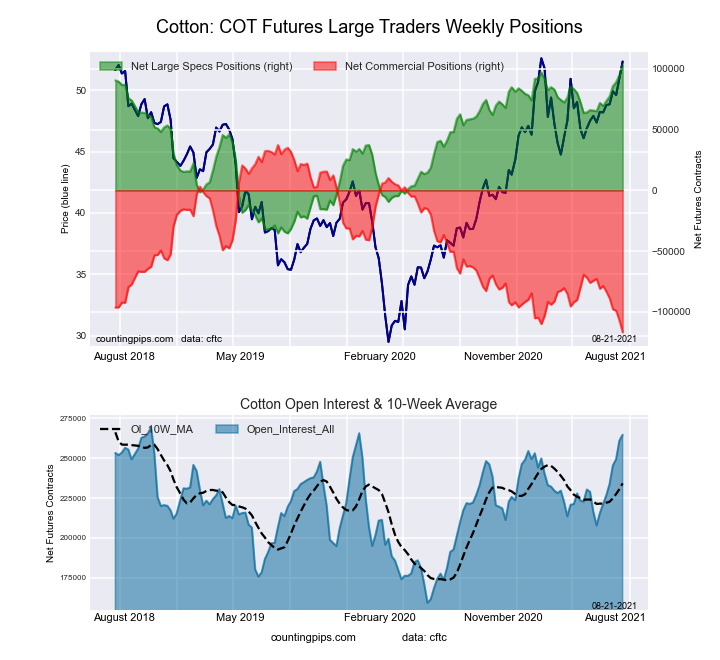
COTTON Futures:

Ultra 10-Year Treasury Notes Bonds Futures COT ChartThe COTTON large speculator standing this week was a net position of 103,031 contracts in the data reported through Tuesday. This was a weekly lift of 8,119 contracts from the previous week which had a total of 94,912 net contracts.

This week’s current strength score (the trader positioning range over the past three years, measured from 0 to 100) shows the speculators are currently Bullish-Extreme with a score of 100.0 percent. The commercials are Bearish-Extreme with a score of 0.0 percent and the small traders (not shown in chart) are Bullish-Extreme with a score of 100.0 percent.

COTTON Futures StatisticsSPECULATORSCOMMERCIALSSMALL TRADERS
– Percent of Open Interest Longs:44.435.77.9
– Percent of Open Interest Shorts:5.579.92.6
– Net Position:103,031-116,88113,850
– Gross Longs:117,52694,52820,808
– Gross Shorts:14,495211,4096,958
– Long to Short Ratio:8.1 to 10.4 to 13.0 to 1
NET POSITION TREND:
– COT Index Score (3 Year Range Pct):100.00.0100.0
– COT Index Reading (3 Year Range):Bullish-ExtremeBearish-ExtremeBullish-Extreme
NET POSITION MOVEMENT INDEX:
– 6-Week Change in Strength Index:24.2-24.829.3


COCOA Futures:

US Year Treasury Notes Long Bonds Futures COT ChartThe COCOA large speculator standing this week was a net position of 13,326 contracts in the data reported through Tuesday. This was a weekly gain of 4,559 contracts from the previous week which had a total of 8,767 net contracts.

This week’s current strength score (the trader positioning range over the past three years, measured from 0 to 100) shows the speculators are currently Bearish with a score of 35.5 percent. The commercials are Bullish with a score of 64.5 percent and the small traders (not shown in chart) are Bearish with a score of 39.9 percent.

COCOA Futures StatisticsSPECULATORSCOMMERCIALSSMALL TRADERS
– Percent of Open Interest Longs:27.348.24.7
– Percent of Open Interest Shorts:22.054.63.6
– Net Position:13,326-16,0922,766
– Gross Longs:68,772121,39011,767
– Gross Shorts:55,446137,4829,001
– Long to Short Ratio:1.2 to 10.9 to 11.3 to 1
NET POSITION TREND:
– COT Index Score (3 Year Range Pct):35.564.539.9
– COT Index Reading (3 Year Range):BearishBullishBearish
NET POSITION MOVEMENT INDEX:
– 6-Week Change in Strength Index:-13.315.1-26.6


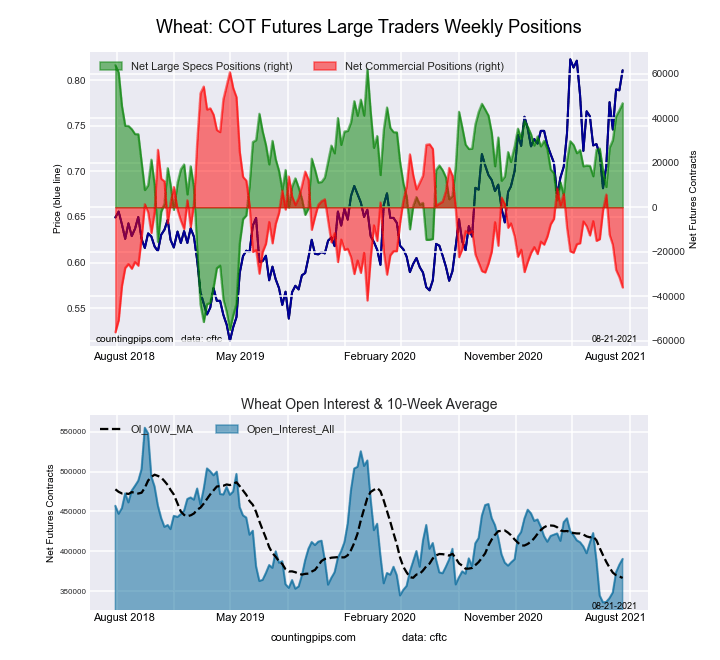
WHEAT Futures:

Ultra US Year Treasury Notes Long Bonds Futures COT ChartThe WHEAT large speculator standing this week was a net position of 46,794 contracts in the data reported through Tuesday. This was a weekly increase of 3,162 contracts from the previous week which had a total of 43,632 net contracts.

This week’s current strength score (the trader positioning range over the past three years, measured from 0 to 100) shows the speculators are currently Bullish-Extreme with a score of 85.6 percent. The commercials are Bearish-Extreme with a score of 17.2 percent and the small traders (not shown in chart) are Bullish with a score of 50.4 percent.

WHEAT Futures StatisticsSPECULATORSCOMMERCIALSSMALL TRADERS
– Percent of Open Interest Longs:35.235.57.7
– Percent of Open Interest Shorts:23.244.710.5
– Net Position:46,794-36,088-10,706
– Gross Longs:137,475138,51630,181
– Gross Shorts:90,681174,60440,887
– Long to Short Ratio:1.5 to 10.8 to 10.7 to 1
NET POSITION TREND:
– COT Index Score (3 Year Range Pct):85.617.250.4
– COT Index Reading (3 Year Range):Bullish-ExtremeBearish-ExtremeBullish
NET POSITION MOVEMENT INDEX:
– 6-Week Change in Strength Index:25.4-29.721.6


Article By CountingPips.comReceive our weekly COT Reports by Email

*COT Report: The COT data, released weekly to the public each Friday, is updated through the most recent Tuesday (data is 3 days old) and shows a quick view of how large speculators or non-commercials (for-profit traders) were positioned in the futures markets.

The CFTC categorizes trader positions according to commercial hedgers (traders who use futures contracts for hedging as part of the business), non-commercials (large traders who speculate to realize trading profits) and nonreportable traders (usually small traders/speculators).

Find CFTC criteria here: (http://www.cftc.gov/MarketReports/CommitmentsofTraders/ExplanatoryNotes/index.htm).
Top Three Biggest Mistakes Made By Options Traders

By TheTechnicalTraders 

I have been trading options and coaching / mentoring new options traders for years.  I have seen new traders who were blindly successful and others who were so frustrated on the verge of giving up,  I have seen it all.  Over the years, I have seen some very common themes among all traders, especially with options.  Options trading can be very rewarding but it is not as easy as buying and selling stocks.  There are many more factors and variables you must take into consideration when trading options especially if you are swing trading them or holding them for an extended period of time.

There is a certain skill it requires that is a mix of technical, statistical, and fundamental analysis.  These are not skills everyone has and you have to master all three if you want to be a really successful trader.  I have noticed stock traders tend to have a good amount of fundamental and technical skills but usually lack in the statistical area.  This can cause a problem when it comes to their success.  While trading stocks, this might be a great formula that works but when switching to options it could be a losing formula.  Many traders don’t know where they went wrong.

So below are the top three most common mistakes I see new options traders are making on a regular basis that prevents them from being profitable in trading stock options:

1. Understanding Historical and Implied Volatility

Volatility plays a huge part in determining the price and value of an option.  You have to remember these assets are priced based on expected fair value usually by the Black-Scholes Merton (BSM) model.  Below is the formula:

But let’s face it, not many people can really understand that.  All you need to know is depending on when volatility moves how the price moves with it.  The easiest way to do this is to use an options trading platform like ThinkorSwim or TradeStation and let the platform do the heavy lifting to determine what-if scenarios if volatility goes up or down on price.

2. Calculating The Cost of Buying Options

Often, I have seen traders buy options way out of the money hoping for a big move.  Many times, that big move does not happen, then these traders lose.  Even if you buy an option at the money (ATM) you still are expected that underlying stock to move greater than the overall cost of the option.  For example, let’s assume there is a stock called XYZ trading at $100.  You buy a call option that expires one month out for $10.  You are assuming that XYZ will move up $10 to $110 just to break even in that month.  So, your real “intrinsic” cost is $110.  But wait, there is more, you are expecting this to happen within one month.  There is a timer on this event.  So, you need a relatively big move of 10% in less than one month.

3. A Belief They Can Buy Options And Make Millions In A Short Time

It is 100% possible to buy huge positions in options and make millions in a very short time but it is not practical nor is it probable.  It is really just gambling.  Gambling is not a good investing or trading strategy.  Sure, people have won big but for every big winner you hear about, there are thousands blowing up their account.  Usually what I see is people who are successful will keep trading and just like in the casino world they will give it all back and then some.  It is pretty tragic to watch this, and I actually feel more sorry for the ones that have beginner’s luck because they are the ones that end up in the worst spot.  As a person who lived this myself and I have blown up my account 3 times it is not fun and it can break a person both mentally and sometimes physically.  RIP to the Robinhood options trader who killed himself after not understanding how TSLA option position.  Slow and steady is what wins here.  Base hits and not home runs. It’s okay to go for the occasional home run but that should be a VERY small percentage of what you trade.  Look for consistent income and returns from your options trades.  The bottom line is trading options is not a get rich quick ideology and if anyone tells you that they are not telling the whole story.

Every day on OTS – The Technical Traders we do define risk trades that protect us from black swan events 24/7.  Many may think that is what stop losses are for.  Remember the markets are only over about 1/3 of the hours in a day.  Therefore, a stop loss only protects you for 1/3 of each day.  Stocks can gap up or down.  With options, you are always protected because we do define risk in an option spread.  We cover with multiple legs which are always on once you own.

For those of you who are interested in Options Trading, our resident specialist Neil Szczepanski will be hosting a LIVE two-part Intermediate Course beginning on Wednesday, August 25, 2021. Neil will dive deep into the different strategies and outline what are the best trade setups and what to avoid – helping you to become a more knowledgable, confident, and advanced options trader. To learn more, or to register for the course, kindly click on the following link: INTERMEDIATE OPTIONS MENTORING COURSE.

As something entirely new, check out my initiative URLYstart to learn more about the youth entrepreneurship program I am developing. This is an online program of gamified entrepreneurship designed to introduce and inspire youth to start their own businesses. Click-by-click, each student will be guided from their initial idea, through the startup process all the way to their first sale and beyond. Along the way, our students will learn life lessons such as communication, perseverance, goal setting, teamwork, and more. My team and I are passionate about this project and want to reach as many people as possible!

Have a great day!

Chris Vermeulen
Chief Market Strategist

TheTechnicalTraders.com

How a simple crystal could help pave the way to full-scale quantum computing

By Jarryd Pla, UNSW and Andrew Dzurak, UNSW 

Vaccine and drug development, artificial intelligence, transport and logistics, climate science — these are all areas that stand to be transformed by the development of a full-scale quantum computer. And there has been explosive growth in quantum computing investment over the past decade.

Yet current quantum processors are relatively small in scale, with fewer than 100 qubits — the basic building blocks of a quantum computer. Bits are the smallest unit of information in computing, and the term qubits stems from “quantum bits”.

While early quantum processors have been crucial for demonstrating the potential of quantum computing, realising globally significant applications will likely require processors with upwards of a million qubits.

Our new research tackles a core problem at the heart of scaling up quantum computers: how do we go from controlling just a few qubits, to controlling millions? In research published today in Science Advances, we reveal a new technology that may offer a solution.

What exactly is a quantum computer?

Quantum computers use qubits to hold and process quantum information. Unlike the bits of information in classical computers, qubits make use of the quantum properties of nature, known as “superposition” and “entanglement”, to perform some calculations much faster than their classical counterparts.

Unlike a classical bit, which is represented by either 0 or 1, a qubit can exist in two states (that is, 0 and 1) at the same time. This is what we refer to as a superposition state.

Demonstrations by Google and others have shown even current, early-stage quantum computers can outperform the most powerful supercomputers on the planet for a highly specialised (albeit not particularly useful) task — reaching a milestone we call quantum supremacy.

Google’s quantum computer, built from superconducting electrical circuits, had just 53 qubits and was cooled to a temperature close to -273℃ in a high-tech refrigerator. This extreme temperature is needed to remove heat, which can introduce errors to the fragile qubits. While such demonstrations are important, the challenge now is to build quantum processors with many more qubits.

Major efforts are underway at UNSW Sydney to make quantum computers from the same material used in everyday computer chips: silicon. A conventional silicon chip is thumbnail-sized and packs in several billion bits, so the prospect of using this technology to build a quantum computer is compelling.

The control problem

In silicon quantum processors, information is stored in individual electrons, which are trapped beneath small electrodes at the chip’s surface. Specifically, the qubit is coded into the electron’s spin. It can be pictured as a small compass inside the electron. The needle of the compass can point north or south, which represents the 0 and 1 states.

To set a qubit in a superposition state (both 0 and 1), an operation that occurs in all quantum computations, a control signal must be directed to the desired qubit. For qubits in silicon, this control signal is in the form of a microwave field, much like the ones used to carry phone calls over a 5G network. The microwaves interact with the electron and cause its spin (compass needle) to rotate.

Currently, each qubit requires its own microwave control field. It is delivered to the quantum chip through a cable running from room temperature down to the bottom of the refrigerator at close to -273℃. Each cable brings heat with it, which must be removed before it reaches the quantum processor.

At around 50 qubits, which is state-of-the-art today, this is difficult but manageable. Current refrigerator technology can cope with the cable heat load. However, it represents a huge hurdle if we’re to use systems with a million qubits or more.

The solution is ‘global’ control

An elegant solution to the challenge of how to deliver control signals to millions of spin qubits was proposed in the late 1990s. The idea of “global control” was simple: broadcast a single microwave control field across the entire quantum processor.

Voltage pulses can be applied locally to qubit electrodes to make the individual qubits interact with the global field (and produce superposition states).
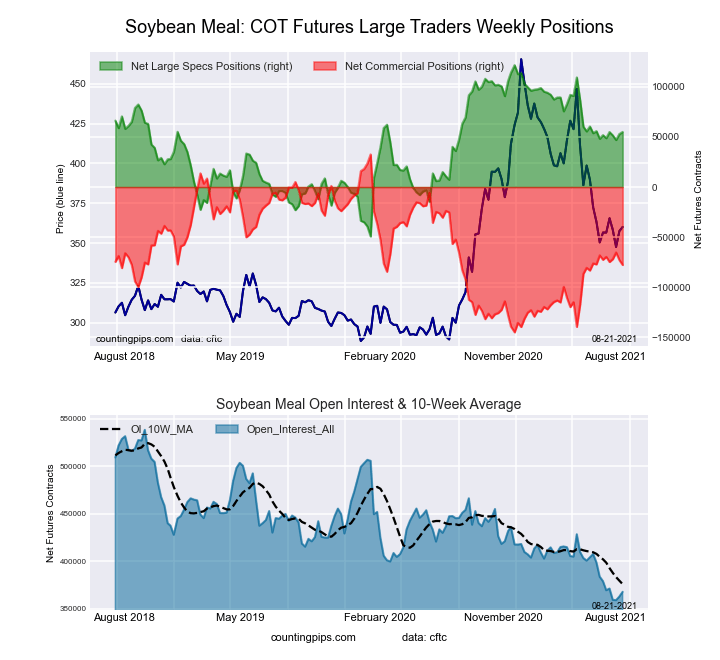
It’s much easier to generate such voltage pulses on-chip than it is to generate multiple microwave fields. The solution requires only a single control cable and removes obtrusive on-chip microwave control circuitry.
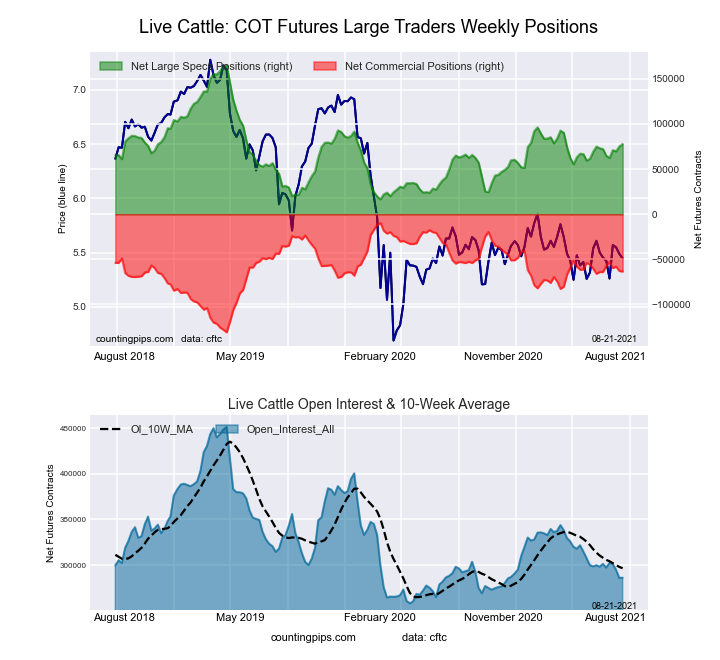
For more than two decades global control in quantum computers remained an idea. Researchers could not devise a suitable technology that could be integrated with a quantum chip and generate microwave fields at suitably low powers.

In our work we show that a component known as a dielectric resonator could finally allow this. The dielectric resonator is a small, transparent crystal which traps microwaves for a short period of time.

The trapping of microwaves, a phenomenon known as resonance, allows them to interact with the spin qubits longer and greatly reduces the power of microwaves needed to generate the control field. This was vital to operating the technology inside the refrigerator.

In our experiment, we used the dielectric resonator to generate a control field over an area that could contain up to four million qubits. The quantum chip used in this demonstration was a device with two qubits. We were able to show the microwaves produced by the crystal could flip the spin state of each one.

The path to a full-scale quantum computer

There is still work to be done before this technology is up to the task of controlling a million qubits. For our study, we managed to flip the state of the qubits, but not yet produce arbitrary superposition states.

Experiments are ongoing to demonstrate this critical capability. We’ll also need to further study the impact of the dielectric resonator on other aspects of the quantum processor.

That said, we believe these engineering challenges will ultimately be surmountable — clearing one of the greatest hurdles to realising a large-scale spin-based quantum computer.

About the Author:

Jarryd Pla, Senior Lecturer in Quantum Engineering, UNSW and Andrew Dzurak, Scientia Professor in Quantum Engineering, UNSW

This article is republished from The Conversation under a Creative Commons license. Read the original article.

Stocks: What to Make of Wall Street’s Sky-High Optimism

“I believe that the market moves in whatever direction hurts the most participants”

By Elliott Wave International

The U.S. stock market has been in an uptrend since March 2009 — so, more than 12 years.

To add icing to the cake, there’s this notable factoid (CNBC, August 16):

S&P 500 doubles from its pandemic bottom, marking the fastest bull market rally since WWII

So, after such a historic run, one might think that many Wall Street analysts would say that it’s time to take at least some chips off the table.

Well, not so. Look at this astounding August 14 Bloomberg news item:

Wall Street Is the Most Bullish on Stocks in Almost Two Decades

So, what should one make of this uniformity of thinking and historic bullishness among Wall Street analysts?

Let’s turn to Robert Prechter’s landmark book, The Socionomic Theory of Finance:

Consensus regarding the future course of financial-market prices has an awesome power to become ossified in the wrong direction at markets’ major turning points.

The dictionary defines “ossified” as “having become rigid or fixed in attitude or position.”

That’s the very attitude that prompted Dave Lutz, head of ETFs at JonesTrading Annapolis to say:

“I’m a believer that the market moves in whatever direction hurts the most participants. If all the analysts on the Street are bullish, I’d be very cautious.”

That quote is from the same Bloomberg news item mentioned a moment ago, and Elliott Wave International agrees with that view.

After all, history shows that most investors, including professionals, are “surprised” at major turning points in the stock market.

The same patterns of investor psychology have played out time and again. Elliott waves are a direct reflection of these patterns.

Here’s what’s important to know:

The Wave Principle is governed by man’s social nature, and since he has such a nature, its expression generates forms. As the forms are repetitive, they have predictive value.

That’s a quote from Frost & Prechter’s Wall Street classic, Elliott Wave Principle: Key to Market Behavior.

You can get the details of how the Wave Principle helps investors to forecast the price paths of financial markets by reading the online version of the book — 100% free!

All that’s required for free access is a Club EWI membership, which is also free.

In case you’re unfamiliar with Club EWI, it’s the world largest Elliott wave educational community. Members enjoy complimentary access to a wealth of Elliott wave resources on financial markets, investing and trading.

You can have the book on your computer screen in just a few minutes by following this link: Elliott Wave Principle: Key to Market Behavior — free and unlimited access.

This article was syndicated by Elliott Wave International and was originally published under the headline Stocks: What to Make of Wall Street’s Sky-High Optimism. EWI is the world’s largest market forecasting firm. Its staff of full-time analysts led by Chartered Market Technician Robert Prechter provides 24-hour-a-day market analysis to institutional and private investors around the world.

Machine learning plus insights from genetic research shows the workings of cells – and may help develop new drugs for COVID-19 and other diseases

By Shang Gao, University of Illinois at Chicago and Jalees Rehman, University of Illinois at Chicago 

The Research Brief is a short take about interesting academic work.

The big idea

We combined a machine learning algorithm with knowledge gleaned from hundreds of biological experiments to develop a technique that allows biomedical researchers to figure out the functions of the proteins that turn genes on and off in cells, called transcription factors. This knowledge could make it easier to develop drugs for a wide range of diseases.

Early on during the COVID-19 pandemic, scientists who worked out the genetic code of the RNA molecules of cells in the lungs and intestines found that only a small group of cells in these organs were most vulnerable to being infected by the SARS-CoV-2 virus. That allowed researchers to focus on blocking the virus’s ability to enter these cells. Our technique could make it easier for researchers to find this kind of information.

The biological knowledge we work with comes from this kind of RNA sequencing, which gives researchers a snapshot of the hundreds of thousands of RNA molecules in a cell as they are being translated into proteins. A widely praised machine learning tool, the Seurat analysis platform, has helped researchers all across the world discover new cell populations in healthy and diseased organs. This machine learning tool processes data from single-cell RNA sequencing without any information ahead of time about how these genes function and relate to each other.

Our technique takes a different approach by adding knowledge about certain genes and cell types to find clues about the distinct roles of cells. There has been more than a decade of research identifying all the potential targets of transcription factors.

Armed with this knowledge, we used a mathematical approach called Bayesian inference. In this technique, prior knowledge is converted into probabilities that can be calculated on a computer. In our case it’s the probability of a gene being regulated by a given transcription factor. We then used a machine learning algorithm to figure out the function of the transcription factors in each one of the thousands of cells we analyzed.

We published our technique, called Bayesian Inference Transcription Factor Activity Model, in the journal Genome Research and also made the software freely available so that other researchers can test and use it.

Why it matters

Our approach works across a broad range of cell types and organs and could be used to develop treatments for diseases like COVID-19 or Alzheimer’s. Drugs for these difficult-to-treat diseases work best if they target cells that cause the disease and avoid collateral damage to other cells. Our technique makes it easier for researchers to home in on these targets.

A blob is covered with tiny spheres
A human cell (greenish blob) is heavily infected with SARS-CoV-2 (orange dots), the virus that causes COVID-19, in this colorized microscope image.
National Institute of Allergy and Infectious Diseases

What other research is being done

Single-cell RNA-sequencing has revealed how each organ can have 10, 20 or even more subtypes of specialized cells, each with distinct functions. A very exciting new development is the emergence of spatial transcriptomics, in which RNA sequencing is performed in a spatial grid that allows researchers to study the RNA of cells at specific locations in an organ.

A recent paper used a Bayesian statistics approach similar to ours to figure out distinct roles of cells while taking into account their proximity to one another. Another research group combined spatial data with single-cell RNA-sequencing data and studied the distinct functions of neighboring cells.

What’s next

We plan to work with colleagues to use our new technique to study complex diseases such as Alzheimer’s disease and COVID-19, work that could lead to new drugs for these diseases. We also want to work with colleagues to better understand the complexity of interactions among cells.

About the Author:

Shang Gao, Doctoral student in Bioinformatics, University of Illinois at Chicago and Jalees Rehman, Professor of Medicine, Pharmacology and Biomedical Engineering, University of Illinois at Chicago

This article is republished from The Conversation under a Creative Commons license. Read the original article.