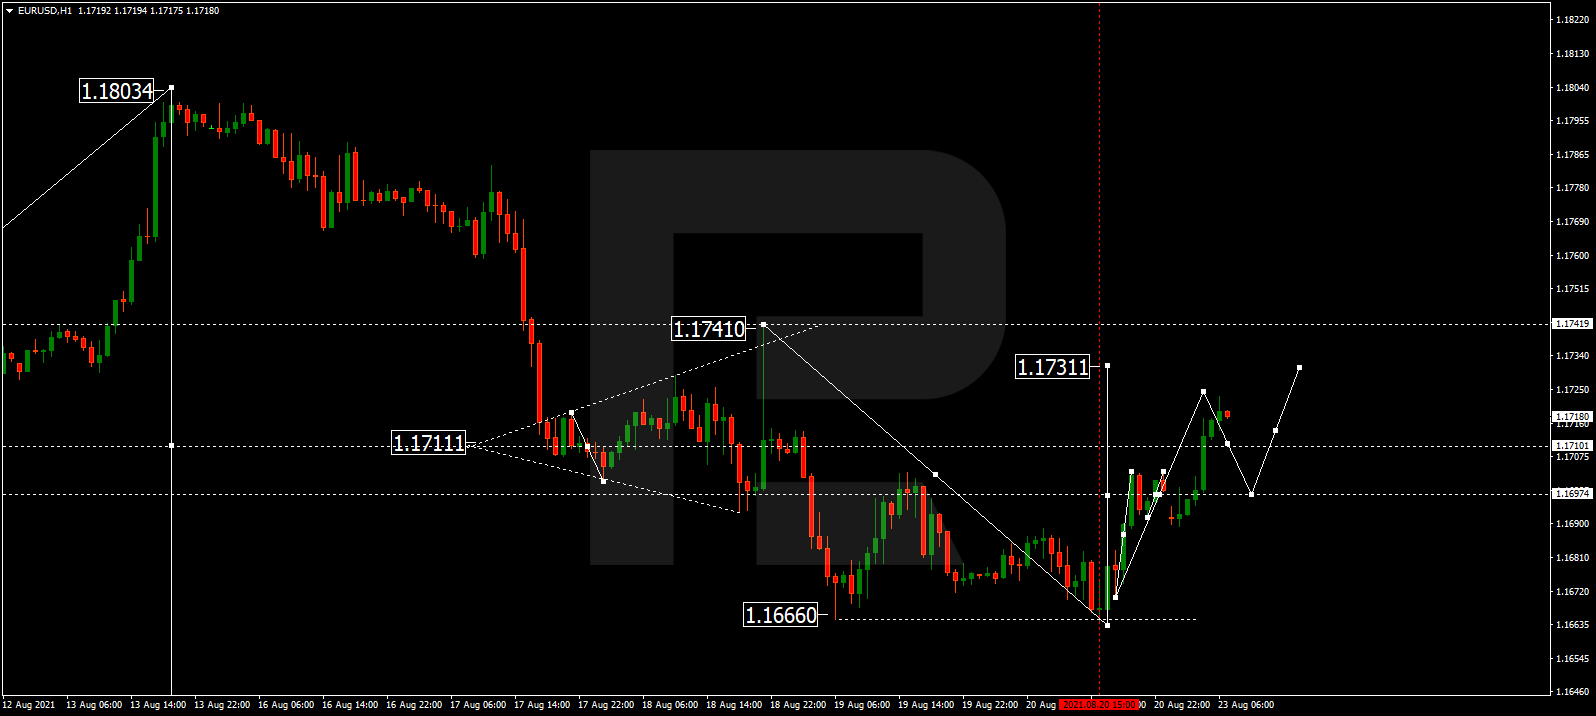
After finishing another descending structure at 1.1633 along with the correction towards 1.1697, EURUSD has formed a new consolidation range around the latter level; right now, it is expected to break it to the upside and continue the correction to reach 1.1731. After that, the instrument may fall to return to 1.1697 and forming another consolidation range there. If later the price breaks this range to the downside, the market may resume falling with the target at 1.1600; if to the upside – continue the correction towards 1.1740.
GBPUSD, “Great Britain Pound vs US Dollar”
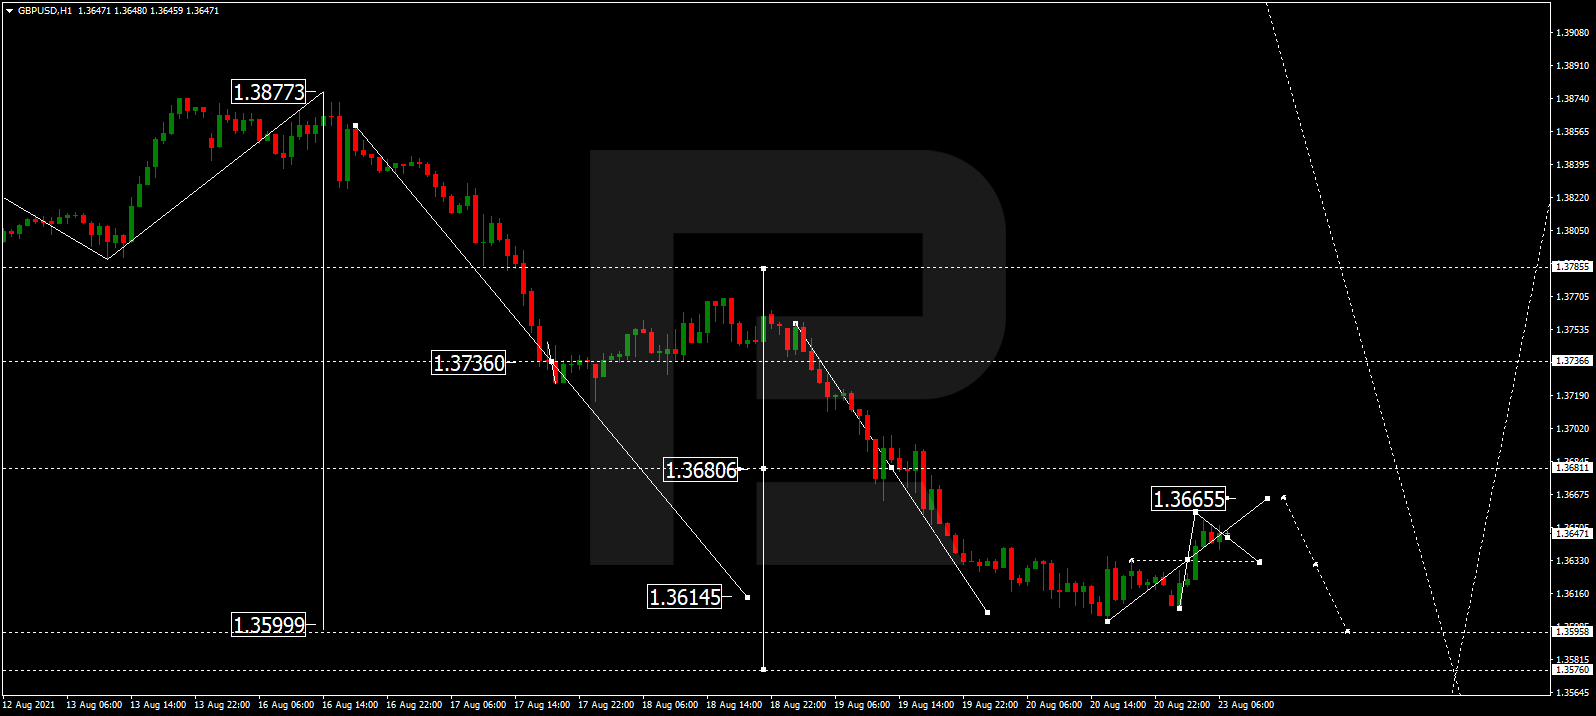
After completing the descending wave and reaching the short-term target at 1.3601, GBPUSD is trading correcting towards 1.3666. downwards. Possibly, the pair may test 1.3680 and then form a new descending wave with the target at 1.3599.
USDRUB, “US Dollar vs Russian Ruble”
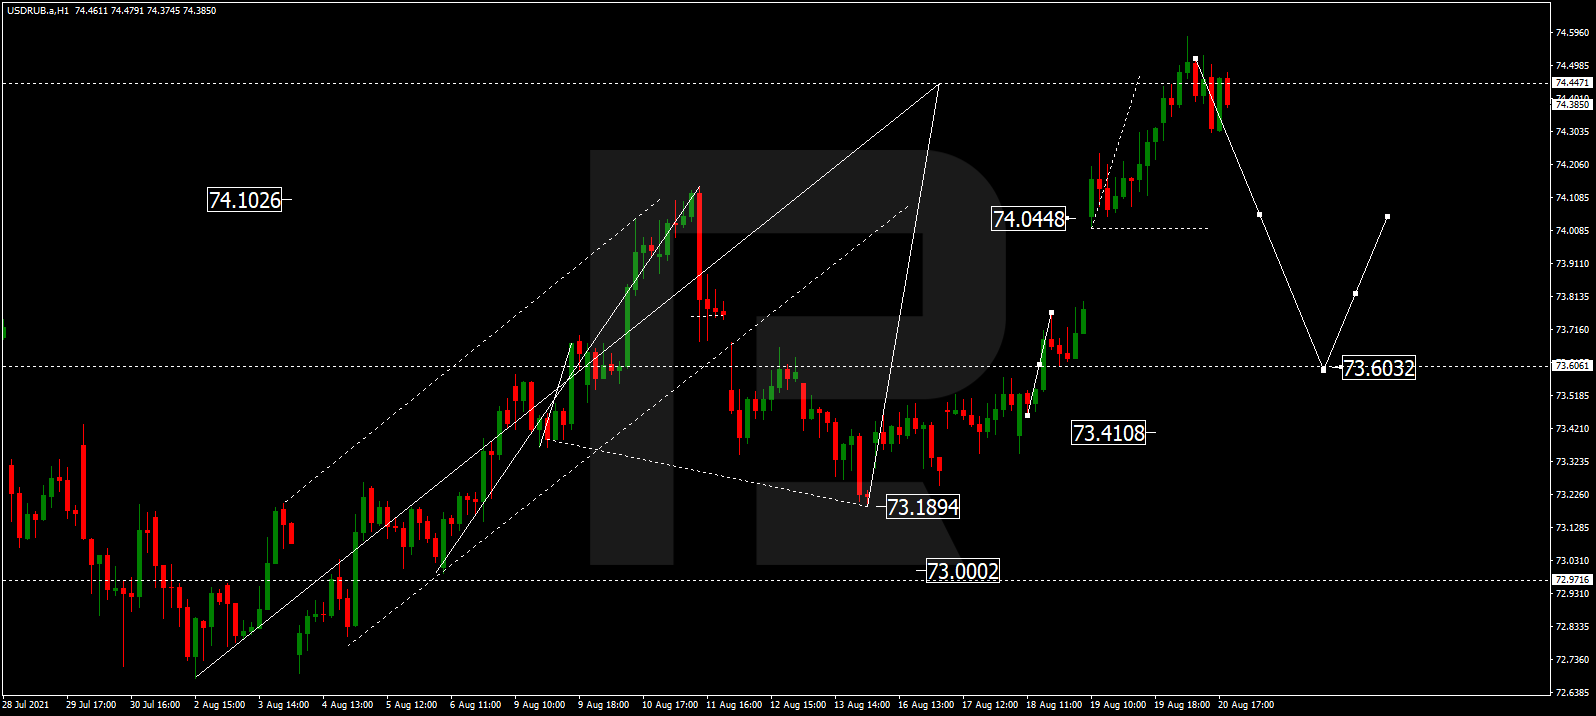
USDRUB is falling towards 73.60 and may later correct to reach 74.04, thus forming a new consolidation range between these two levels. If later the price breaks this range to the downside, the market may resume falling within the downtrend with the target at 72.00; if to the upside – form one more ascending structure towards 75.00.
USDJPY, “US Dollar vs Japanese Yen”
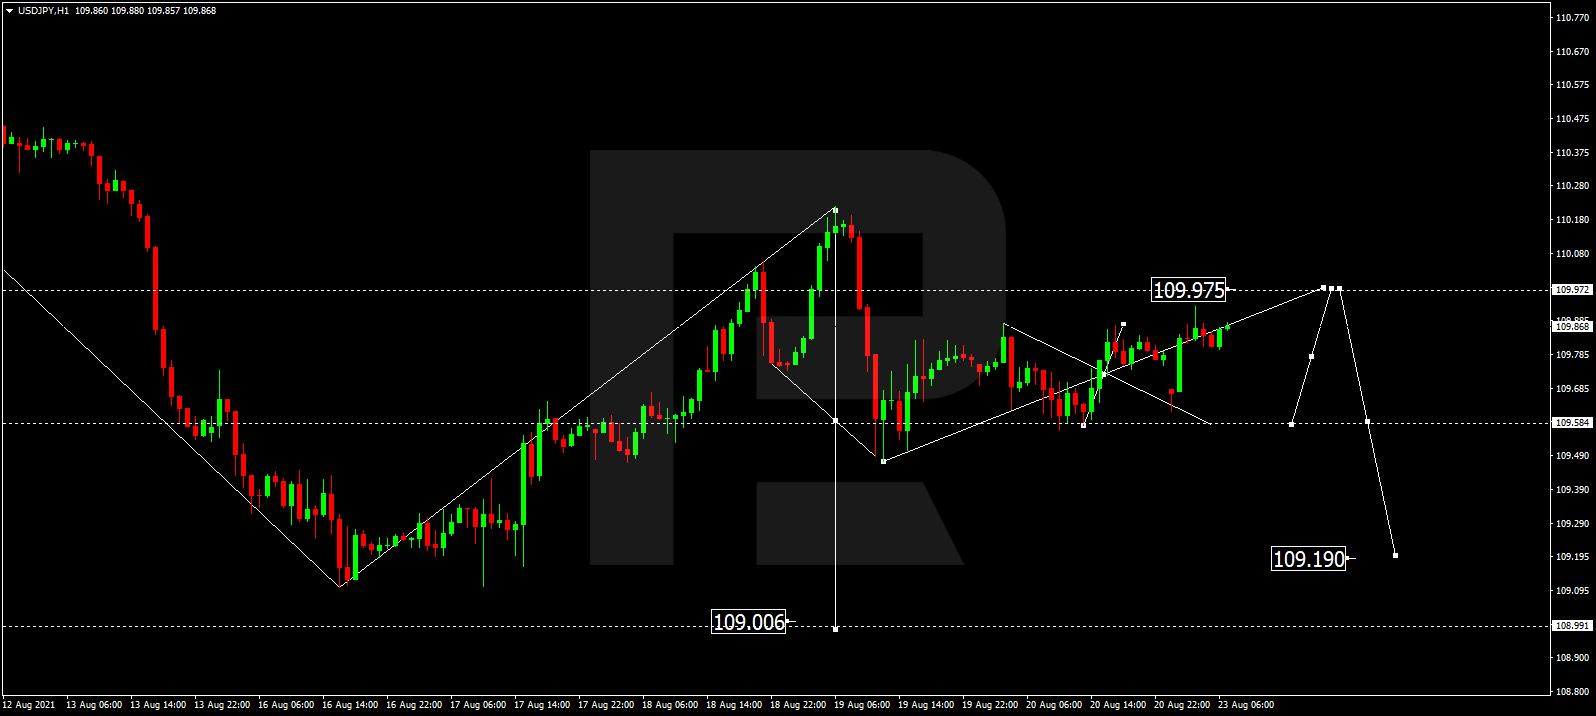
USDJPY is still correcting to the upside; by now, it has formed a new consolidation range around 109.73. Possibly, today the pair may form a new descending structure towards 109.59 and then start another growth to reach 109.97. Later, the market may resume falling with the short-term target at 109.19.
USDCHF, “US Dollar vs Swiss Franc”
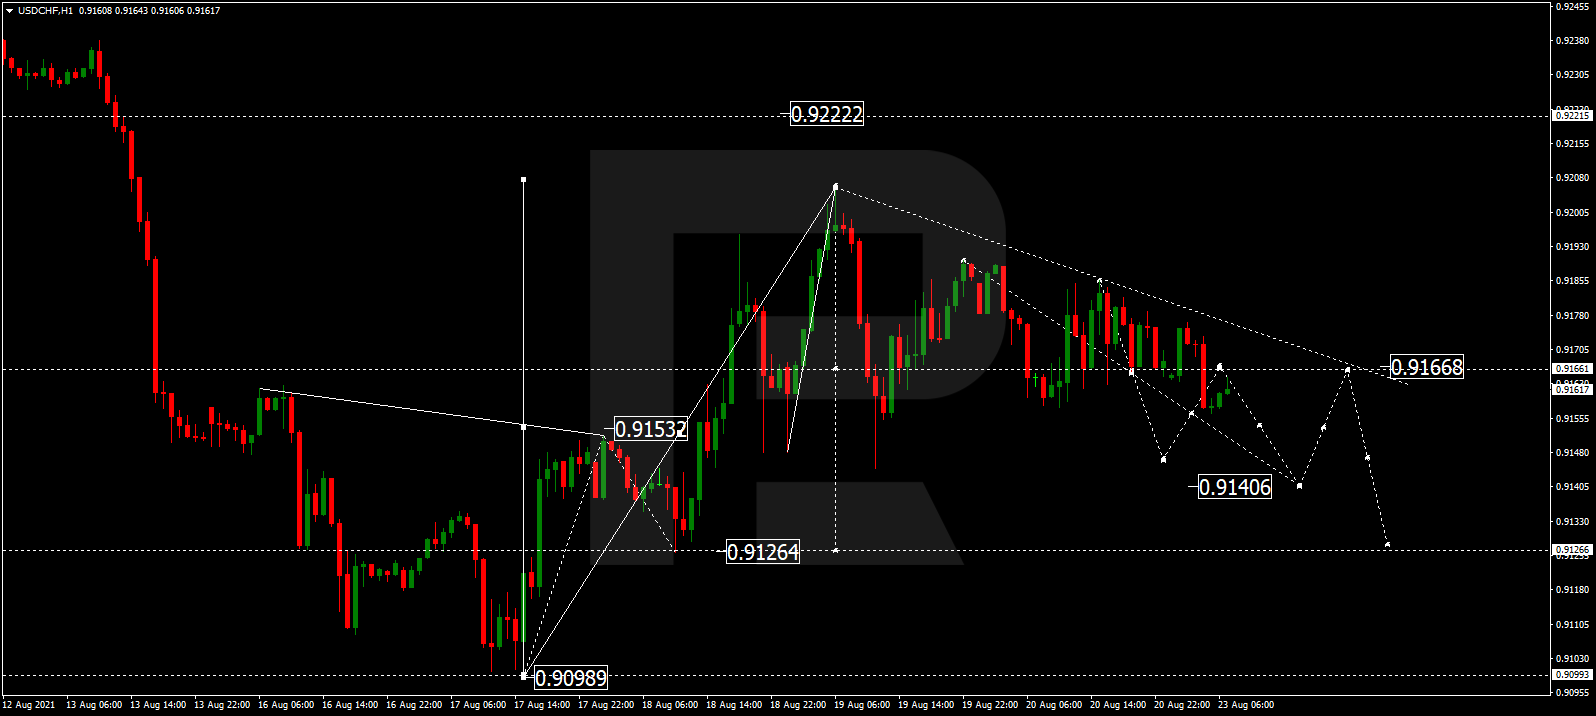
USDCHF is still consolidating above 0.9166. Today, the pair may fall to reach 0.9140 and then start another growth to return to 0.9166. Later, the market may complete the correction by falling towards 0.9126 and then form one more ascending structure with the target at 0.9222.
AUDUSD, “Australian Dollar vs US Dollar”
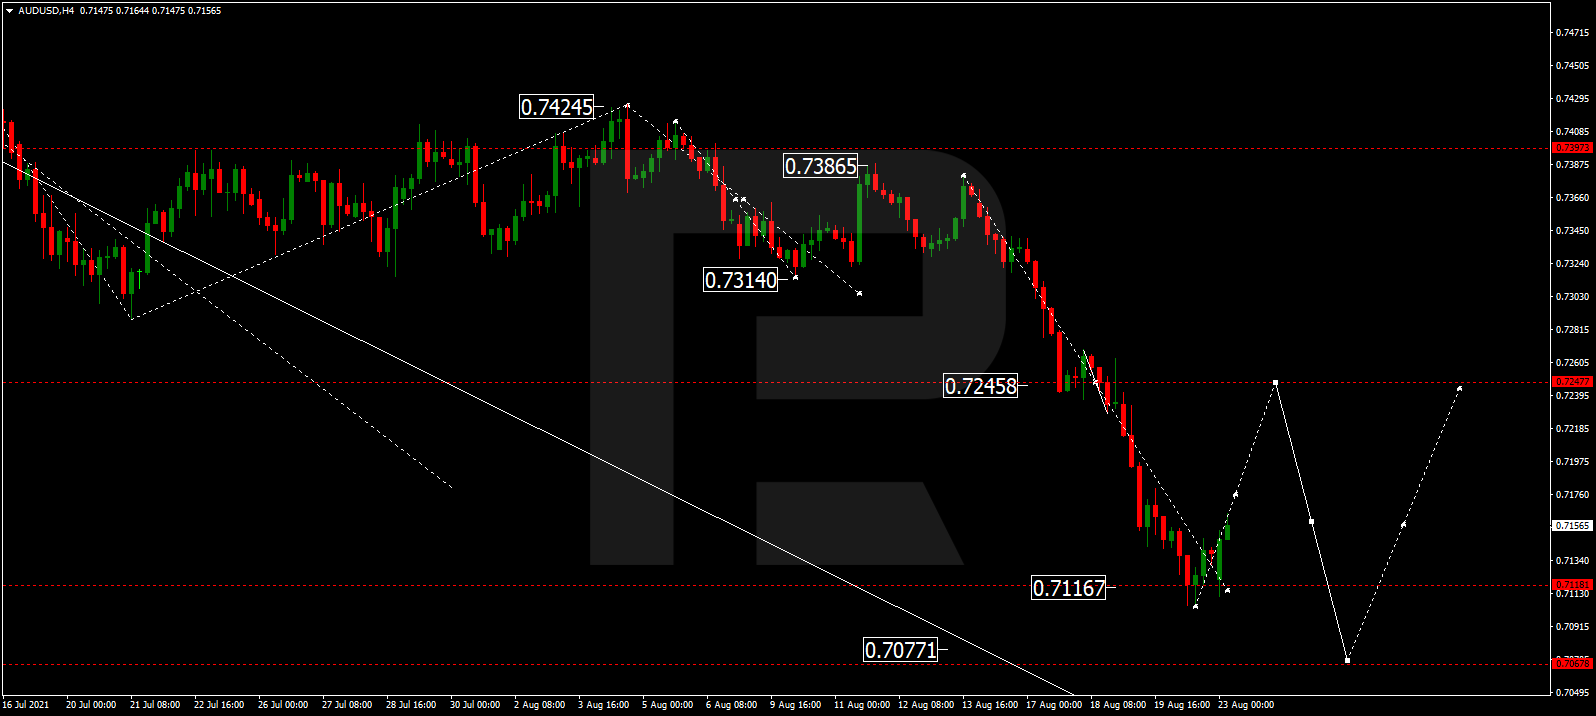
AUDUSD has completed the descending wave at 0.7117. Possibly, today the pair may correct towards 0.7212 and then resume trading within the downtrend with the target at 0.7000.
BRENT
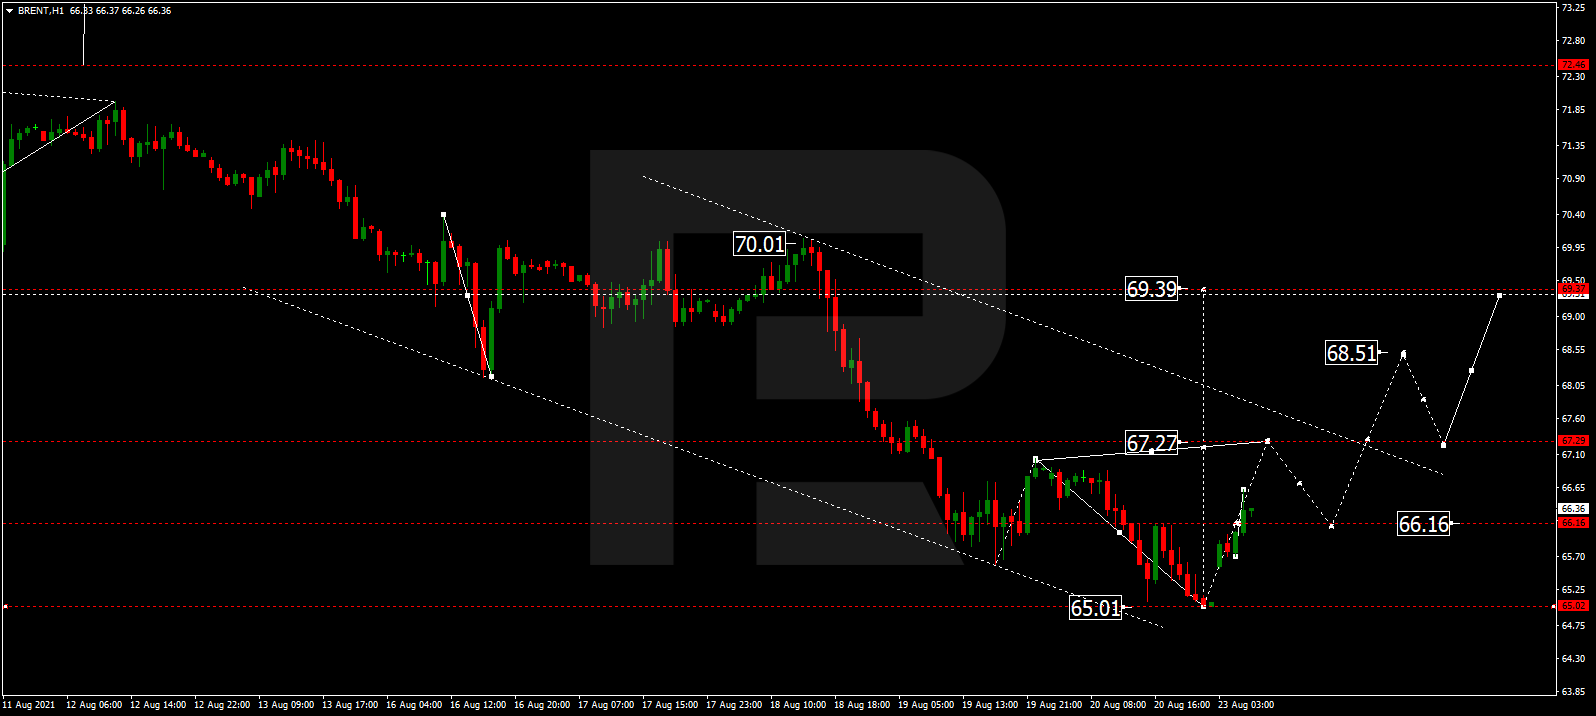
Brent is still consolidating around 66.16 Today, the asset is expected to grow towards 67.27 and then fall to test 66.16 from above. If later the price breaks this range to the upside, the market may resume growing with the target at 69.40; if to the downside – start a new decline towards 64.50.
XAUUSD, “Gold vs US Dollar”
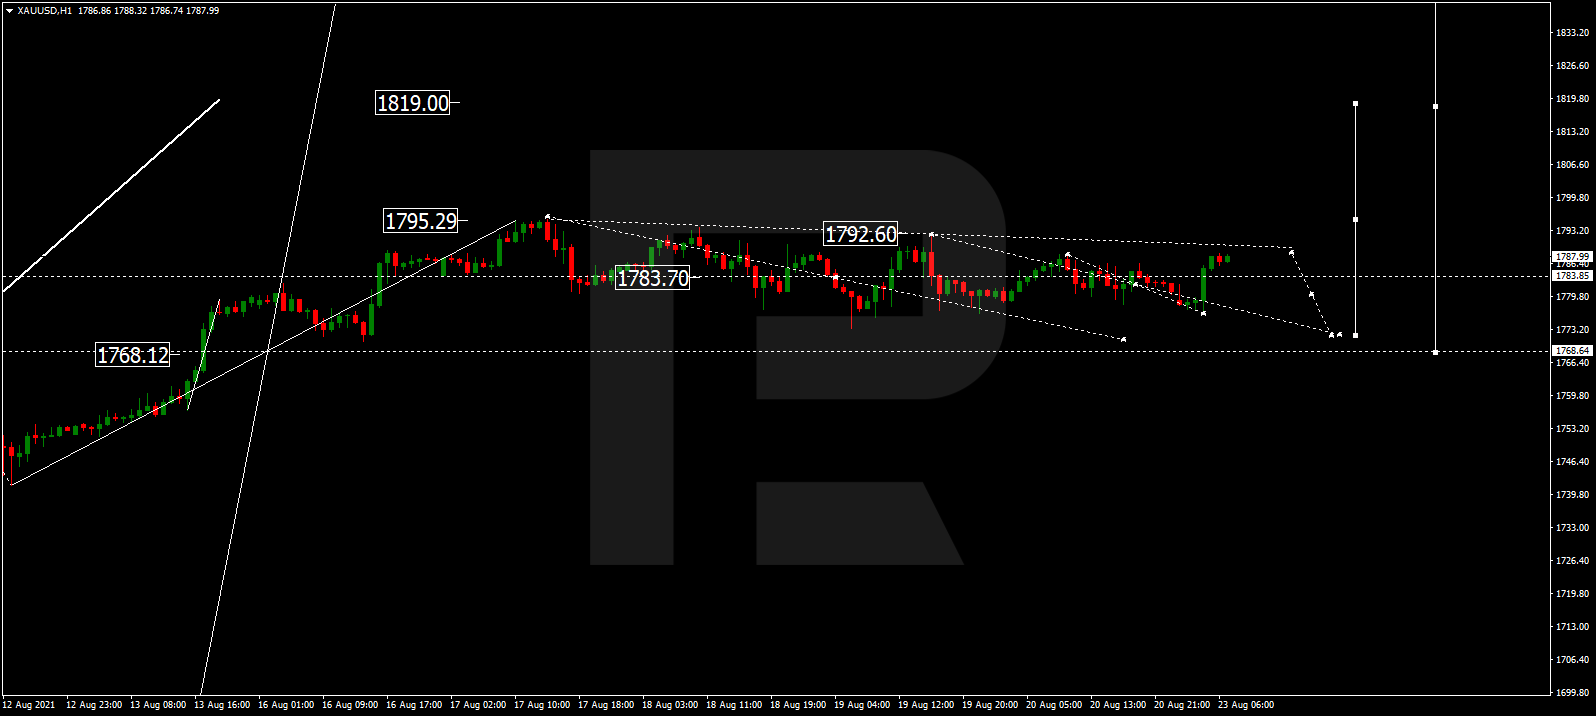
Gold is still consolidating around 1784.00 without any particular direction. Possibly, today the metal may start another decline falling towards 1722.22 and then form one more ascending structure with the target at 1819.00.
S&P 500
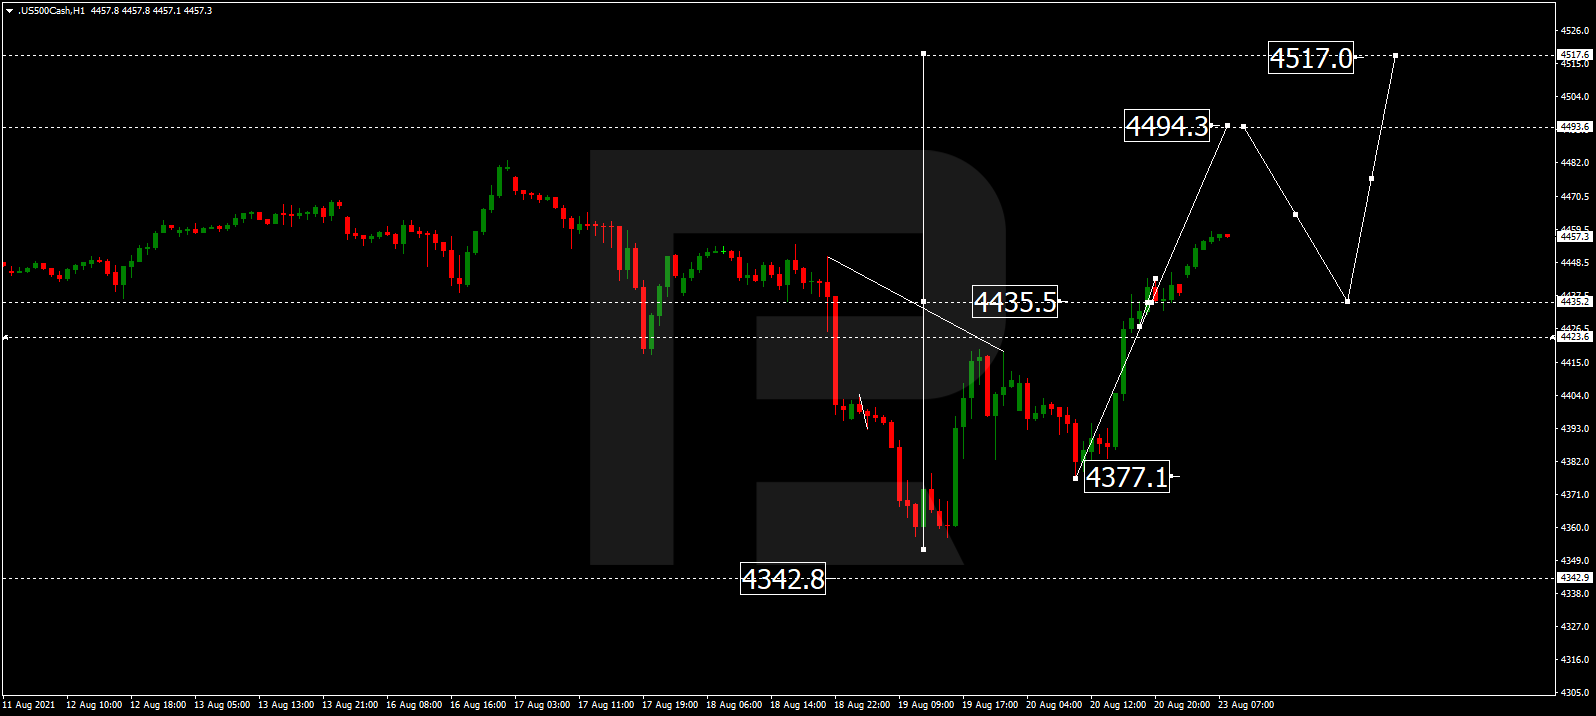
After finishing the ascending structure at 4435.5 and forming a narrow consolidation range around this level, the S&P index has broken it to the upside due to the gap; right now, it is trading according to an alternative scenario towards 4494.3 and extending the ascending structure up to 4517.0. After that, the instrument may form a new descending structure to break 4377.0 and then continue falling with the target at 4300.0
Attention! Forecasts presented in this section only reflect the author’s private opinion and should not be considered as guidance for trading. RoboForex LP bears no responsibility for trading results based on trading recommendations described in these analytical reviews.
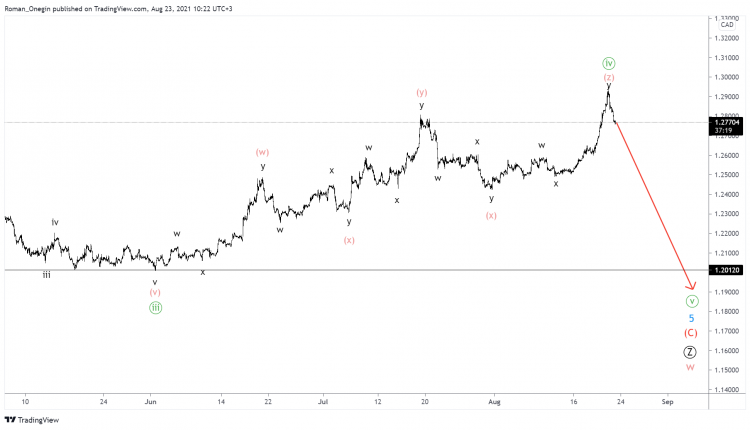
The USDCAD pair shows the initial part of a double zigzag of a cycle degree.
The last section of the chart shows the final part of the first actionary wave w. Most likely, it is a triple zigzag consisting of primary sub-waves Ⓦ-Ⓧ-Ⓨ-Ⓧ-Ⓩ. The final actionary sub-wave Ⓩ of this pattern is under development.
The last intermediate wave (C) in the form of a simple impulse is currently being formed as part of the sub-wave Ⓩ. The minute fourth correction in the form of a minuette double zigzag has come to an end, this is a signal for a decline in the minute fifth wave.
Most likely, the market will update the previous low, and finish the cycle wave w below the level of 1..2012
Let’s consider the second scenario of the USDCAD currency pair. In this view, the market moves in an upward direction, building a cycle intervening wave x.
It is quite likely that the intervening wave x takes the form of a primary simple zigzag Ⓐ-Ⓑ-Ⓒ.
The primary impulse Ⓐ and the zigzag correction Ⓑ have ended.
In the short term, a movement in the primary impulse Ⓒ is likely in the direction of the level of 1.3215, where the primary waves Ⓐ and Ⓒ will be equal.
– This final portion of our research article into the shifting US/global consumer spending/economic activities will help to set up forward expectations related to how assets and the stock market may react over the next 12+ months. In our opinion, the reflation trade/rally is complete, and consumers have already run the course with regards to stimulus spending, hyper-speculation of assets (cryptos, commodities, equities/stocks, and others). What happens next is we shift into the real-world future where post-reflation valuations, consumer activities, and corporate earnings will drive expectations.
There was a time, shortly after the November 2020 elections, that was very opportunistic for traders/speculators. The US Fed was prompting very easy monetary policy while multiple stimulus programs were still taking place. Additionally, the US economy was still early into the post-COVID reflation attempts. This created a real opportunity for traders and speculators to ride a hyper-speculative rally phase in late 2020 and into early 2021 as the Month-over-Month and Year-over-Year economic output data ramped up from the extreme COVID lows.
At this time, commodities, housing, stocks, and various sectors all seemed to rally 20~30% or more over a very short 5 to a 6-month span of time. Most of these peaked out in February through April 2021. Now, nearly 5+ months after these peaks, we are starting to see very clear downward trends in China, Asia, Europe, and other commodities, equity sectors that suggest we are shifting away from the rally phase. What happens now that price levels, valuations, and expectations have been pushed toward extreme levels?
August 2021 Case/Shiller House Price Index May Break 2004 Highs – Setting New Record High
One simple measure of extreme consumer and pricing is the Case-Shiller House Price Index. Even though we’ve seen multiple waves of recovery over the past 10+ years regarding home prices, the extended and very aggressive rally in home prices over the past 12+ months is staggering. The CS HPI prior to COVID was averaging near 3% – suggesting moderate price appreciation in home values. Currently, July 27, 2021, CS HPI value came in at 17% – suggesting home prices across 20 major US cities have risen 17% on a Year-over-Year basis.
The next Case-Shiller update should happen near August 27, 2021. If this data pushes above 17.10%, that would represent the highest CS HPI rate since September 2004 – breaking to a new high and also representing a potential extreme speculative peak in home prices.
Consumers are keenly aware of these pricing dynamics – even with extremely low-interest rates. And with the US Fed talking about tightening monetary policy possibly earlier than expected, many consumers are starting to pull away from making big purchases while expecting continued price appreciation. Consumers know that rising interest rates may prompt a 15% to 25% decrease in house price values from these extreme highs. Even if the US Federal Reserve moves the FFR to 1% or 1.25%, the likelihood that mortgage rates will climb to levels near 4.50% or higher is very reasonable.
Home price values are a reflection of consumer confidence, consumer earning capabilities, and ease of purchase (entry) related to interest rates. When consumers feel the opportunity is right and interest rates are low, while they have strong earning capabilities, consumers will spend more for homes. But when any of these factors diminish substantially, particularly rising interest rates and/or lack of consumer confidence in the economy, consumers tend to pull away from making big purchases on homes.
Core Consumer Costs Are Still More Than Double Average Historical Rates
Another factor in our belief that Consumers have already started to pull away from this rally peak in the stock market and economy is that Core Consumer CPI levels have skyrocketed over the past 4+ months – which suggests consumers are straining to deal with rising inflation costs at all levels.
Consumer CPI is a measure of pricing for goods and services (excluding food and energy). If you understand the rally in Core Consumer CPI does not include rising food and energy costs, yet still rallied to more than 200% average levels over the past 4+ months, then sit back and let me try to explain.
Energy prices are more than 200% higher than they were 14+ months ago. Crude Oil was trading below $30 ppb in April 2020 and recently reached a high price level above $76 ppb. For the average consumer, energy costs have more than doubled over the past 10+ months and that will present a real problem as the economy starts to open back up.
Additionally, the cost of food items has risen over the past 14+ months to near the highest levels on record going back to 2011 or 2007-08. The interesting facet about this bit of information is that rising food costs in 2007-08 also coincided with a massive housing price bubble that imploded in early 2009 (Source: https://www.usinflationcalculator.com/inflation/food-inflation-in-the-united-states/)
In an eerily similar setup to 2007, food prices started to rally higher in the first quarter of 2007 by about 30%, then peaked out at +6.1% in October 2008 – just a few months before the housing market collapse really destroyed the global markets. Currently, food prices have already gone through a similar type rally phase, starting in April 2020 with a big 40% price increase. Food price inflation peaked near the middle of 2020 near 4% to 4.5% and has continued to moderately weaken in early 2021. This same type of moderate food price inflation happened in Q2 and Q3 of 2009 – during the height of the housing/credit market collapse.
US Consumers Will Continue To Drive Future Market/Economic Trends in 2021 & Beyond
The one thing we are trying to impart to you with this research article is that the US consumer is the main driving force behind the market price and activity trends. If the consumer stays actively engaged in the economy throughout the end of 2021 (through the Christmas season and beyond), we may see a more moderate recovery in the stock market and asset value price levels over time. But if the consumers pull away from engaging in the economy because of this recent extremely high CPI and other asset/inflation data, we may see some type of price reversion event take place which many people may be unprepared for.
The US consumer & consumer services make up more than 70% of total US GDP. Government policy, US Federal Reserve actions, and Business spending/engagement are all components of how well the US economy operates going forward. Like a high-performance engine, everything has to work, everything needs proper lubrication, and there is a very small tolerance for error.
Consumer Sentiment Falls To The Lowest Levels Since December 2011
After this extremely high CPI, asset value, and other reflationary economic levels, while we are seeing Consumer Sentiment declined dramatically (from 81.2 to 70.2: falling -14.5% to the lowest levels since December 2011), it appears consumers have already started to head for the exits.
We need to stay cautious of what may happen over the next few months and be headed into the end of 2021 in terms of valuation levels and volatility. If the consumer side of the economy suddenly vanishes, because of inflationary, economic, or other concerns, we may see a very sudden collapse in home prices, economic activity, GDP, and other asset values. If consumers re-engage in the economy after these massive inflationary and economic rallies, then we may see continued support for stock market valuation levels near current values.
Again, consumers drive economic activity and without consumer engagement, the US and global economy may slip into a Recession. The post-COVID world has experienced a very strange and explosive economic explosion in terms of price appreciation, economic data output, inflation, and other factors. History has shown that once we reach these extreme levels, consumers typically react by pulling away from speculation and waiting for new opportunities in the markets.
The current Consumer Sentiment levels are already suggesting that consumers have started to pull away from economic optimism. We need to stay very cautious of what happens over the next few months as we see how the end of 2021 and early 2022 play out.
More than ever, right now, traders need to move away from risk functions and start using common sense. There will still be endless opportunities for profits from these extended price rotations, but the volatility and leverage factors will increase risk levels for traders that are not prepared or don’t have solid strategies. Don’t let yourself get caught in these next cycle phases unprepared.
Please take a minute to learn about my BAN Trader Pro newsletter service and how it can help you identify and trade better sector setups. My team and I have built this strategy to help us identify the strongest and best trade setups in any market sector. Every day, we deliver these setups to our subscribers along with the BAN Trader Pro system trades. You owe it to yourself to see how simple it is to trade 30% to 40% of the time to generate incredible results.
For those of you who are interested in Options Trading, our resident specialist Neil Szczepanski will be hosting a LIVE two-part Intermediate Course beginning on Wednesday, August 25, 2021. Neil will dive deep into the different strategies and outline what are the best trade setups and what to avoid – helping you to become a more knowledgable, confident, and advanced options trader. To learn more, or to register for the course, kindly click on the following link: INTERMEDIATE OPTIONS MENTORING COURSE.
As something entirely new, check out my initiative URLYstart to learn more about the youth entrepreneurship program I am developing. This is an online program of gamified entrepreneurship designed to introduce and inspire youth to start their own businesses. Click-by-click, each student will be guided from their initial idea, through the startup process all the way to their first sale and beyond. Along the way, our students will learn life lessons such as communication, perseverance, goal setting, teamwork, and more. My team and I are passionate about this project and want to reach as many people as possible!
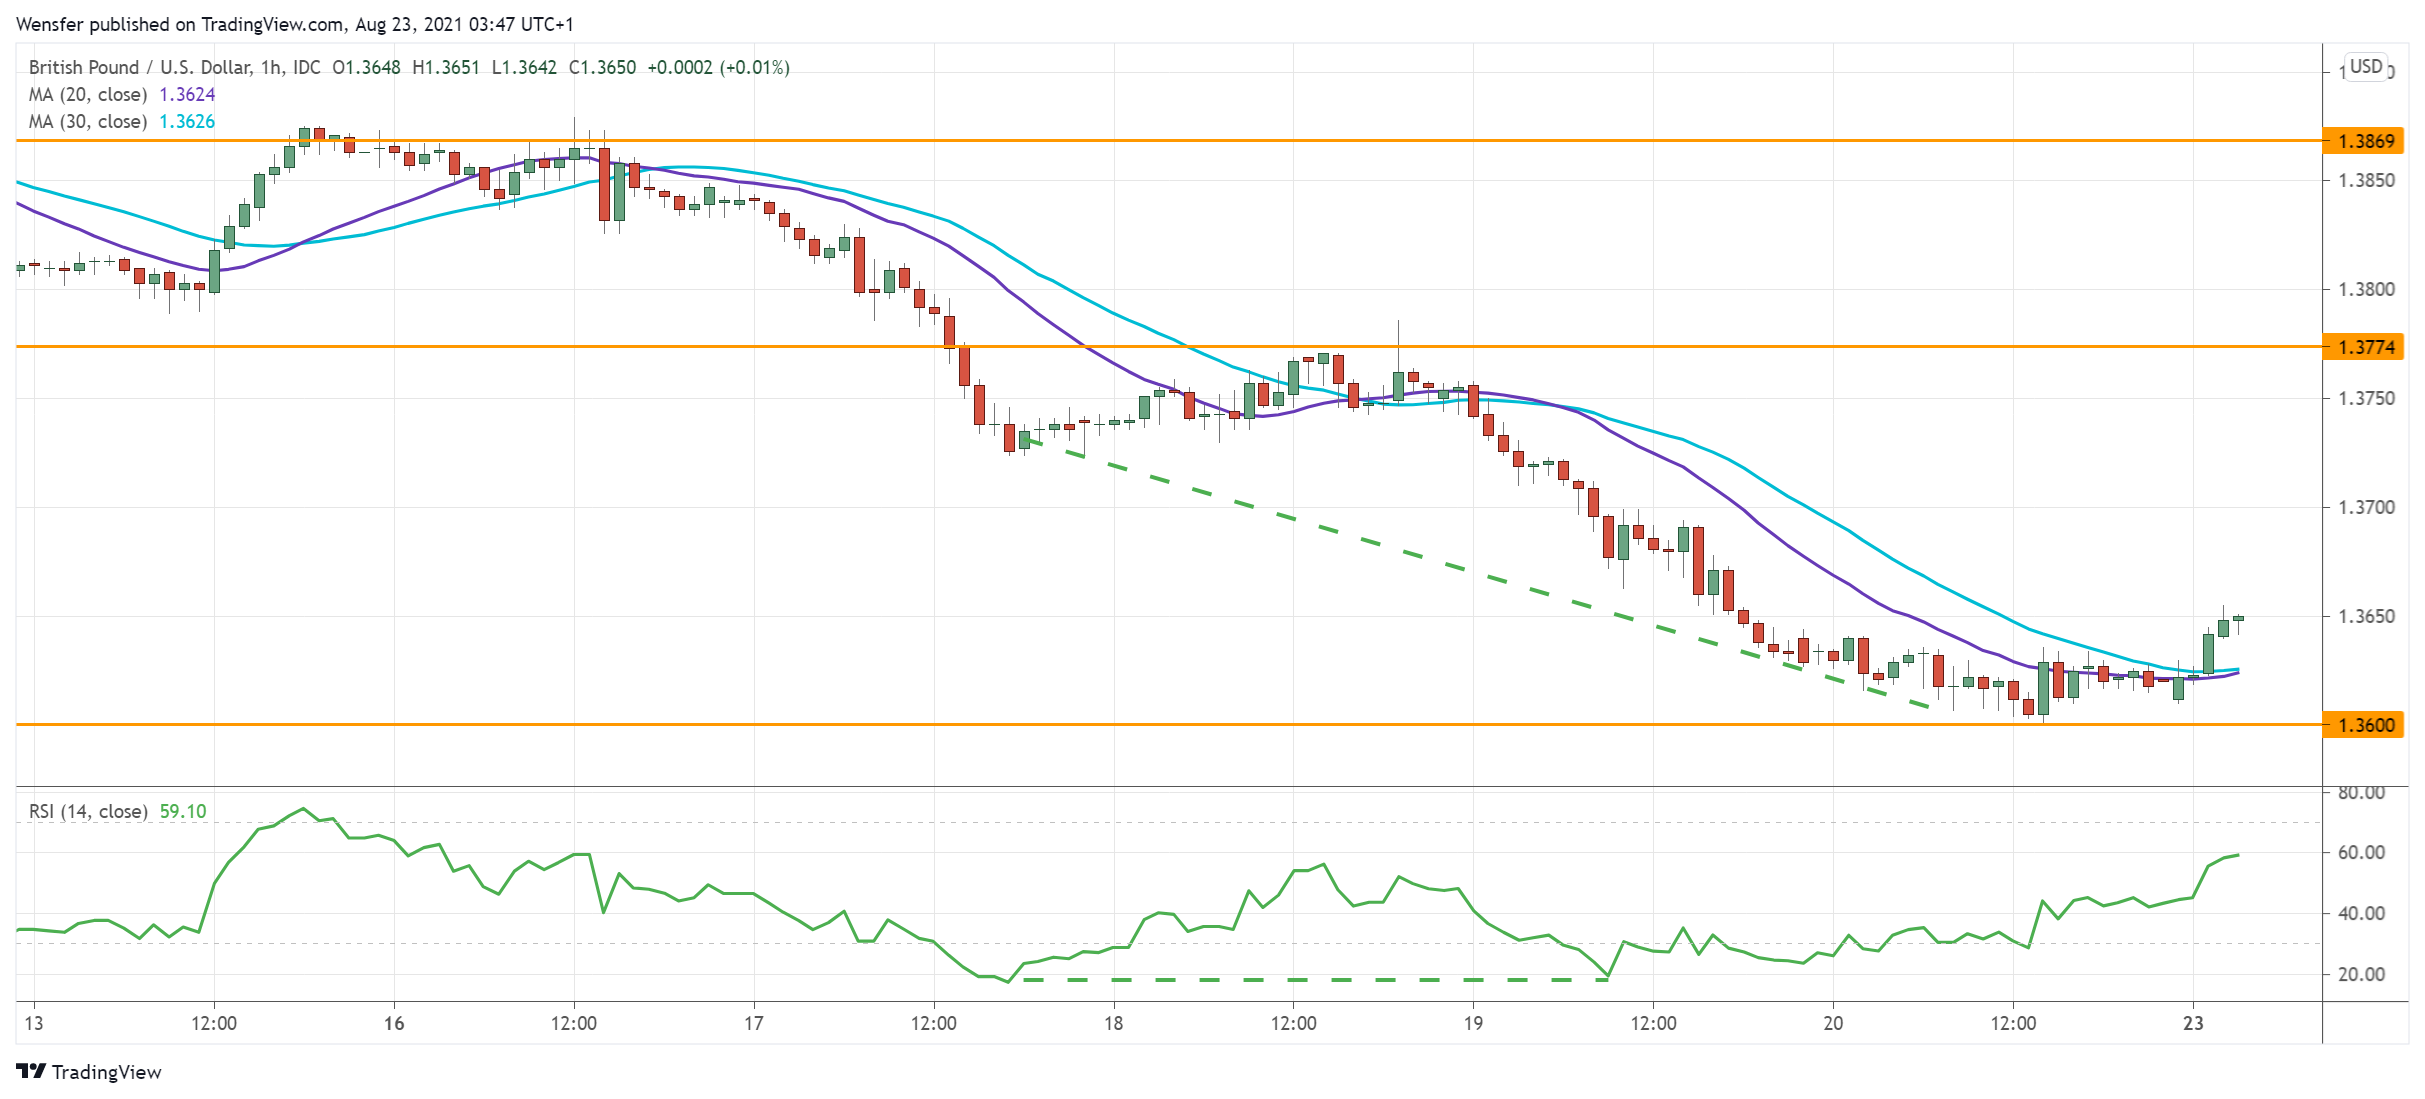
The pound drifted lower after Britain’s retail sales figures fell in July. The pair has given up all its gains from late July and is testing the critical support at 1.3600 from the daily chart.
A diverging RSI suggests a slowdown in the downward impetus. Its oversold situation may have attracted buying interest in the demand zone. 1.3770 would be the first target in case of a rebound.
Otherwise, a bearish breakout would trigger a new round of sell-off towards 1.3460 as those who bought the dip reverse gears.
USDCAD clears previous peak
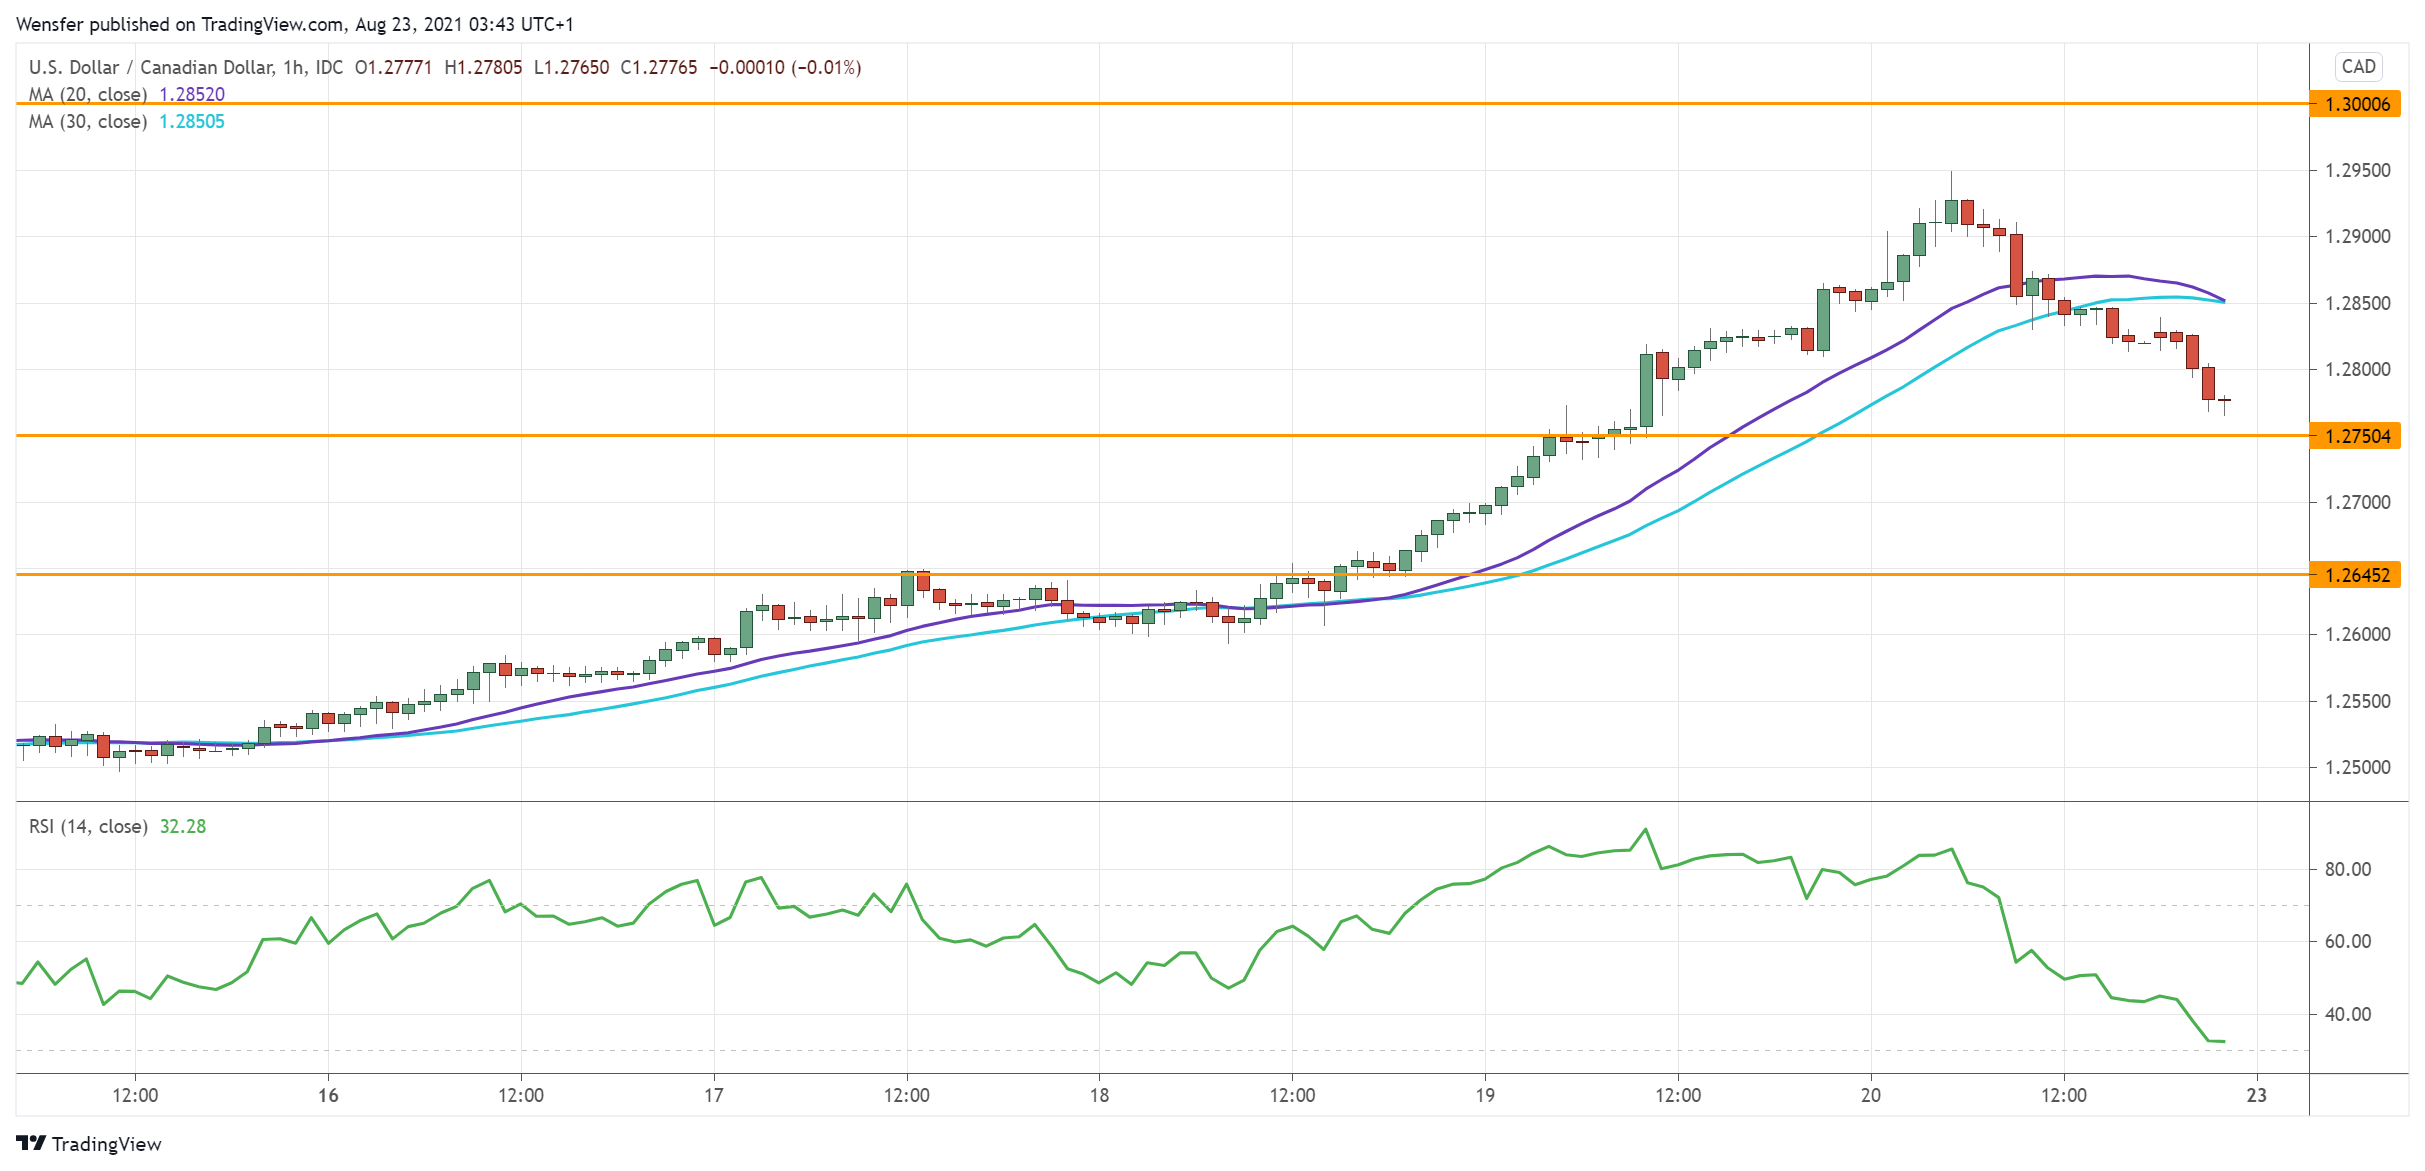
The Canadian dollar tanked after last month’s retail sales failed to impress. The greenback saw increased momentum after it rallied above July’s peak at 1.2800.
The breakout can be a confirmation of a bullish reversal for the weeks to come. A pullback is necessary to let the bulls catch their breath.
An overbought RSI has swung towards the oversold territory. 1.2750 near the previous high is now the immediate support. A rebound would challenge the psychological level of 1.3000.
GER 30 breaks bullish trendline
The Dax 30 retreats as investors grow wary of the recovery’s momentum.
The index had only briefly held onto the 16000 milestone. The break below the rising trendline has put a halt to a month-long rally.
The current consolidation is a sign of indecision after a round of liquidation. An oversold RSI has prompted traders to buy the dip near 15600.
The rally may only resume if the bulls succeed in lifting offers around 15970. Failing that, price action could be vulnerable below 15600.
After much hype, we are now just days away from the Federal Reserve’s flagship event, the Jackson Hole Economic Symposium. This keenly-awaited event however will be held virtually for a second consecutive year, this time due to concerns over the resurgence of Covid-19.
Besides the comments by Fed officials at the symposium, here’s a list of notable market-related events for the week:
Monday, August 23
EUR: Eurozone August manufacturing, services and composite PMIs
GBP: UK August manufacturing, services and composite PMIs
USD: US August manufacturing, services and composite PMIs
USD: Fed Chair Jerome Powell delivers speech virtually at Jackson Hole Symposium
Market participants will be clinging on to every word uttered by Fed Chair Jerome Powell, and those of the other Fed officials who might be commenting as part of the yet-to-be-unveiled full agenda (to be released on 26 August).
US policymakers are seemingly on the cusp of easing up on their asset purchases that have shored up global financial markets since the pandemic. The FOMC July meeting minutes that was just released last week suggested that the tapering could even begin before 2021 is over.
Experienced market observers know that the symposium, where policymakers traditionally engage in open discussion, could produce the slightest hint about the Fed’s next policy move and such hints, if they happen, could jolt multiple asset classes.
Dollar poised to climb another leg up on more tapering talk
Some market participants think this will be a non-event, given how much various Fed officials have already telegraphed their tapering intentions over recent months. Others however are bracing for heightened volatility on potential cues out of Fed officials, judging by positioning in the options markets for various asset classes.
Should Fed officials on Friday point to an even more bullish case for tapering, that might push the US dollar even higher while prompting the likes of gold and US stocks to unwind more of their recent gains.
However, should Fed Chair Jerome Powell, in his virtual speech on Friday, pour cold water on the thought of announcing the Fed’s tapering plans anytime soon, that could prompt the greenback to unwind recent gains while potentially evoking a cheer out of gold and stock market bulls.
Friday data could overshadow Powell’s speech
Investors and traders worldwide will also be assessing whether the views espoused by Powell, a notable dove, would be in line with the latest US economic data. Before the Fed chair even utters a single word on Friday, investors will be poring over the trove of figures on US personal income and spending, as well as the Fed’s preferred inflation gauge, the PCE price index.
If the data suggests that the US economic recovery is roaring ahead and that the Fed has to taper sooner rather than later, market participants might pay less heed to Powell’s potentially dovish coos and instead race ahead of the world’s most influential central bank that markets think might be at risk of falling behind the inflation curve.
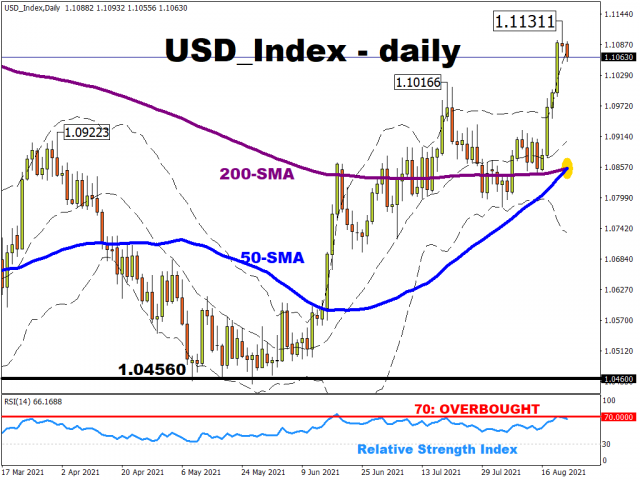
USD Index forms golden cross
Note that the equally-weighted US dollar index is now pulling away from technically overbought territory, as it moderates back to within its Bollinger band and its 14-day relative strength index returns below the 70 line which typically denotes overbought conditions. Yet, it has the potential to set a new 9-month high if dollar bulls are emboldened by heightened prospects of a Fed’s tapering announcement that’s looming closer.
And having formed a golden cross (where its 50-day simple moving average crosses above its 200-day counterpart), such a technical event also typically paves the way for more upside.
Disclaimer: The content in this article comprises personal opinions and should not be construed as containing personal and/or other investment advice and/or an offer of and/or solicitation for any transactions in financial instruments and/or a guarantee and/or prediction of future performance. ForexTime (FXTM), its affiliates, agents, directors, officers or employees do not guarantee the accuracy, validity, timeliness or completeness, of any information or data made available and assume no liability as to any loss arising from any investment based on the same.
The decrease in the dollar index has led to a slight increase in the quotes of the EUR/USD currency pair. A lot will now depend on the performance of the dollar index and the decisions of the Federal Reserve. If the soft monetary policy remains unchanged until the end of the year, the Euro might get much stronger in the near future. A lot of macroeconomic statistics on European countries will be published today.
From a technical point of view, the general trend in the EUR/USD currency pair is bearish. The price has consolidated above the support level and formed a false breakdown zone below. Taking into account the divergence on the MACD indicator on the higher timeframes, the buyers’ pressure is higher now. Under such market conditions, it is best to look for sell trades from the resistance levels, where sellers showed the initiative. Buy trades can only be considered intraday from the support levels where the buyers have shown the initiative.
Alternative scenario: if the price breaks through the 1.1817 resistance level and fixes above, the mid-term uptrend will likely resume.
News feed for 2021.08.23:
– France Manufacturing PMI (m/m) at 10:15 (GMT+3);
– Germany Manufacturing PMI (m/m) at 10:30 (GMT+3);
– Eurozone Manufacturing PMI (m/m) at 11:00 (GMT+3);
– Eurozone Services PMI (m/m) at 11:00 (GMT+3);
– US Manufacturing PMI (m/m) at 16:45 (GMT+3);
– US Services PMI (m/m) at 16:45 (GMT+3);
– US Existing Home Sales (m/m) at 17:00 (GMT+3).
The GBP/USD currency pair
Technical indicators of the currency pair:
Prev Open: 1.3636
Prev Close: 1.3617
% chg. over the last day: -0.14%
UK retail sales fell by 2.5% in July compared to the previous month, which caused short-term sales in the GBP/USD currency pair. On the other hand, the UK government borrowing almost halved to 10.4 billion pounds in July compared to the same month a year ago. Given a temporary increase in oil prices and a decline in the dollar index, it boosted the British currency at the opening of trading on Monday.
On the hourly time frame, the GBP/USD trend is bearish. The price has consolidated above the support level and formed a false breakdown zone below. The MACD indicator shows a divergence. Under such market conditions, it is better to look for sell trades from the resistance levels. But the price is now strongly deviated from the moving average, and given the presence of support and the divergence, there is a high probability of a bounce upward.
Alternative scenario: if the price breaks out through the 1.3885 resistance level and consolidates above, the bullish scenario will likely resume.
News feed for 2021.08.23:
– UK Manufacturing PMI (m/m) at 11:30 (GMT+3);
– UK Services PMI (m/m) at 11:30 (GMT+3).
The USD/JPY currency pair
Technical indicators of the currency pair:
Prev Open: 109.68
Prev Close: 109.77
% chg. over the last day: +0.08%
Growth in manufacturing activity in Japan has slowed, while the services sector has seen its fastest contraction since last May. Such negative statistics are related to the consequences of introducing a state of emergency in the country’s prefectures to suppress the Delta strain. Japan’s economic indicators for the third quarter will be weak.
The main trend on the USD/JPY currency pair is bullish. The fall of the dollar index compensated for the negative impact of the news on the Japanese Yen. As a result, the USD/JPY currency pair is trading flat. The MACD indicator has become inactive. Under such market conditions, it is best for traders to look for buy trades from the support level, where the buyers have shown initiative. Sell positions should be considered only on lower timeframes from the resistance levels and only with short targets.
Alternative scenario: if the price falls below 109.18, the uptrend is likely to be broken.
News feed for 2021.08.23:
– Japan Manufacturing PMI (m/m) at 03:30 (GMT+3).
The USD/CAD currency pair
Technical indicators of the currency pair:
Prev Open: 1.2823
Prev Close: 1.2820
% chg. over the last day: -0.02%
The USD/CAD currency pair is highly dependent on the dynamics of the dollar index and oil prices. The dollar index started to correct while the oil prices slightly increased, which caused the strengthening of the Canadian dollar and a decrease in the USD/CAD quotes.
Trading recommendations
Support levels: 1.2767, 1.2698, 1.2656
Resistance levels: 1.2885, 1.2951
In terms of technical analysis, the USD/CAD trend is bullish. But now, the price has started a corrective movement. Buy positions should be considered from the support levels after the buyers’ initiative. Sell positions should be considered only from the resistance levels and only with short targets, as it will be trading against the main trend.
Alternative scenario: if the price breaks through down the 1.2602 support level and fixes below, the uptrend is likely to be broken.
This article reflects a personal opinion and should not be interpreted as an investment advice, and/or offer, and/or a persistent request for carrying out financial transactions, and/or a guarantee, and/or a forecast of future events.
Major US stock indices closed Friday in green territory. The S&P 500 index increased by 0.8%, the Dow Jones index increased by 0.65%, and the Nasdaq added 1.2%. NVIDIA, MSFT, and CSCO stock prices made new all-time highs. But that did little to make up for the week’s losses. By the end of the week, the Dow and S&P 500 decreased by 1.1% and 0.6%, respectively, and the Nasdaq technology index fell by 0.7%. The main event of the coming week will be the annual symposium of the world’s central banks’ heads in Jackson Hole, where signals concerning the plans of the Federal Reserve’s monetary policy are expected. On the one hand, last week, the FOMC minutes showed that the Fed was not planning to cut the QE program until September 22. On the other hand, hedge funds and well-known private investors are reducing the shares of companies in their portfolios, so the probability that Mr. Powell will announce the start of monetary policy tightening still exists. It also became known that the growing number of COVID-19 cases prompted the Federal Reserve to shift its annual symposium in Jackson Hole to an online format.
US Treasury Secretary Janet Yellen told senior White House advisers that she supports the reappointment of Jerome Powell as chairman of the US Federal Reserve, whose term expires in February. The White House has not yet commented on this issue, but the Biden administration is inclined to nominate another candidate according to preliminary information.
European stock indexes closed in the green zone on Friday. The British FTSE 100 increased by 0.4%, the French CAC 40 gained 0.3%, the German DAX added 0.3%, and the Spanish IBEX 35 added 0.15%. By the end of the week, the FTSE 100 fell by 1.8%, the DAX index decreased by 1.1%, the CAC 40 lost 3.9%, and the IBEX 35 lost 0.9%. Shares of European automakers fell after Volkswagen said it would cut production at its main plant due to a chip shortage. Analysts estimate that the global semiconductor shortage will lead to a 6.3-7.1 million reduction in car output this year, and supply chain disruptions caused by the COVID-19 pandemic will affect the auto industry next year as well.
WTI crude oil prices decreased by 2.55% on Friday, while Brent crude lost 2.15%. By the end of last week, WTI decreased by 8.9%, and Brent decreased by 7.7%. The oil market is still under the pressure of the global spread of Delta and, as a consequence, a decrease in demand for fuel.
The gold situation remains unchanged. As long as the Fed maintains a soft monetary policy, quotes of precious metals will rise. But any hints on the reduction of the QE program will cause a sharp fall in these instruments. A lot will depend on the economic symposium results in Jackson Hole later this week.
The shares of Chinese IT giants are going down as China has passed a new data privacy law that is considered one of the strictest in the world in terms of requirements for companies that collect user data. Another reason is the ongoing trade war between the US and China. Container prices between the US and China have skyrocketed, which will undoubtedly be reflected in higher prices for goods from China. At the same time, the Chinese authorities were able to contain the wave of the Delta strain: no new cases of infection were detected in the country on August 23. As a result, Asian stock indexes slightly increased at the opening on Monday. However, the situation with the epidemic in other Asian countries is only getting worse.
Main market quotes:
S&P 500 (F) 4,441.67 +35.87 (+0.81%)
Dow Jones 35,120.08 +225.96 (+0.65%)
DAX 15,808.04 +42.23 (+0.27%)
FTSE 100 7,087.90 +29.04 (+0.41%)
USD Index 93.46 -0.11 (-0.12%)
Important events for today:
– Australia Manufacturing PMI (m/m) at 02:00 (GMT+3);
– Japan Manufacturing PMI (m/m) at 03:30 (GMT+3);
– Singapore Consumer Price Index (m/m) at 08:00 (GMT+3);
– France Manufacturing PMI (m/m) at 10:15 (GMT+3);
– Germany Manufacturing PMI (m/m) at 10:30 (GMT+3);
– Eurozone Manufacturing PMI (m/m) at 11:00 (GMT+3);
This article reflects a personal opinion and should not be interpreted as an investment advice, and/or offer, and/or a persistent request for carrying out financial transactions, and/or a guarantee, and/or a forecast of future events.
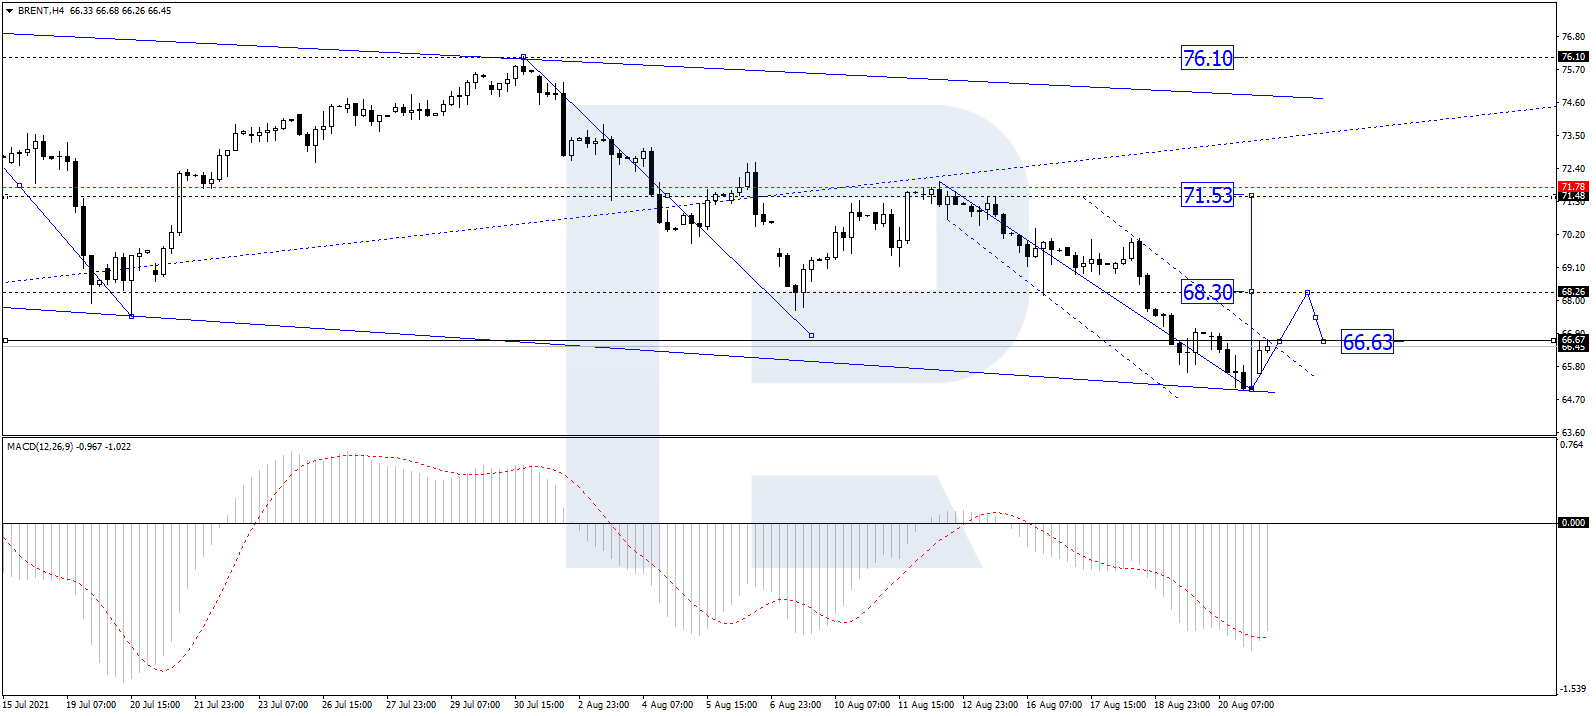
The Brent price is starting another week of August with a growth. The asset is trading at $66.65; the market is trying to compensate for previous losses.
This is the major trigger right now – market players are buying the assets that plunged significantly. A secondary catalyst is a piece of news about an explosion and fire on the platform in the Gulf of Mexico – investors believe that it may cause oil supply problems.
In general, the commodity market may establish conditions for a long-awaited rebound after a stressed period of emotional sales.
In the H4 chart, after reaching the predicted downside target at 67.00, Bret is consolidating below this level; it has already reached the downside border of the range at 65.05. Possibly, today the asset may form a new rising impulse towards 68.27 and then fall to reach 66.66, thus forming another consolidation range near the lows. Later, the market may break the range to the upside and form one more ascending wave with the target at 71.50. From the technical point of view, this scenario is confirmed by MACD Oscillator: its signal line is trading below 0 outside the histogram area and may move upwards. In the future, the line is expected to break 0, thus boosting the asset to grow towards new highs on the price chart.
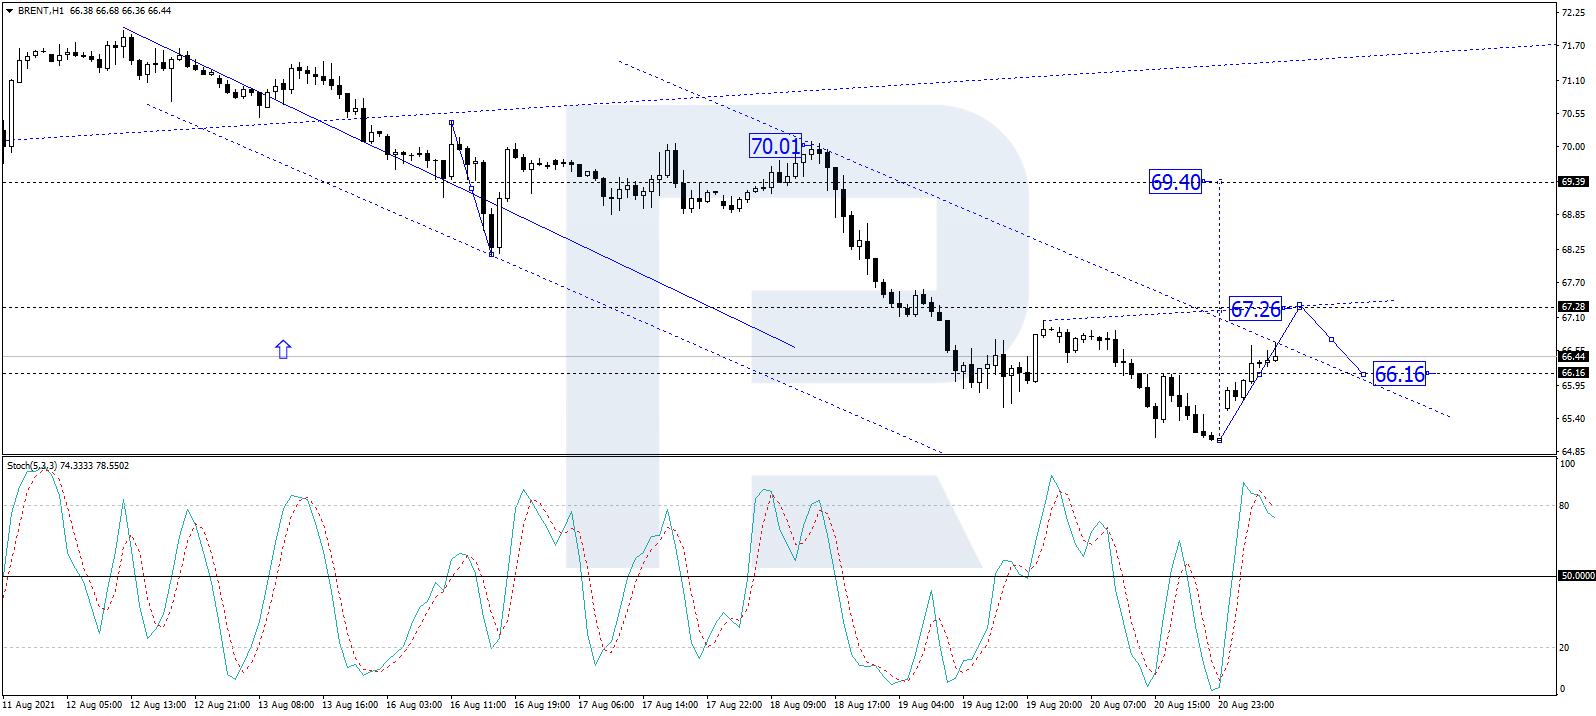
As we can see in the H1 chart, after completing the ascending structure at 66.16 and forming a new consolidation range around this level, Brent is expected to break it to the upside and continue moving upwards with the first target at 67.26. After that, the instrument may correct to test 66.16 from above and then form one more ascending structure with the short-term target at 69.40. From the technical point of view, this idea is confirmed by the Stochastic Oscillator: after breaking 50 and reaching 80, its signal line is expected to fall and return to 50. Later, the line may rebound and resume moving upwards to reach 80.
Disclaimer
Any forecasts contained herein are based on the author’s particular opinion. This analysis may not be treated as trading advice. RoboForex bears no responsibility for trading results based on trading recommendations and reviews contained herein.
No doubt this week will be marked by the celebration of the expected Jackson Hole symposium, since it is expected that this meeting will shed some light over the possible beginning of the withdrawal of stimulus by the Federal Reserve, due to the strong increase in inflation in the United States and the economic recovery generated by the expansion policies carried out to overcome the serious crisis generated by the Covid-19. Jerome Powell is expected to take the floor next Friday, August 27, so we will have to be very attentive to his speech in relation to the clues he can give about the beginning of tapering.
For the moment, the week has begun with the publication of preliminary data on the manufacturing and services sector PMI in France, Germany, for the euro zone as a whole and the United Kingdom, with the general negative trend with the exception of the PMI for the German services sector, which has been the only one that has exceeded market expectations.
Specifically, the preliminary German manufacturing PMI has settled at 62.7 points and that of the services sector at 61.5 points while the market consensus expected these to reach 65.0 points and 61.0 points respectively.
For its part, france’s preliminary manufacturing PMI has settled at 57.3 points in line with market expectations while the data for the services sector has remained 0.6 points below expectations to reach 56.4 points.
If we look at the euro zone as a whole, both data have been negative as they have not only been lower than the figure for the previous month, but have also fallen below market expectations, reaching the preliminary PMI for the services and manufacturing sectors at 59.7 points and 61.5 points respectively.
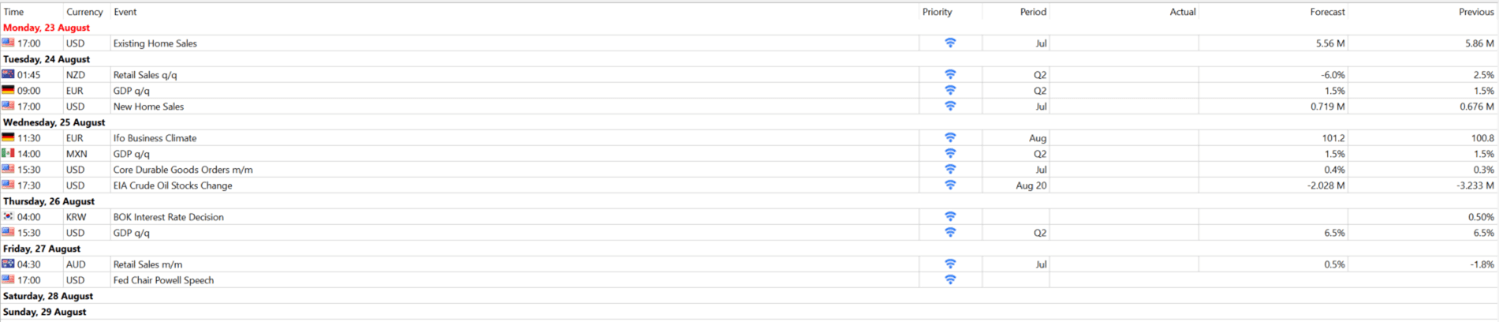
Preliminary data for the United States are also expected to be released this afternoon. Among other data for the week, we can highlight the GDP data for the second quarter in Germany and the Ifo confidence data for business and consumer confidence that will be published on Tuesday, Wednesday and Thursday respectively. Below, we can see some other interesting facts from this week:
Source: MetaTrader 5 macroeconomic calendar.
Trader’s radar: Will Brent be able to break the upside channel to the downside?
During the last weeks, we have been observing that after marking annual highs on July 6 around 78.44 dollars per barrel, the price of a barrel of Brent is experiencing a notable decline due to the growing fear caused by the Delta variant of the coronavirus and its rapid expansion, which may slow economic growth and therefore oil consumption.
In addition, as we discussed in previous analyses, OPEC and its allies reached an agreement at the beginning of last July that would progressively increase production at a rate of 400,000 barrels per day to reach 2 million barrels next December, so that the increase in supply and the possible reduction in demand could put even more downward pressure on the price of a barrel of crude oil.
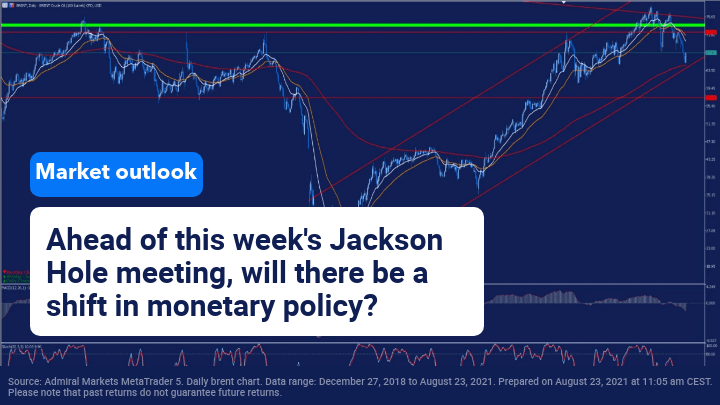
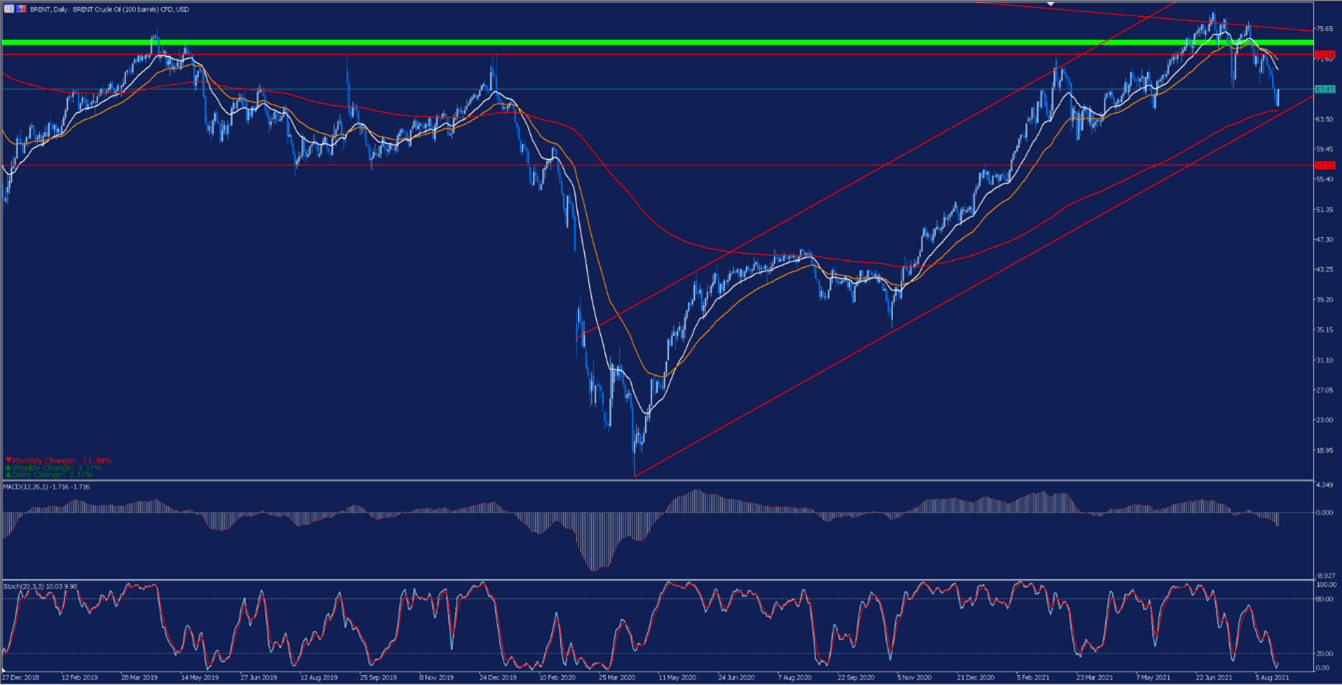
If we look at the daily chart, we can see that the barrel of Brent is currently in an area close to its main support levels represented by its 200-session moving average in the red and the lower band of the upside channel that began in April 2020. The loss of this important level of support could open the door to a further correction whose price objective would be the breadth of that channel.
Source: Admiral Markets MetaTrader 5. Daily Brent chart. Data range: December 27, 2018 to August 23, 2021. Prepared on August 23, 2021 at 11:05 am CEST. Please note that past returns do not guarantee future returns.
Evolution in the last 5 years:
2020: -21.52%
2019: 22.68%
2018: -19.55%
2017: 17.69%
2016: 52.41%
Corporate news and stock indexes
In last Wednesday’s analysis, we commented that Tesla’s stock had been affected after the National Highway Traffic Safety Administration in the United States announced that it would open a formal investigation into the company’s Autopilot system, causing a decline in the share price.
To this news, was added the revelation that the famous investor Michael Burry has increased his short position through PUT options on this company, thus increasing doubts about this company.
But after this negative news, Tesla celebrated its long-awaited day of artificial intelligence, where Elon Musk himself announced that this company is not only investing to improve its current products, but is also developing a humanoid robot known as “Tesla Bot” that could take care of both routine tasks and perform more dangerous actions. this could be a major revolution for the future. This robot could have a height of 1.72 meters and a weight close to 54 kilograms, being able to lift a weight of up to 68 kilograms.
This announcement could again attract the attention of investors since so far this year, the company chaired by Elon Musk loses 3.60% although this figure increases to 19.65% if we compare it with the annual highs reached on January 25.
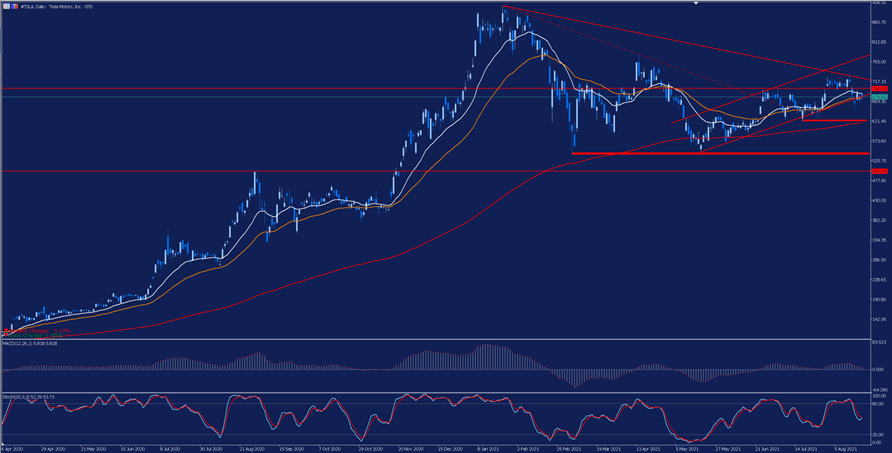
If we look at the daily chart, we can see that the price is currently fighting for its important support level represented by the lower band of the short-term uptrend channel after bouncing down the medium-term downtrend line. The bearish breakout of this channel could open the door to further correction until the next support in the coincident zone of its 200-session moving average and the red stripe of the previous lows.
Conversely, as long as we don’t have a consistent breakout of the $700 level and the downtrend line discussed above, we can’t expect a new upside momentum.
Source: Daily tesla chart from Admiral Markets’ MetaTrader 5 platform from April 1, 2020 to August 23, 2021. Held: August 23 at 11:25 am CEST. Note: Past performance is not a reliable indicator of future results or future performance.
Evolution of the last 5 years:
2020: 743.40%
2019: 25.71%
2018: 6.89%
2017: 45.69%
2016: -10.96%
Did you know that you can use the Trading Central Technical Ideas Lookup indicator to find actionable trading ideas on this index and thousands of other instruments across Forex, stocks, indices, commodities and more?
You can get this indicator completely FREE by upgrading your MetaTrader 5 trading platform provided by Admirals to the exclusive Supreme Edition!
INFORMATION ABOUT ANALYTICAL MATERIALS:
The given data provides additional information regarding all analysis, estimates, prognosis, forecasts, market reviews, weekly outlooks or other similar assessments or information (hereinafter “Analysis”) published on the websites of Admiral Markets investment firms operating under the Admiral Markets trademark (hereinafter “Admiral Markets”) Before making any investment decisions please pay close attention to the following:
This is a marketing communication. The content is published for informative purposes only and is in no way to be construed as investment advice or recommendation. It has not been prepared in accordance with legal requirements designed to promote the independence of investment research, and that it is not subject to any prohibition on dealing ahead of the dissemination of investment research.
Any investment decision is made by each client alone whereas Admiral Markets shall not be responsible for any loss or damage arising from any such decision, whether or not based on the content.
With view to protecting the interests of our clients and the objectivity of the Analysis, Admiral Markets has established relevant internal procedures for prevention and management of conflicts of interest.
The Analysis is prepared by an independent analyst, Roberto Rojas (analyst), (hereinafter “Author”) based on their personal estimations.
Whilst every reasonable effort is taken to ensure that all sources of the content are reliable and that all information is presented, as much as possible, in an understandable, timely, precise and complete manner, Admiral Markets does not guarantee the accuracy or completeness of any information contained within the Analysis.
Any kind of past or modeled performance of financial instruments indicated within the content should not be construed as an express or implied promise, guarantee or implication by Admiral Markets for any future performance. The value of the financial instrument may both increase and decrease and the preservation of the asset value is not guaranteed.
Leveraged products (including contracts for difference) are speculative in nature and may result in losses or profit. Before you start trading, please ensure that you fully understand the risks involved.
Admirals
An all-in-one solution for spending, investing, and managing your moneyMore than a broker, Admirals is a financial hub, offering a wide range of financial products and services. We make it possible to approach personal finance through an all-in-one solution for investing, spending, and managing money.
As we commented in our previous analysis of the Forex market, during the first half of the year, the trend in the dollar index was positive, scoring 2.822% and at the moment it seems that this strength is being maintained during the summer months, since since the beginning of last June, the dollar index is experiencing a strong upward trend that has taken it from its support around $90 to an area close to $93.70, thus surpassing the previous annual high at $93.43.
Attention in the foreign exchange market remains focused on possible measures and changes that the Federal Reserve may undertake in the coming months to deal with rising inflation in the United States brought about by the economic recovery and consumption growth thanks to the advanced vaccination process, since a change in policies and an eventual rise in interest rates could boost the dollar.
EURUSD Analysis
After a positive year 2020, the year 2021 is leaving a bitter taste in the EURUSD after during the first half of this lost 2.93% against the dollar due to the recovery that the greenback is experiencing as we have mentioned previously.
So far this summer, the trend remains negative and at the moment shows no signs of recovery in the short term, because if as expected finally the Federal Reserve begins to take measures such as raising interest rates or reducing its asset purchase program thus reducing liquidity, the dollar can continue to be one of the main beneficiaries thus increasing the downtrend in this pair.
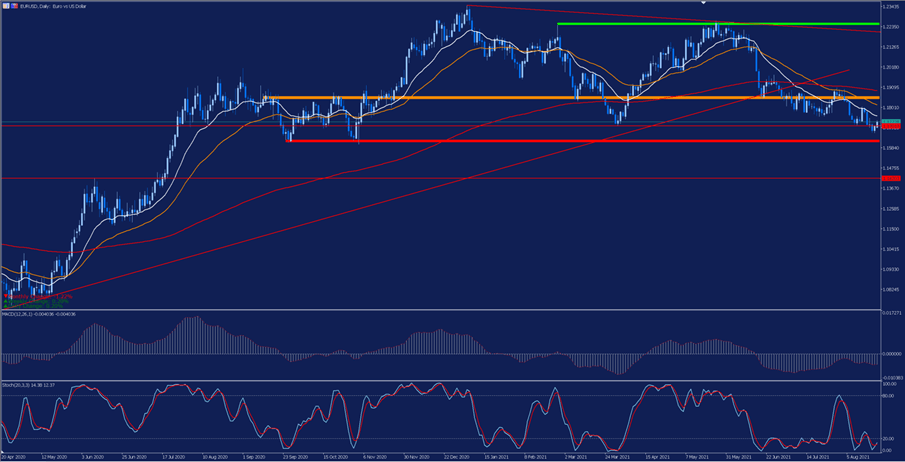
Technically speaking, if we look at the daily chart we can see that EURUSD slowed at the 1.2240 level forming a double a double ceiling (green) which has caused the price to lose several support levels including the uptrend line, the support and resistance zone represented by the orange band and its 200-session moving average.
This bearish move has also caused the so-called death crossover by making a triple bearish crossover of its short, medium and long term moving averages (white, orange and red) thus confirming the change from uptrend to bearish.
Despite the accumulated oversold that we can observe in its stochastic indicator, it seems that the price could head to its next support level represented by the lower red band.
This is an important point and we will have to see if the price is able to maintain this important level and make a upward rebound in search of its 18-session moving average (white) or even its important resistance support zone in the orange band. Therefore, we must be aware of the evolution of the price in this area, since a failure in this possible rebound or the loss of this important level of support, would open the doors to a further correction to levels close to $1.14 per euro.
Source: Daily EURUSD chart of Admiral Markets MetaTrader 5 platform from April 22, 2020 to August 23, 2021. Held on August 23 at 12:00 pm CEST. Please note that past returns do not guarantee future returns.
Evolution of the last 5 years:
2020 = 8.93%
2019 = -2.21%
2018 = -4.47%
2017 = 14.09%
2016 = -3.21%
GBPUSD analysis
In the case of GBPUSD, we can see that although during the first half of the year it has risen by 1.12%, since it marked annual highs at the end of last May, it is experiencing a strong decline that has led it to fall from an area above $1.42 dollars to a level close to $1.36.
As we can see on the weekly chart, the price has faced several times its important level of resistance represented by the green band that joins the highs of 2018 and this year 2021 but has not been able to overcome this level.
After its last failed attempt, the price has made a strong correction that has led it to make a bearish cross of its short and medium-term moving averages respectively in search of its resistance support level in the orange band.
If the price finally reaches this level, we will have to be very attentive to the behavior, since the bearish breakout of this level would open the door to a possible change of trend from upside to bearish pending confirmation of the confrontation between the price and its 200-week moving average in the red that acts as the main support. The loss of this moving average would open the door to a further correction in search of $1.30 per pound.
Source: Weekly chart of GBPUSD on Admiral Markets MetaTrader 5 platform from January 11, 2015 to August 23, 2021. Held on August 23 at 12:10 p.m. CEST. Please note that past returns do not guarantee future returns.
Evolution of the last 5 years:
2020 = 3.10%
2019 = 3.95%
2018 = -5.54%
2017 = 9.43%
2016 = -16.26%
USDJPY Analysis
Finally, if we look at USDJPY, we can see how the Japanese Yen was one of the big losers with the rises of the dollar since during the first half of the year this has lost 7.61% against the dollar thanks to the strong rises in February and March since it went from trading at levels close to 102,700 to trading at levels close to 111,000.
During this summer, we can observe a fairly lateral movement in the price action between its resistance level represented by the green band and its average of 18 weeks in blank possibly due to the accumulated overbought and the negative divergence that we could find in the past in its stochastic indicator.
Technically speaking, we will have to be very attentive to the evolution of the quote in the coming weeks, since if the price manages to overcome this level of resistance, we could find a bullish rally in search of the upper band of the side channel in green. Conversely, the downside breakout of its 18-session moving average could show strength in the Yen which could seek its next support level in the coincident zone of its 40- and 200-week averages in orange and red respectively.
Source: Weekly chart of USDJPY on Admiral Markets’ MetaTrader 5 platform from January 11, 2015 to August 23, 2021. Held on August 23 at 12:25 p.m. CEST. Please note that past returns do not guarantee future returns.
Evolution of the last 5 years:
2020 = -4.95%
2019 = -0.88%
2018 = -2.76%
2017 = -3.59%
2016 = -2.85%
Did you know that you can use the Trading Central Technical Ideas Lookup indicator to find actionable trading ideas on thousands of different markets?
Start your free download by clicking on the banner below:
INFORMATION ABOUT ANALYTICAL MATERIALS:
The given data provides additional information regarding all analysis, estimates, prognosis, forecasts, market reviews, weekly outlooks or other similar assessments or information (hereinafter “Analysis”) published on the websites of Admiral Markets investment firms operating under the Admiral Markets trademark (hereinafter “Admiral Markets”) Before making any investment decisions please pay close attention to the following:
This is a marketing communication. The content is published for informative purposes only and is in no way to be construed as investment advice or recommendation. It has not been prepared in accordance with legal requirements designed to promote the independence of investment research, and that it is not subject to any prohibition on dealing ahead of the dissemination of investment research.
Any investment decision is made by each client alone whereas Admiral Markets shall not be responsible for any loss or damage arising from any such decision, whether or not based on the content.
With view to protecting the interests of our clients and the objectivity of the Analysis, Admiral Markets has established relevant internal procedures for prevention and management of conflicts of interest.
The Analysis is prepared by an independent analyst, Roberto Rojas (analyst), (hereinafter “Author”) based on their personal estimations.
Whilst every reasonable effort is taken to ensure that all sources of the content are reliable and that all information is presented, as much as possible, in an understandable, timely, precise and complete manner, Admiral Markets does not guarantee the accuracy or completeness of any information contained within the Analysis.
Any kind of past or modeled performance of financial instruments indicated within the content should not be construed as an express or implied promise, guarantee or implication by Admiral Markets for any future performance. The value of the financial instrument may both increase and decrease and the preservation of the asset value is not guaranteed.
Leveraged products (including contracts for difference) are speculative in nature and may result in losses or profit. Before you start trading, please ensure that you fully understand the risks involved.
Admirals
An all-in-one solution for spending, investing, and managing your moneyMore than a broker, Admirals is a financial hub, offering a wide range of financial products and services. We make it possible to approach personal finance through an all-in-one solution for investing, spending, and managing money.











 Article by




 Source: Admiral Markets MetaTrader 5. Daily Brent chart. Data range: December 27, 2018 to August 23, 2021. Prepared on August 23, 2021 at 11:05 am CEST. Please note that past returns do not guarantee future returns.
  Source: Daily tesla chart from Admiral Markets’ MetaTrader 5 platform from April 1, 2020 to August 23, 2021. Held: August 23 at 11:25 am CEST. Note: Past performance is not a reliable indicator of future results or future performance.



 Source: Daily EURUSD chart of Admiral Markets MetaTrader 5 platform from April 22, 2020 to August 23, 2021. Held on August 23 at 12:00 pm CEST. Please note that past returns do not guarantee future returns.
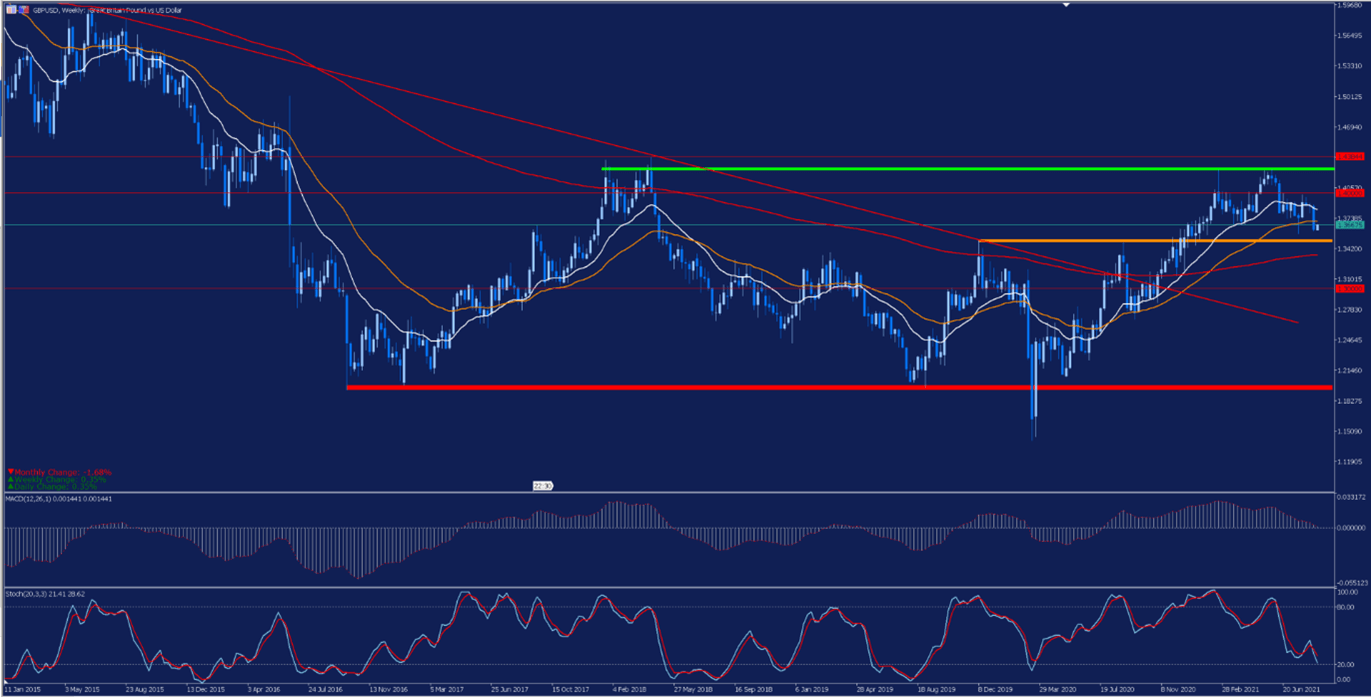 Source: Weekly chart of GBPUSD on Admiral Markets MetaTrader 5 platform from January 11, 2015 to August 23, 2021. Held on August 23 at 12:10 p.m. CEST. Please note that past returns do not guarantee future returns.
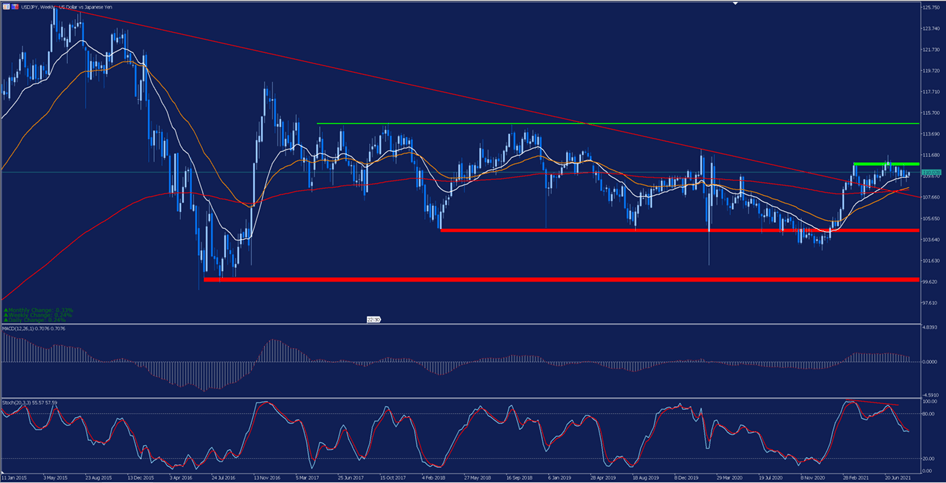 Source: Weekly chart of USDJPY on Admiral Markets’ MetaTrader 5 platform from January 11, 2015 to August 23, 2021. Held on August 23 at 12:25 p.m. CEST. Please note that past returns do not guarantee future returns.