
By CountingPips.com COT Home | Data Tables | Data Downloads | Newsletter
Here are the latest charts and statistics for the Commitment of Traders (COT) data published by the Commodities Futures Trading Commission (CFTC).
The latest COT data is updated through Tuesday August 17 2021 and shows a quick view of how large traders (for-profit speculators and commercial entities) were positioned in the futures markets. All currency positions are in direct relation to the US dollar where, for example, a bet for the euro is a bet that the euro will rise versus the dollar while a bet against the euro will be a bet that the euro will decline versus the dollar.
US Dollar Index Futures:
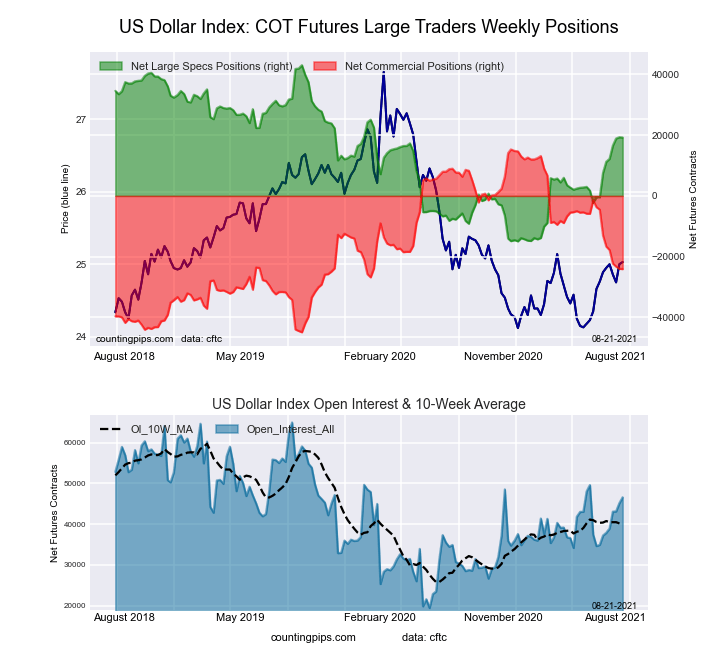 The US Dollar Index large speculator standing this week was a net position of 19,211 contracts in the data reported through Tuesday. This was a weekly reduction of -115 contracts from the previous week which had a total of 19,326 net contracts.
This week’s current strength score (the trader positioning range over the past three years, measured from 0 to 100) shows the speculators are currently Bullish with a score of 58.9 percent. The commercials are Bearish with a score of 34.6 percent and the small traders (not shown in chart) are Bullish-Extreme with a score of 83.3 percent.
| US DOLLAR INDEX Statistics | SPECULATORS | COMMERCIALS | SMALL TRADERS |
| – Percent of Open Interest Longs: | 76.1 | 3.5 | 15.1 |
| – Percent of Open Interest Shorts: | 34.9 | 55.2 | 4.6 |
| – Net Position: | 19,211 | -24,089 | 4,878 |
| – Gross Longs: | 35,460 | 1,643 | 7,014 |
| – Gross Shorts: | 16,249 | 25,732 | 2,136 |
| – Long to Short Ratio: | 2.2 to 1 | 0.1 to 1 | 3.3 to 1 |
| NET POSITION TREND: | |||
| – COT Index Score (3 Year Range Pct): | 58.9 | 34.6 | 83.3 |
| – COT Index Reading (3 Year Range): | Bullish | Bearish | Bullish-Extreme |
| NET POSITION MOVEMENT INDEX: | |||
| – 6-Week Change in Strength Index: | 20.1 | -18.4 | -7.5 |
Free Reports:
 Get our Weekly Commitment of Traders Reports - See where the biggest traders (Hedge Funds and Commercial Hedgers) are positioned in the futures markets on a weekly basis.
 Sign Up for Our Stock Market Newsletter – Get updated on News, Charts & Rankings of Public Companies when you join our Stocks Newsletter
Euro Currency Futures:
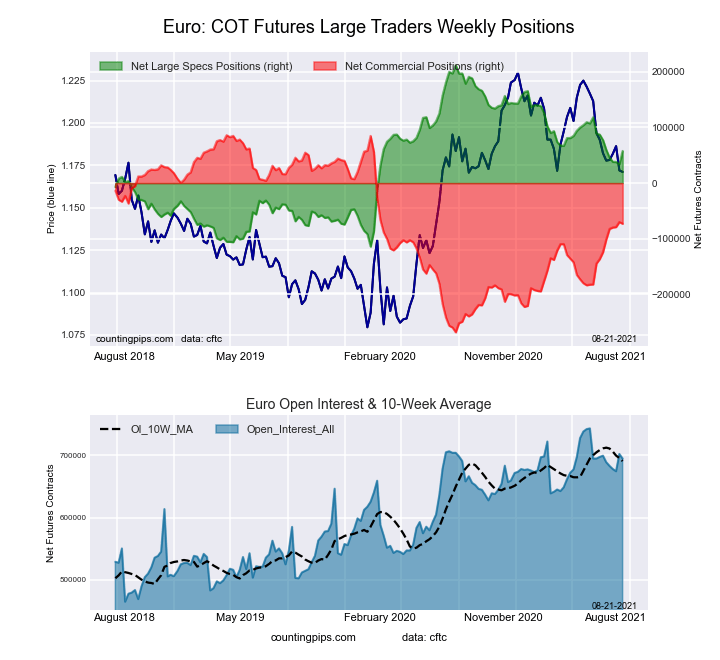 The Euro Currency large speculator standing this week was a net position of 57,640 contracts in the data reported through Tuesday. This was a weekly increase of 23,783 contracts from the previous week which had a total of 33,857 net contracts.
This week’s current strength score (the trader positioning range over the past three years, measured from 0 to 100) shows the speculators are currently Bullish with a score of 52.7 percent. The commercials are Bullish with a score of 55.1 percent and the small traders (not shown in chart) are Bearish-Extreme with a score of 4.4 percent.
| EURO Currency Statistics | SPECULATORS | COMMERCIALS | SMALL TRADERS |
| – Percent of Open Interest Longs: | 33.6 | 55.2 | 10.1 |
| – Percent of Open Interest Shorts: | 25.3 | 65.7 | 7.9 |
| – Net Position: | 57,640 | -73,083 | 15,443 |
| – Gross Longs: | 233,529 | 383,684 | 70,047 |
| – Gross Shorts: | 175,889 | 456,767 | 54,604 |
| – Long to Short Ratio: | 1.3 to 1 | 0.8 to 1 | 1.3 to 1 |
| NET POSITION TREND: | |||
| – COT Index Score (3 Year Range Pct): | 52.7 | 55.1 | 4.4 |
| – COT Index Reading (3 Year Range): | Bullish | Bullish | Bearish-Extreme |
| NET POSITION MOVEMENT INDEX: | |||
| – 6-Week Change in Strength Index: | -6.0 | 14.4 | -49.9 |
British Pound Sterling Futures:
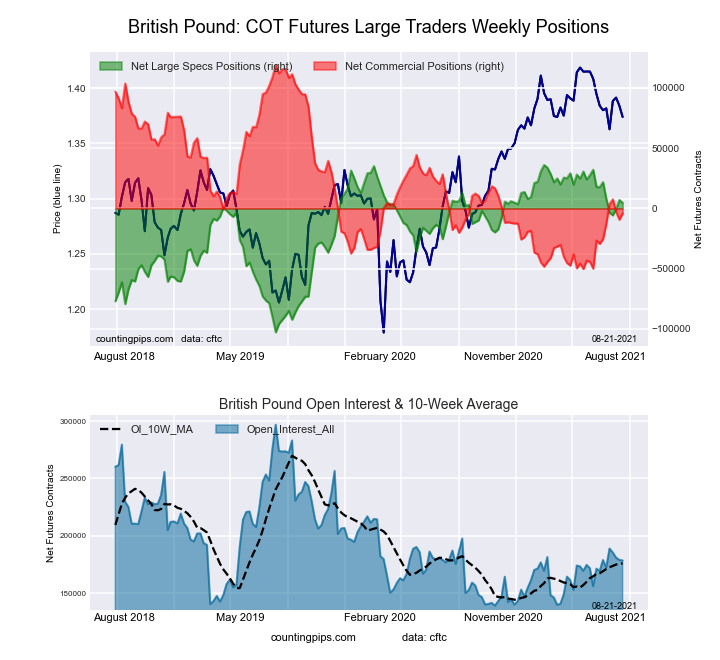 The British Pound Sterling large speculator standing this week was a net position of 4,651 contracts in the data reported through Tuesday. This was a weekly fall of -2,419 contracts from the previous week which had a total of 7,070 net contracts.
This week’s current strength score (the trader positioning range over the past three years, measured from 0 to 100) shows the speculators are currently Bullish with a score of 77.4 percent. The commercials are Bearish with a score of 27.3 percent and the small traders (not shown in chart) are Bullish with a score of 54.4 percent.
| BRITISH POUND Statistics | SPECULATORS | COMMERCIALS | SMALL TRADERS |
| – Percent of Open Interest Longs: | 23.5 | 58.1 | 16.2 |
| – Percent of Open Interest Shorts: | 20.9 | 60.4 | 16.6 |
| – Net Position: | 4,651 | -4,054 | -597 |
| – Gross Longs: | 41,898 | 103,667 | 28,967 |
| – Gross Shorts: | 37,247 | 107,721 | 29,564 |
| – Long to Short Ratio: | 1.1 to 1 | 1.0 to 1 | 1.0 to 1 |
| NET POSITION TREND: | |||
| – COT Index Score (3 Year Range Pct): | 77.4 | 27.3 | 54.4 |
| – COT Index Reading (3 Year Range): | Bullish | Bearish | Bullish |
| NET POSITION MOVEMENT INDEX: | |||
| – 6-Week Change in Strength Index: | -12.4 | 12.6 | -8.6 |
Japanese Yen Futures:
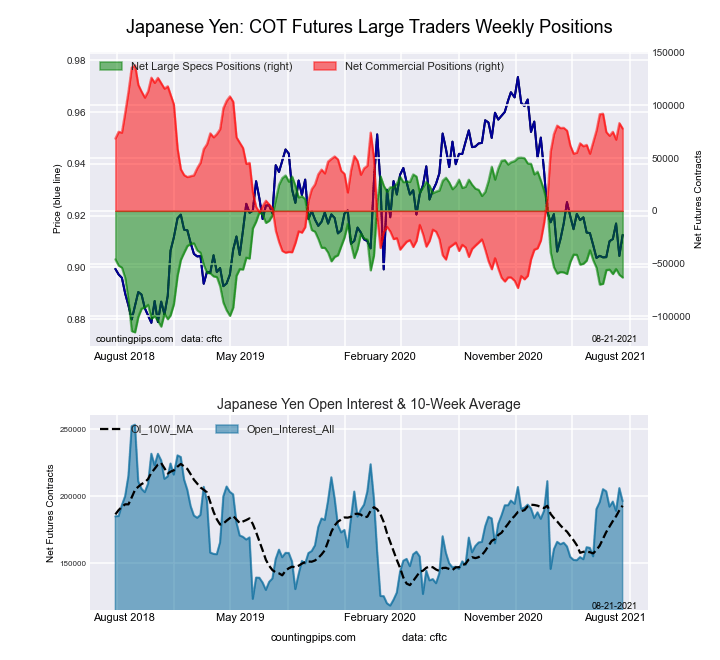 The Japanese Yen large speculator standing this week was a net position of -63,208 contracts in the data reported through Tuesday. This was a weekly reduction of -2,551 contracts from the previous week which had a total of -60,657 net contracts.
This week’s current strength score (the trader positioning range over the past three years, measured from 0 to 100) shows the speculators are currently Bearish with a score of 31.4 percent. The commercials are Bullish with a score of 71.6 percent and the small traders (not shown in chart) are Bearish with a score of 27.8 percent.
| JAPANESE YEN Statistics | SPECULATORS | COMMERCIALS | SMALL TRADERS |
| – Percent of Open Interest Longs: | 14.0 | 75.0 | 10.3 |
| – Percent of Open Interest Shorts: | 46.2 | 35.3 | 17.8 |
| – Net Position: | -63,208 | 78,091 | -14,883 |
| – Gross Longs: | 27,532 | 147,403 | 20,156 |
| – Gross Shorts: | 90,740 | 69,312 | 35,039 |
| – Long to Short Ratio: | 0.3 to 1 | 2.1 to 1 | 0.6 to 1 |
| NET POSITION TREND: | |||
| – COT Index Score (3 Year Range Pct): | 31.4 | 71.6 | 27.8 |
| – COT Index Reading (3 Year Range): | Bearish | Bullish | Bearish |
| NET POSITION MOVEMENT INDEX: | |||
| – 6-Week Change in Strength Index: | 3.6 | -6.6 | 15.5 |
Swiss Franc Futures:
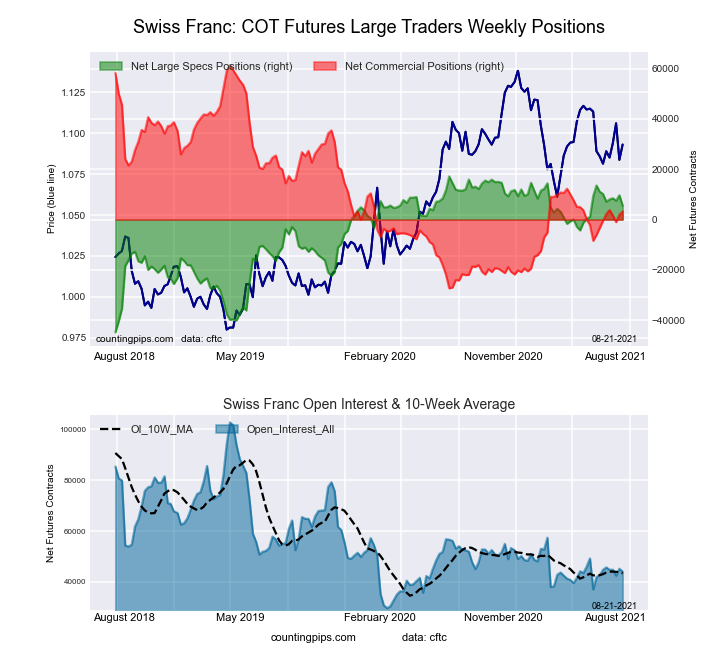 The Swiss Franc large speculator standing this week was a net position of 5,547 contracts in the data reported through Tuesday. This was a weekly fall of -4,131 contracts from the previous week which had a total of 9,678 net contracts.
This week’s current strength score (the trader positioning range over the past three years, measured from 0 to 100) shows the speculators are currently Bullish-Extreme with a score of 81.2 percent. The commercials are Bearish with a score of 34.5 percent and the small traders (not shown in chart) are Bearish with a score of 37.4 percent.
| SWISS FRANC Statistics | SPECULATORS | COMMERCIALS | SMALL TRADERS |
| – Percent of Open Interest Longs: | 32.6 | 43.7 | 23.3 |
| – Percent of Open Interest Shorts: | 20.0 | 36.2 | 43.4 |
| – Net Position: | 5,547 | 3,277 | -8,824 |
| – Gross Longs: | 14,354 | 19,211 | 10,255 |
| – Gross Shorts: | 8,807 | 15,934 | 19,079 |
| – Long to Short Ratio: | 1.6 to 1 | 1.2 to 1 | 0.5 to 1 |
| NET POSITION TREND: | |||
| – COT Index Score (3 Year Range Pct): | 81.2 | 34.5 | 37.4 |
| – COT Index Reading (3 Year Range): | Bullish-Extreme | Bearish | Bearish |
| NET POSITION MOVEMENT INDEX: | |||
| – 6-Week Change in Strength Index: | -7.5 | 4.2 | 2.6 |
Canadian Dollar Futures:
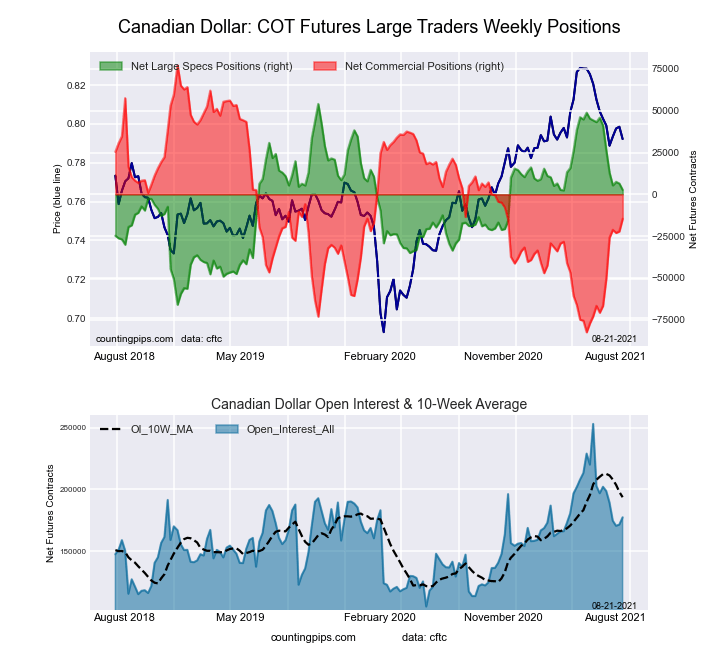 The Canadian Dollar large speculator standing this week was a net position of 2,660 contracts in the data reported through Tuesday. This was a weekly reduction of -3,805 contracts from the previous week which had a total of 6,465 net contracts.
This week’s current strength score (the trader positioning range over the past three years, measured from 0 to 100) shows the speculators are currently Bullish with a score of 57.2 percent. The commercials are Bearish with a score of 42.5 percent and the small traders (not shown in chart) are Bullish with a score of 64.9 percent.
| CANADIAN DOLLAR Statistics | SPECULATORS | COMMERCIALS | SMALL TRADERS |
| – Percent of Open Interest Longs: | 26.2 | 52.5 | 20.3 |
| – Percent of Open Interest Shorts: | 24.7 | 60.8 | 13.6 |
| – Net Position: | 2,660 | -14,642 | 11,982 |
| – Gross Longs: | 46,499 | 93,234 | 36,107 |
| – Gross Shorts: | 43,839 | 107,876 | 24,125 |
| – Long to Short Ratio: | 1.1 to 1 | 0.9 to 1 | 1.5 to 1 |
| NET POSITION TREND: | |||
| – COT Index Score (3 Year Range Pct): | 57.2 | 42.5 | 64.9 |
| – COT Index Reading (3 Year Range): | Bullish | Bearish | Bullish |
| NET POSITION MOVEMENT INDEX: | |||
| – 6-Week Change in Strength Index: | -32.1 | 32.6 | -20.4 |
Australian Dollar Futures:
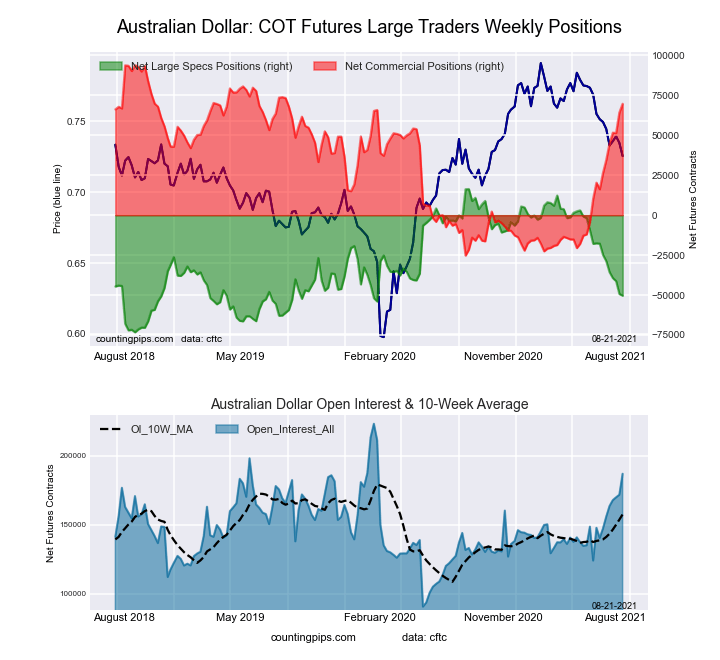 The Australian Dollar large speculator standing this week was a net position of -50,367 contracts in the data reported through Tuesday. This was a weekly lowering of -1,054 contracts from the previous week which had a total of -49,313 net contracts.
This week’s current strength score (the trader positioning range over the past three years, measured from 0 to 100) shows the speculators are currently Bearish with a score of 25.6 percent. The commercials are Bullish with a score of 79.7 percent and the small traders (not shown in chart) are Bearish-Extreme with a score of 14.2 percent.
| AUSTRALIAN DOLLAR Statistics | SPECULATORS | COMMERCIALS | SMALL TRADERS |
| – Percent of Open Interest Longs: | 34.3 | 54.4 | 9.2 |
| – Percent of Open Interest Shorts: | 61.3 | 17.1 | 19.6 |
| – Net Position: | -50,367 | 69,709 | -19,342 |
| – Gross Longs: | 64,169 | 101,694 | 17,213 |
| – Gross Shorts: | 114,536 | 31,985 | 36,555 |
| – Long to Short Ratio: | 0.6 to 1 | 3.2 to 1 | 0.5 to 1 |
| NET POSITION TREND: | |||
| – COT Index Score (3 Year Range Pct): | 25.6 | 79.7 | 14.2 |
| – COT Index Reading (3 Year Range): | Bearish | Bullish | Bearish-Extreme |
| NET POSITION MOVEMENT INDEX: | |||
| – 6-Week Change in Strength Index: | -28.4 | 36.3 | -39.1 |
New Zealand Dollar Futures:
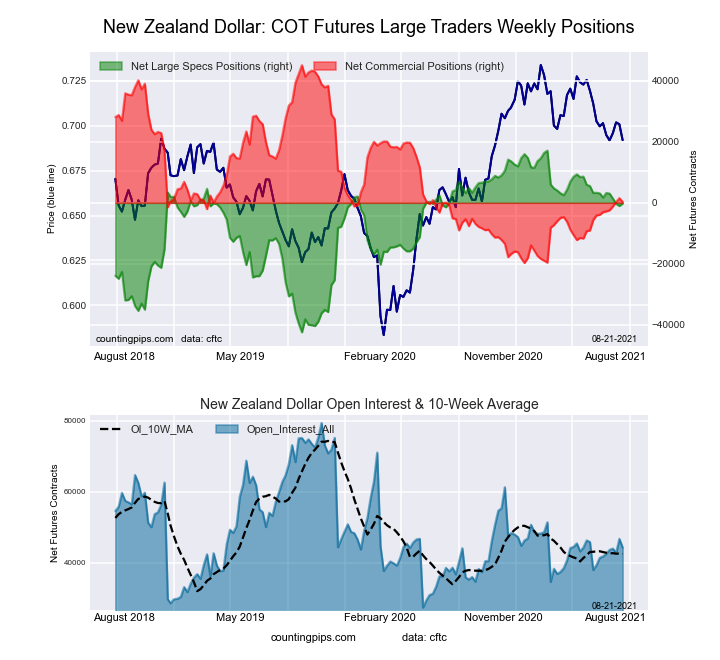 The New Zealand Dollar large speculator standing this week was a net position of -235 contracts in the data reported through Tuesday. This was a weekly increase of 797 contracts from the previous week which had a total of -1,032 net contracts.
This week’s current strength score (the trader positioning range over the past three years, measured from 0 to 100) shows the speculators are currently Bullish with a score of 70.9 percent. The commercials are Bearish with a score of 30.9 percent and the small traders (not shown in chart) are Bullish with a score of 52.0 percent.
| NEW ZEALAND DOLLAR Statistics | SPECULATORS | COMMERCIALS | SMALL TRADERS |
| – Percent of Open Interest Longs: | 37.7 | 46.8 | 9.3 |
| – Percent of Open Interest Shorts: | 38.2 | 46.0 | 9.5 |
| – Net Position: | -235 | 344 | -109 |
| – Gross Longs: | 16,674 | 20,707 | 4,111 |
| – Gross Shorts: | 16,909 | 20,363 | 4,220 |
| – Long to Short Ratio: | 1.0 to 1 | 1.0 to 1 | 1.0 to 1 |
| NET POSITION TREND: | |||
| – COT Index Score (3 Year Range Pct): | 70.9 | 30.9 | 52.0 |
| – COT Index Reading (3 Year Range): | Bullish | Bearish | Bullish |
| NET POSITION MOVEMENT INDEX: | |||
| – 6-Week Change in Strength Index: | -3.3 | 5.3 | -15.7 |
Mexican Peso Futures:
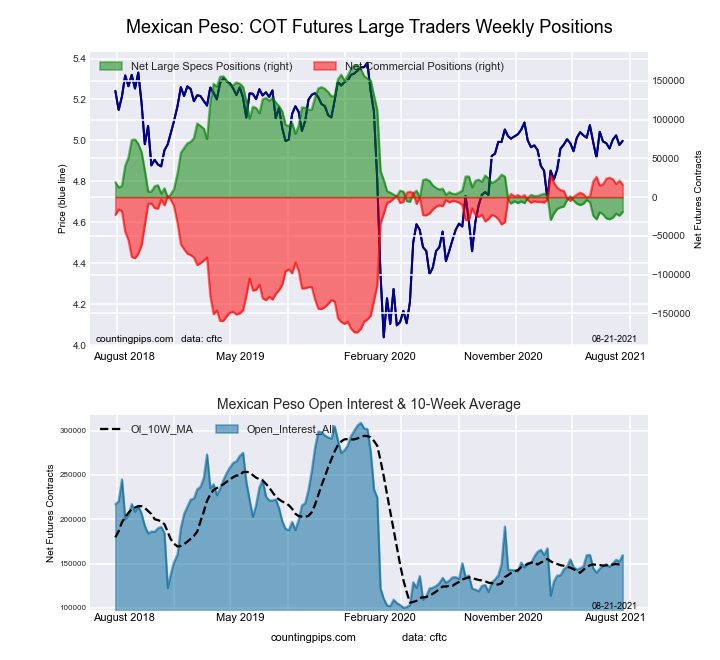 The Mexican Peso large speculator standing this week was a net position of -19,117 contracts in the data reported through Tuesday. This was a weekly boost of 4,770 contracts from the previous week which had a total of -23,887 net contracts.
This week’s current strength score (the trader positioning range over the past three years, measured from 0 to 100) shows the speculators are currently Bearish-Extreme with a score of 5.2 percent. The commercials are Bullish-Extreme with a score of 94.0 percent and the small traders (not shown in chart) are Bullish with a score of 56.5 percent.
| MEXICAN PESO Statistics | SPECULATORS | COMMERCIALS | SMALL TRADERS |
| – Percent of Open Interest Longs: | 48.0 | 46.1 | 4.1 |
| – Percent of Open Interest Shorts: | 59.9 | 36.2 | 2.1 |
| – Net Position: | -19,117 | 15,943 | 3,174 |
| – Gross Longs: | 76,530 | 73,652 | 6,522 |
| – Gross Shorts: | 95,647 | 57,709 | 3,348 |
| – Long to Short Ratio: | 0.8 to 1 | 1.3 to 1 | 1.9 to 1 |
| NET POSITION TREND: | |||
| – COT Index Score (3 Year Range Pct): | 5.2 | 94.0 | 56.5 |
| – COT Index Reading (3 Year Range): | Bearish-Extreme | Bullish-Extreme | Bullish |
| NET POSITION MOVEMENT INDEX: | |||
| – 6-Week Change in Strength Index: | 1.6 | -0.4 | -10.2 |
Brazilian Real Futures:
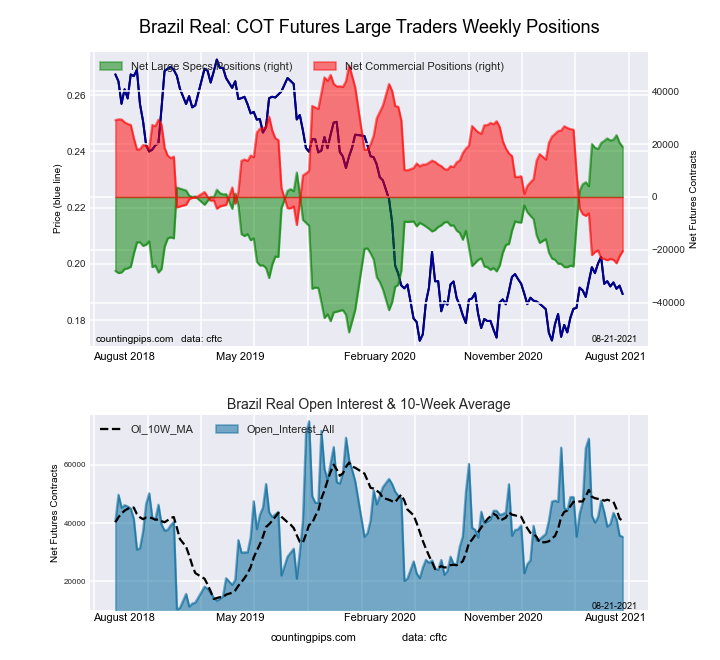 The Brazilian Real large speculator standing this week was a net position of 18,989 contracts in the data reported through Tuesday. This was a weekly reduction of -1,549 contracts from the previous week which had a total of 20,538 net contracts.
This week’s current strength score (the trader positioning range over the past three years, measured from 0 to 100) shows the speculators are currently Bullish-Extreme with a score of 94.0 percent. The commercials are Bearish-Extreme with a score of 6.1 percent and the small traders (not shown in chart) are Bullish-Extreme with a score of 85.0 percent.
| BRAZIL REAL Statistics | SPECULATORS | COMMERCIALS | SMALL TRADERS |
| – Percent of Open Interest Longs: | 73.3 | 17.5 | 9.2 |
| – Percent of Open Interest Shorts: | 19.4 | 75.6 | 4.9 |
| – Net Position: | 18,989 | -20,489 | 1,500 |
| – Gross Longs: | 25,846 | 6,176 | 3,230 |
| – Gross Shorts: | 6,857 | 26,665 | 1,730 |
| – Long to Short Ratio: | 3.8 to 1 | 0.2 to 1 | 1.9 to 1 |
| NET POSITION TREND: | |||
| – COT Index Score (3 Year Range Pct): | 94.0 | 6.1 | 85.0 |
| – COT Index Reading (3 Year Range): | Bullish-Extreme | Bearish-Extreme | Bullish-Extreme |
| NET POSITION MOVEMENT INDEX: | |||
| – 6-Week Change in Strength Index: | -3.1 | 4.0 | -8.0 |
Russian Ruble Futures:
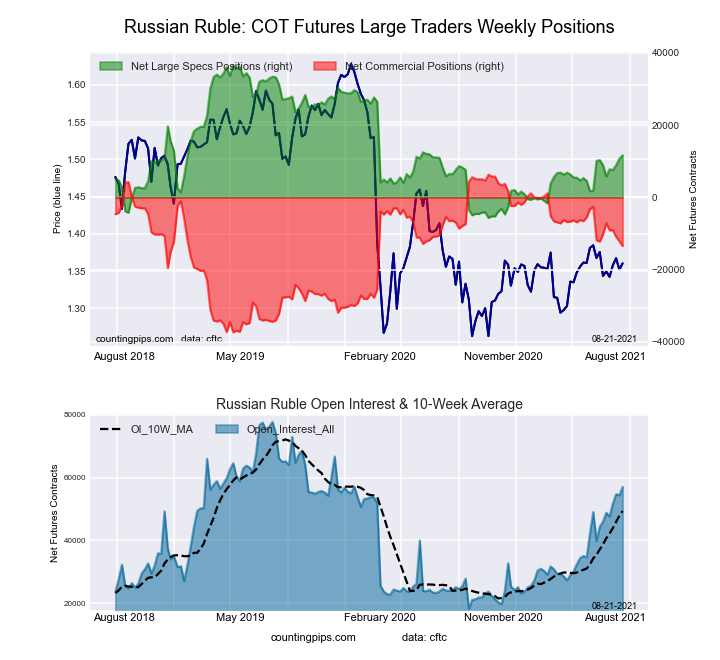 The Russian Ruble large speculator standing this week was a net position of 11,701 contracts in the data reported through Tuesday. This was a weekly gain of 999 contracts from the previous week which had a total of 10,702 net contracts.
This week’s current strength score (the trader positioning range over the past three years, measured from 0 to 100) shows the speculators are currently Bearish with a score of 41.1 percent. The commercials are Bullish with a score of 54.7 percent and the small traders (not shown in chart) are Bullish-Extreme with a score of 93.1 percent.
| RUSSIAN RUBLE Statistics | SPECULATORS | COMMERCIALS | SMALL TRADERS |
| – Percent of Open Interest Longs: | 42.5 | 52.5 | 4.9 |
| – Percent of Open Interest Shorts: | 22.0 | 76.0 | 1.8 |
| – Net Position: | 11,701 | -13,448 | 1,747 |
| – Gross Longs: | 24,239 | 29,947 | 2,796 |
| – Gross Shorts: | 12,538 | 43,395 | 1,049 |
| – Long to Short Ratio: | 1.9 to 1 | 0.7 to 1 | 2.7 to 1 |
| NET POSITION TREND: | |||
| – COT Index Score (3 Year Range Pct): | 41.1 | 54.7 | 93.1 |
| – COT Index Reading (3 Year Range): | Bearish | Bullish | Bullish-Extreme |
| NET POSITION MOVEMENT INDEX: | |||
| – 6-Week Change in Strength Index: | 6.6 | -7.6 | 15.1 |
Bitcoin Futures:
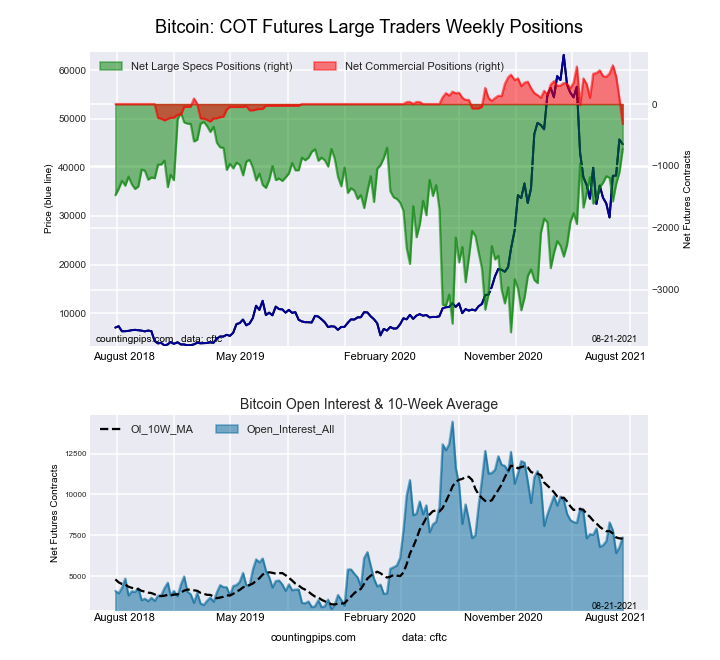 The Bitcoin large speculator standing this week was a net position of -726 contracts in the data reported through Tuesday. This was a weekly gain of 378 contracts from the previous week which had a total of -1,104 net contracts.
This week’s current strength score (the trader positioning range over the past three years, measured from 0 to 100) shows the speculators are currently Bullish-Extreme with a score of 83.5 percent. The commercials are Bearish-Extreme with a score of 0.0 percent and the small traders (not shown in chart) are Bearish with a score of 24.1 percent.
| BITCOIN Statistics | SPECULATORS | COMMERCIALS | SMALL TRADERS |
| – Percent of Open Interest Longs: | 65.2 | 4.0 | 25.3 |
| – Percent of Open Interest Shorts: | 75.1 | 8.3 | 11.1 |
| – Net Position: | -726 | -321 | 1,047 |
| – Gross Longs: | 4,804 | 293 | 1,863 |
| – Gross Shorts: | 5,530 | 614 | 816 |
| – Long to Short Ratio: | 0.9 to 1 | 0.5 to 1 | 2.3 to 1 |
| NET POSITION TREND: | |||
| – COT Index Score (3 Year Range Pct): | 83.5 | 0.0 | 24.1 |
| – COT Index Reading (3 Year Range): | Bullish-Extreme | Bearish-Extreme | Bearish |
| NET POSITION MOVEMENT INDEX: | |||
| – 6-Week Change in Strength Index: | 15.4 | -81.2 | 7.4 |
Article By CountingPips.com – Receive our weekly COT Reports by Email
*COT Report: The COT data, released weekly to the public each Friday, is updated through the most recent Tuesday (data is 3 days old) and shows a quick view of how large speculators or non-commercials (for-profit traders) were positioned in the futures markets.
The CFTC categorizes trader positions according to commercial hedgers (traders who use futures contracts for hedging as part of the business), non-commercials (large traders who speculate to realize trading profits) and nonreportable traders (usually small traders/speculators).
Find CFTC criteria here: (http://www.cftc.gov/MarketReports/CommitmentsofTraders/ExplanatoryNotes/index.htm).

- COT Metals Charts: Weekly Speculator Bets led by Copper & Steel Jul 18, 2026
- COT Bonds Charts: Weekly Speculator Bets led by 2-Year, SOFR 3M & 5-Year Bonds Jul 18, 2026
- COT Energy Charts: Weekly Speculator Bets led by Brent Oil & Heating Oil Jul 18, 2026
- COT Soft Commodities Charts: Weekly Speculator Bets led by Wheat, Corn & Soybean Meal Jul 18, 2026
- The Bank of Canada kept its interest rate unchanged. Platinum prices reached a three‑week high Jul 16, 2026
- Stock indices rose after the release of US inflation data. China’s GDP slowed sharply Jul 15, 2026
- GBP/USD Awaits Political News: What Will Happen Next Jul 15, 2026
- USD/JPY Holds at Highs: Pressure Lingers on Yen Jul 14, 2026
- Oil prices jumped 4% amid a new wave of escalation between the US and Iran Jul 13, 2026
- EUR/USD: US Inflation Will Determine Everything Jul 13, 2026