Stock indices are under pressure from inflation. Investors are hedging with gold

by JustForex

The US stock indexes recorded their most significant weekly percentage decline since January and fell sharply Friday after the May inflation report dashed hopes that price pressures may have peaked. Data released on Friday showed that US consumer inflation jumped to 8.6% y/y in May, the biggest gain since 1981. Gasoline prices hit a record high, and the cost of food rose sharply. The core Consumer Price Index (which excludes food and fuel prices) failed to fall below 6.0%. Rapid price pressures force consumers to change their spending habits, heightening recession fears. The University of Michigan’s consumer sentiment index for June also hit a new record, falling to 50.2 from 58.1. This situation caused the dollar index to spike and stock indices to fall. At the closing of the stock exchange on Friday Dow Jones Index (US30) decreased by 2.73% (-4.96% for the week), S&P 500 (US500) fell by 2.91% (-5.66% for the week). The Technology Index NASDAQ (US100) lost 3.52% (-7.05% for the week). All three indices were down for the week.

Equity markets in Europe also declined on Friday. German DAX (DE30) decreased by 3.08% (-5.59% for the week), French CAC 40 (FR 40) lost 2.69% (-5.30% for the week), Spanish IBEX 35 (ES35) fell by 3.68% (-4.51% for the week), British FTSE 100 (UK100) was down by 2.12% (-2.86% for the week). The markets are under the pressure of the fears that inflation growth and an increase in interest rates will lead to recession not only in the United States but also in the Eurozone. On Friday, Spain published its annual inflation data showing an increase from 8.3% to 8.7%. German, French, and Italian inflation data will also be released this week, followed by an overall figure for the Eurozone at the end of the week.

Gold futures rose sharply on Friday after US inflation data. Under the classical scheme, investors started shifting assets into the “yellow” metal “if inflation goes up, buy gold.” But it should be noted that this growth has no fundamental support because the US Federal Reserve pursues a tightening policy, which usually has a negative impact on precious metal prices. That’s because gold is inversely correlated with US government bond yields, which tend to rise amid rising interest rates.

European countries bought a record amount of Russian palladium in March. Purchases took place against the backdrop of sanctions and logistical problems. MMC Norilsk Nickel is the world’s largest supplier of palladium. In Germany, there is one of the company’s main customers – BASF SE concern. Palladium is used to produce car catalysts. Russian palladium can be replaced by platinum, but this will require considerable investment in research institutes.

Oil prices dropped more than 2 dollars on Friday and continued to decline Monday as the outbreak of COVID-19 disease in Beijing stifled hopes for a rapid increase in fuel demand in China. At the same time, concerns about global inflation and sluggish economic growth further exacerbated the market decline. On Friday, Brent crude oil futures fell by 1.7% to $119.95 a barrel, while West Texas Intermediate (WTI) crude futures fell by 1.8% to $118.54 a barrel. China remains a significant downside risk in the near term. Still, most view the gradual normalization of Chinese demand as a strong positive for oil, as current demand is far from reflecting normal conditions.

Asian markets traded flat. Japan’s Nikkei 225 (JP225) gained 1.00% for the week, Hong Kong’s Hang Seng (HK50) added 2.46% for last week, and Australia’s S&P/ASX 200 (AU200) decreased by 4.24% for the week. At the opening of trading on Monday, Asian stock indexes started declining amid risks from the US Consumer Price Index and China’s fight against COVID. Beijing’s most populous Chaoyang district announced three rounds of mass testing on Sunday to quell the COVID-19 outbreak. Beijing also postponed opening the city’s schools, which had been scheduled for Monday. Shanghai, another Chinese metropolis, also faced tighter restrictions over the weekend, with many establishments suspending food services. The new lockdowns in Shanghai came just 12 days after the city emerged from a months-long lockdown in early June.

In the commodities market, futures on corn (+6.36%), cotton (+5.36%), wheat (+3.1%), soybeans (+2.96%), and natural gas (+2.72%) showed the biggest gains in by the end of the week. Futures on lumber (-10.80%), platinum (-4.37%), copper (-4.33%), palladium (-3.32%) and sugar (-2.28%) showed the biggest drops.

Main market quotes:

S&P 500 (F) (US500) 3,900.86 −116.96 (−2.91%)

Dow Jones (US30) 31,392.79 −880.00 (−2.73%)

DAX (DE40) 13,761.83 −436.97 (−3.08%)

FTSE 100 (UK100) 7,317.52 −158.69 (−2.12%)

USD Index 104.19 +0.97 (+0.94%)

Important events for today:
  • – UK GDP (q/q) at 09:00 (GMT+3);
  • – UK Industrial Production (m/m) at 09:00 (GMT+3);
  • – US FOMC Member Brainard Speaks at 21:00 (GMT+3).

by JustForex


This article reflects a personal opinion and should not be interpreted as an investment advice, and/or offer, and/or a persistent request for carrying out financial transactions, and/or a guarantee, and/or a forecast of future events.

Why a new eurozone crisis now looks a distinct possibility

By Muhammad Ali Nasir, University of Leeds 

– The European Central Bank (ECB) has confirmed speculation that it will become the latest central bank to start raising headline interest rates to try to ward off inflation. The bank is to raise rates by 0.25 points to 0.25% for lending and -0.25% for deposits, with plans for another rise at the next meeting in September. It will also curtail its programme for buying the government bonds of countries like Italy and Greece by not increasing purchases every month overall.

All major economies are struggling with the difficulties of trying to deal with inflation by raising interest rates in the knowledge that it will drive up borrowing costs for consumers and businesses and potentially bring about a recession.

But for the eurozone, the situation is complicated by the fact that it has been propping up indebted countries who can’t deflate their currencies to get through economic turbulence. If the ECB now gets too tough on inflation, it could create a market panic that might revive the eurozone crisis of the 2010s.

Stagflation is back

The global outlook for inflation and global economic stability has significantly deteriorated in the last few months. In 2021 inflation headed upwards as global demand recovered after the pandemic but supply chains couldn’t keep up – not least because of China’s zero COVID policy. Rising energy prices were a major part of the problem.

Many central bankers thought this was temporary, and indeed when inflation started to ease in most developed economies in the second half of 2021, this seemed right. But the Russian invasion of Ukraine has both broken the decades-long peace in Europe, and brought three decades of a “great moderation” in prices to an end. Thanks to the extra pressure on oil and energy prices, inflation is many countries is now rising ahead of economic growth.

Inflation is also starting to weigh on the global economy in various ways. People have less money, so they can’t buy as much. And investors are more worried about the outlook, so they are more reluctant to invest. The prospects for global economic growth have significantly slowed since February. For example, the World Bank has just downgraded its forecast for the third time in six months, and currently predicts 2.9% growth in 2022.

The effect on government bonds

In view of this situation, investors have also been offloading corporate and government bonds. They fear that the prospects for debt defaults are higher than before, and the returns (yields) on bonds look even worse than before now that inflation is so high. Bond prices have duly been falling, which means that yields (interest rates) have been rising because they are inversely related.

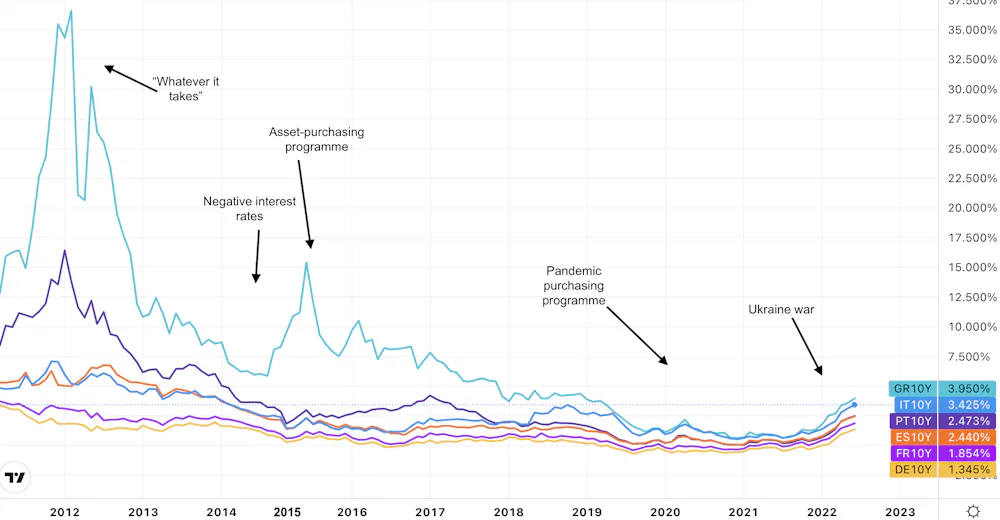
The yields on eurozone countries’ debt have been rising sharply, meaning it is becoming more expensive for them to borrow. Just like in the 2010s, the most pressure is on the countries whose public finances are the most unwieldy, such as Italy and Greece. But even Germany, which has been the bedrock of eurozone fiscal prudence and has enjoyed negative yields (also known as free borrowing) for most of the last three years, has also seen a significant rise.

Eurozone sovereign bond yields 2012-22

Chart showing yields of 10-year sovereign bonds
10-year bond yields: Germany = yellow; Greece = turquoise; Italy = blue; Portugal = indigo; France = purple; Spain = orange.
Trading View

The eurozone crisis was caused in the early 2010s when investor fears about the solvency of Greece, Spain, Portugal and Ireland drove their bond yields to levels where they needed ECB support – otherwise, their debts would have become unmanageable and they would likely have had to exit the euro.

This support came in the form of loans; bond-buying programmes from the European Central Bank (ECB) to prop up prices; negative interest rates; “creating” euros via quantitative easing (QE); and reassurances from then president Mario Draghi that the ECB would do “whatever it takes” to prevent a collapse.

These measures are the main reason why bond yields have remained below ruinous levels since the 2010s, with bond-buying support and QE most recently provided early in the pandemic as countries had to borrow even more to cope. The ECB is currently sitting on government bonds from member states worth around €5 trillion (£4.3 trillion), and is currently making net purchases of over €30 billion a month.

Now that yields are surging again, one solution is for the ECB to buy even more bonds from these countries. However, it is not that simple because bond-buying underpinned by QE is another reason for inflation rising. Indeed, one of the other arguments in favour of these moves in the 2010s was to ward off deflation, which is not a valid justification now that inflation is so high. Bond-buying now would be a violation of the ECB’s strategy aiming for 2% inflation.

Were it to drive up inflation, that would make the economic outlook even worse. This could cause further sell-offs in bonds that would push yields higher.

Instead, the ECB is following the likes of the US Federal Reserve and Bank of England and doing the opposite. The danger with increasing interest rates and ending bond-buying is that it will hurt the economy, which could make investors more worried about the outlook and force bond yields even higher. Indeed, yields have just surged after the ECB signalled that it was potentially open to doing a 0.5 percentage points hike in rates in September, in a sign of how precarious this situation is.

In sum, the ECB is facing a strange dilemma, where every policy choice will potentially raise the risks of a repeat of the eurozone crisis of the 2010s. Inflation is a delicate business, which is why the Austrian economist Fridrich von Hayek compared it to trying to “catch a tiger by its tail”.

If inflation starts to fall as growth deteriorates, the eurozone may somehow avoid another crisis because it will then be easier to do more QE and buy more bonds. But in the meantime, all eyes will be on the bond yields of countries like Italy and Greece to see how high they rise.The Conversation

About the Author:

Muhammad Ali Nasir, Associate Professor in Economics, University of Leeds

This article is republished from The Conversation under a Creative Commons license. Read the original article.


Top Technical Tool: Japanese Candlesticks

How to spot trade setups using this tool

By Elliott Wave International

You may be familiar with an Open-High-Low-Close (OHLC) chart: comprised of vertical lines with small horizontal lines on each side. The top of each vertical line is the high and the bottom is the low. The small horizontal lines on either side represent the open and close for that period.

A Japanese Candlestick chart is similar. It allows you to zoom in and analyze a single period’s worth of price action.

Here’s an example of a Japanese Candlestick chart:

Japanese Candlestick charts employ the same data that OHLC price charts do except that the data is expressed differently. The real body is the range between the open and close, and appears as a small block. Shadows are the lines that extend upward and downward from this block, and represent the highs and lows.

Candlestick analysis can help alert you to reversals. Two bearish candlestick reversal patterns that Elliott Wave International’s (EWI) analysts find highly reliable are Bearish Engulfing patterns and Evening Star patterns. A Bearish Engulfing pattern means that the close is below the open, and the real body encompasses the real body of the prior candle. On a daily chart, it portends further decline for the next three to five days. An Evening Star pattern consists of three candles – a large bullish candlestick, a small-bodied candle and a red candle. It signals that the uptrend is nearing its end.

,p>You can combine Japanese Candlesticks with other tools in order to get a high-confidence view. This weekly continuation chart for the Canadian dollar combines a 20-period moving average to show that the trend is down — allowing you to focus on bearish reversal candlestick patterns to spot trading opportunities.

EWI’s senior instructor Jeffrey Kennedy notes that “combining these reversal patterns with moving averages makes them even more dynamic because they focus your attention in the direction of the larger trend.”

One of the best ways to get an edge in trading is to hand-pick a few select tools for your arsenal. Japanese Candlesticks are one such tool. In skilled hands, they can really show you the trend and alert you to trend reversals.

Free for a limited time, you can get full access to EWI’s premium course on candlesticks to help you add another arrow in your quiver. This course, “Japanese Candlesticks Made Simple and Effective” normally sells for $99.

You need to simply enter the Partner Referral Code CANDLES once you click on the link below and join free Club EWI to gain access to this free course.

Learn how to use candlesticks as a simple, effective trading and risk-management tool now (Partner Referral Code: CANDLES).

This article was syndicated by Elliott Wave International and was originally published under the headline . EWI is the world’s largest market forecasting firm. Its staff of full-time analysts led by Chartered Market Technician Robert Prechter provides 24-hour-a-day market analysis to institutional and private investors around the world.

Interest rate hikes are a blunt yet dangerous weapon in inflation fight

By George Prior

Interest rates hikes are a “blunt yet dangerous weapon” in the fight against scorching hot inflation, which is hitting low-income households the hardest, warns the CEO of one of the world’s largest independent financial advisory, asset management and fintech organisations.

The warning from deVere Group’s Nigel Green comes as the average global inflation rate reaches 7.4%.

In the U.S., UK and Germany, inflation has risen to the highest rate for 40 years. Consumer price growth has even begun surging across Asia, a region that until recently had largely been able to avoid the broad-based global trend.

Inflation in Latin America’s largest economies is the highest it’s been in 15 years; the overall rate in Sub-Saharan Africa is expected to grow to 12.2% this year; the Netherlands this year nearly tripled to 9.2%; and Australia’s has doubled to 5.3%.

Nigel Green says: “Inflation is a serious global problem. There are real fears of a return to the chronic inflation and recessionary landscapes of the 1970s.

“In an attempt to tackle the scourge of surging prices, central banks around the world are hiking interest rates.  According to the theory, when interest rates are higher less money will be spent. When less money is being spent, prices for consumer goods rise more slowly.

“But raising interest rates is a blunt weapon in this fight.

“Hiking borrowing costs can only do so much to address the triggers of inflation on the supply side of economies, like unprecedented shipping backlogs or shortages of materials and labour, Covid lockdowns in China, and the war in Ukraine.”

He continues: “Raising interest rates to fight inflation is also a dangerous weapon too.

“Inflation is hitting lower and middle-income families up to a third harder than the richest ones, according to research, because they need to spend a higher proportion of their income spent on essentials such as food and energy.”

Clearly, something needs to be done to shield the poorest families from the worst effects of rising prices.

“However, hiking interest rates may not be the solution? Why? Because lower-income households are the ones most likely to have credit – and higher interest rates mean higher borrowing costs,” says the deVere Group CEO.

“In addition, it intentionally slows the economy which might then trigger a recession and stunt companies’ efforts to invest and create jobs which, again, would have a greater negative financial impact on poorer families.”

Nigel Green concludes: “The most effective weapons in the fight against inflation are not within the remit of central banks.

“The best measures lie in getting a conclusive international grip on the pandemic, stopping the war in Ukraine, solving supply-chain problems, and significantly ramping up the production of green energy – energy demand is only set to increase over time and interest rate hikes will not be enough to dampen demand.”

About:

deVere Group is one of the world’s largest independent advisors of specialist global financial solutions to international, local mass affluent, and high-net-worth clients.  It has a network of more than 70 offices across the world, over 80,000 clients and $12bn under advisement.

COT Week 23 Charts: Forex Speculators Positions mostly higher led by Canadian dollar & Swiss franc

By InvestMacro | COT | Data Tables | COT Leaders | Downloads | COT Newsletter
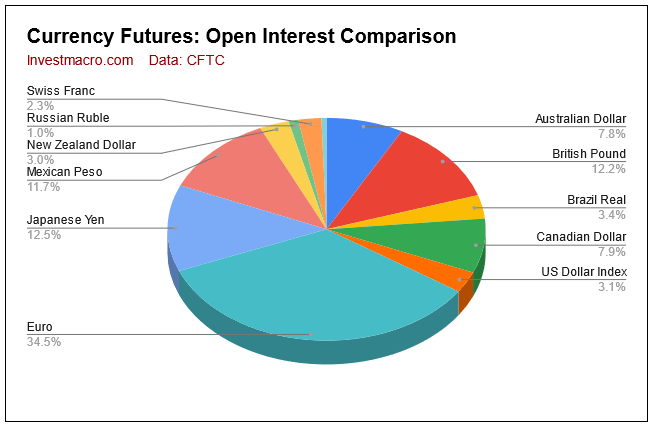
Here are the latest charts and statistics for the Commitment of Traders (COT) data published by the Commodities Futures Trading Commission (CFTC).

The latest COT data is updated through Tuesday June 7th and shows a quick view of how large traders (for-profit speculators and commercial entities) were positioned in the futures markets. All currency positions are in direct relation to the US dollar where, for example, a bet for the euro is a bet that the euro will rise versus the dollar while a bet against the euro will be a bet that the euro will decline versus the dollar.

COT Currencies market speculator bets were mostly higher this week as eight out of the eleven currency markets we cover had higher positioning this week while three markets had lower contracts.

Leading the gains for currency markets was the Canadian dollar (5,945 contracts) and the Swiss franc (4,326 contracts) with the British pound sterling (3,295 contracts), Japanese yen (2,793 contracts), Brazil real (1,389 contracts), Australian dollar (786 contracts), US Dollar Index (400 contracts) and Bitcoin (87 contracts) also showing a positive week.

Meanwhile, leading the declines in speculator bets this week were Mexican peso (-2,723 contracts) and Euro (-1,729 contracts) with New Zealand dollar (-1,047 contracts) also registering lower bets on the week.

Currency Speculators Notes:

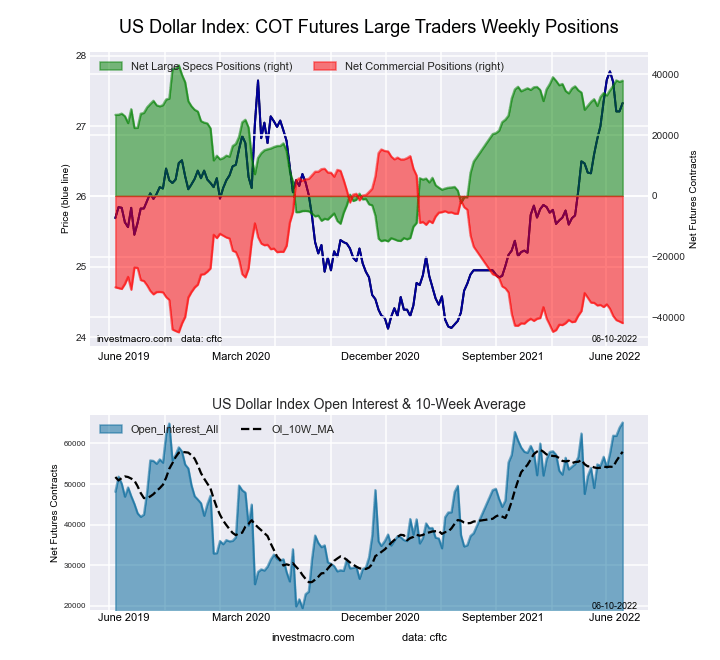
  • US Dollar Index speculator bets have continued their upward climb in four out of the past five weeks as well as nine out of the past twelve weeks. USD Index remains in an extreme-bullish strength level and is very close (currently +37,938 contracts) to the highest net speculator position (+39,078 contracts on January 4th) of this recent bullish cycle, emphasizing the strong speculator bias.
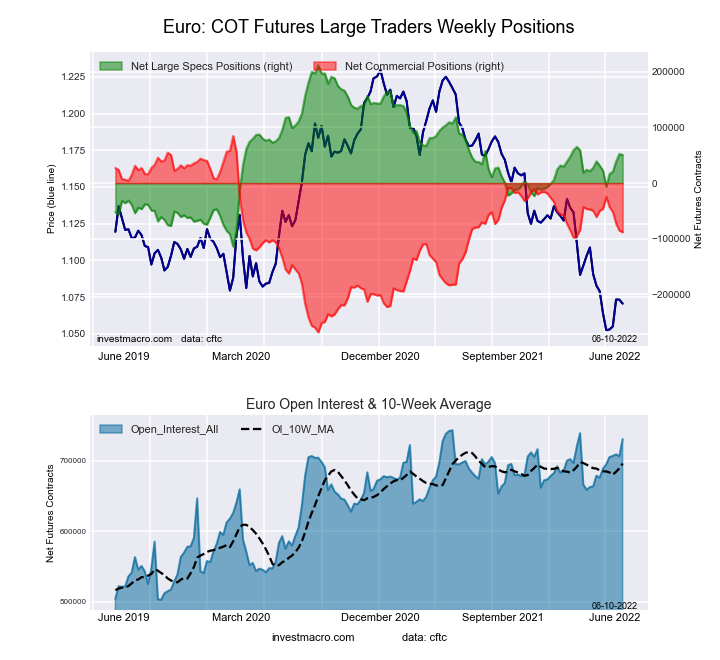
  • The Euro speculator position saw a pullback this week (-1,729 contracts) after huge gains in the previous three weeks (+58,650 contracts). Speculator sentiment is still pretty strong currently (+50,543 contracts) despite a very weak exchange rate (EURUSD at 1.0524 to close the week) and weak outlook for the Eurozone economy with rising inflation.
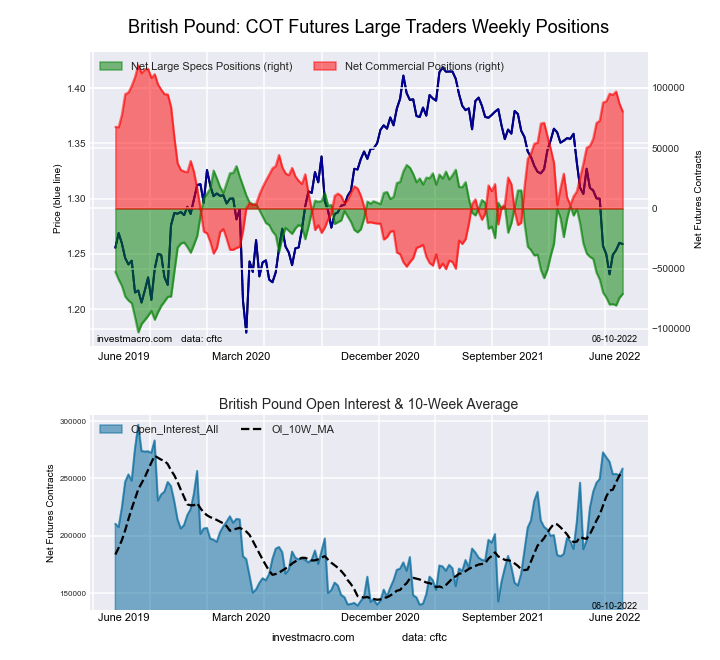
  • British pound sterling speculator sentiment has crumbled in the past few months. The net speculator position managed to poke its head above its negative bias on February 15th with a total of +2,237 net contracts but sentiment has deteriorated since. From February 22nd to this week, speculator bets have dropped by a total of -73,047 contracts and recently hit a 139-week low on May 24th, the lowest level of speculator sentiment dating back to September of 2019.
  • Japanese yen speculator positions are the most bearish of the major currencies just under -100,000 contracts. The USDJPY exchange rate is at a 20-year high and there has been no sign that the BOJ is interest in raising interest rates while other central banks commit to higher rates. These factors seem to say that the rout of the yen will continue ahead for some time (but how far can it go?).
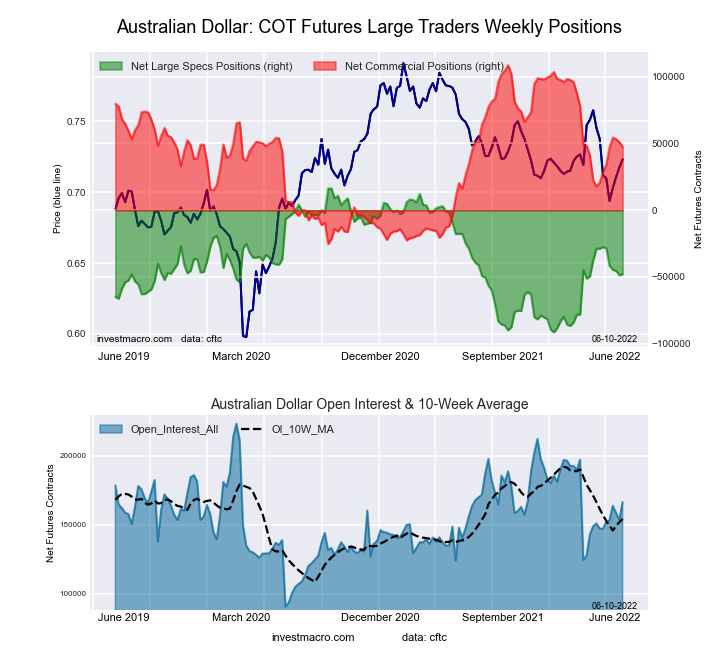
  • Commodity currency speculator bets are on the defensive lately. Australian dollar spec bets have fallen in five out of the past six weeks.
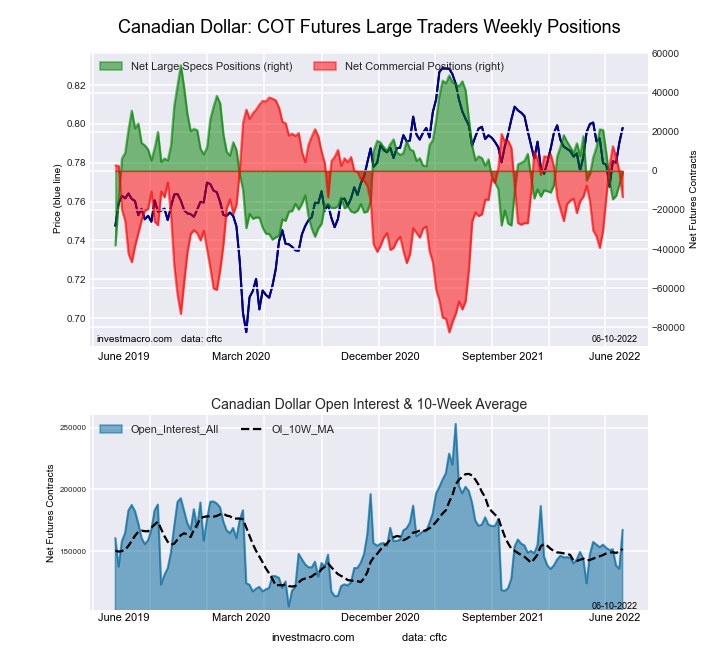
  • Canadian dollar bets are now in bearish territory for a 5th straight week.
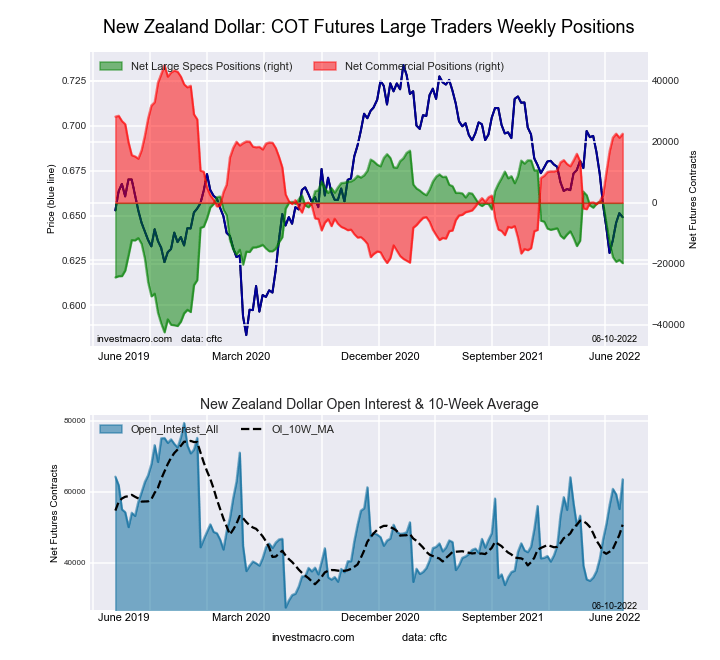
  • New Zealand dollar speculator positions have declined in six out of the past seven weeks and the net position has now fallen to the lowest level since March of 2020
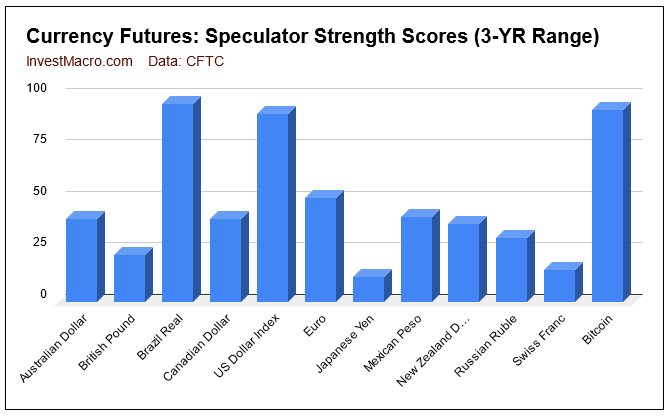
Strength scores (3-Year range of Speculator positions, from 0 to 100 where above 80 is extreme bullish and below 20 is extreme bearish) show that the Brazilian Real, US Dollar Index and Bitcoin are all in extreme-bullish levels at the current moment. On the opposite end of the extreme spectrum, the Japanese yen and the Swiss franc are very weak in relative speculator sentiment and sit in the extreme-bearish levels.
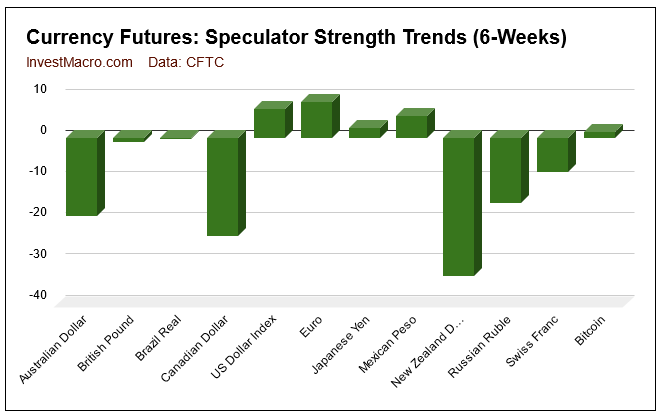
Strength score trends (or move index, that calculate 6-week changes in strength scores) shows that the commodity currencies have been losing sentiment over the last six weeks. The Australian dollar, Canadian dollar and the New Zealand dollar have all had changes of at least -18.8 percent in their strength scores with the New Zealand dollar leading the decline with a -33.3 percent drop in six weeks. The US Dollar Index, Euro and Mexican Peso have had small but rising scores over the past six weeks.


Data Snapshot of Forex Market Traders | Columns Legend
Jun-07-2022OIOI-IndexSpec-NetSpec-IndexCom-NetCOM-IndexSmalls-NetSmalls-Index
USD Index65,16310037,93891-41,86353,92559
EUR730,6679550,54351-88,1895137,64637
GBP258,62376-70,8102380,46577-9,65536
JPY266,054100-91,64612109,10989-17,46318
CHF49,79441-16,1321627,21687-11,08420
CAD167,37342-1,06240-13,4015814,46359
AUD166,42257-47,8964047,4135448354
NZD63,54070-19,7713822,68165-2,91019
MXN248,1847232,72641-38,117575,39166
RUB20,93047,54331-7,15069-39324
BRL72,3717046,70596-48,95442,24991
Bitcoin10,9905849093-52903914


US Dollar Index Futures:

US Dollar Index Forex Futures COT ChartThe US Dollar Index large speculator standing this week recorded a net position of 37,938 contracts in the data reported through Tuesday. This was a weekly lift of 400 contracts from the previous week which had a total of 37,538 net contracts.

This week’s current strength score (the trader positioning range over the past three years, measured from 0 to 100) shows the speculators are currently Bullish-Extreme with a score of 91.2 percent. The commercials are Bearish-Extreme with a score of 5.0 percent and the small traders (not shown in chart) are Bullish with a score of 59.5 percent.

US DOLLAR INDEX StatisticsSPECULATORSCOMMERCIALSSMALL TRADERS
– Percent of Open Interest Longs:85.13.28.9
– Percent of Open Interest Shorts:26.967.52.8
– Net Position:37,938-41,8633,925
– Gross Longs:55,4602,0905,780
– Gross Shorts:17,52243,9531,855
– Long to Short Ratio:3.2 to 10.0 to 13.1 to 1
NET POSITION TREND:
– Strength Index Score (3 Year Range Pct):91.25.059.5
– Strength Index Reading (3 Year Range):Bullish-ExtremeBearish-ExtremeBullish
NET POSITION MOVEMENT INDEX:
– 6-Week Change in Strength Index:7.0-8.813.4


Euro Currency Futures:

Euro Currency Futures COT ChartThe Euro Currency large speculator standing this week recorded a net position of 50,543 contracts in the data reported through Tuesday. This was a weekly reduction of -1,729 contracts from the previous week which had a total of 52,272 net contracts.

This week’s current strength score (the trader positioning range over the past three years, measured from 0 to 100) shows the speculators are currently Bullish with a score of 50.5 percent. The commercials are Bullish with a score of 51.0 percent and the small traders (not shown in chart) are Bearish with a score of 36.7 percent.

EURO Currency StatisticsSPECULATORSCOMMERCIALSSMALL TRADERS
– Percent of Open Interest Longs:31.550.012.5
– Percent of Open Interest Shorts:24.662.17.3
– Net Position:50,543-88,18937,646
– Gross Longs:230,248365,62890,978
– Gross Shorts:179,705453,81753,332
– Long to Short Ratio:1.3 to 10.8 to 11.7 to 1
NET POSITION TREND:
– Strength Index Score (3 Year Range Pct):50.551.036.7
– Strength Index Reading (3 Year Range):BullishBullishBearish
NET POSITION MOVEMENT INDEX:
– 6-Week Change in Strength Index:8.7-11.922.7


British Pound Sterling Futures:

British Pound Sterling Futures COT ChartThe British Pound Sterling large speculator standing this week recorded a net position of -70,810 contracts in the data reported through Tuesday. This was a weekly increase of 3,295 contracts from the previous week which had a total of -74,105 net contracts.

This week’s current strength score (the trader positioning range over the past three years, measured from 0 to 100) shows the speculators are currently Bearish with a score of 23.0 percent. The commercials are Bullish with a score of 77.3 percent and the small traders (not shown in chart) are Bearish with a score of 35.6 percent.

BRITISH POUND StatisticsSPECULATORSCOMMERCIALSSMALL TRADERS
– Percent of Open Interest Longs:13.474.18.4
– Percent of Open Interest Shorts:40.843.012.1
– Net Position:-70,81080,465-9,655
– Gross Longs:34,618191,74221,602
– Gross Shorts:105,428111,27731,257
– Long to Short Ratio:0.3 to 11.7 to 10.7 to 1
NET POSITION TREND:
– Strength Index Score (3 Year Range Pct):23.077.335.6
– Strength Index Reading (3 Year Range):BearishBullishBearish
NET POSITION MOVEMENT INDEX:
– 6-Week Change in Strength Index:-0.9-4.417.9


Japanese Yen Futures:

Japanese Yen Forex Futures COT ChartThe Japanese Yen large speculator standing this week recorded a net position of -91,646 contracts in the data reported through Tuesday. This was a weekly boost of 2,793 contracts from the previous week which had a total of -94,439 net contracts.

This week’s current strength score (the trader positioning range over the past three years, measured from 0 to 100) shows the speculators are currently Bearish-Extreme with a score of 12.4 percent. The commercials are Bullish-Extreme with a score of 88.9 percent and the small traders (not shown in chart) are Bearish-Extreme with a score of 18.0 percent.

JAPANESE YEN StatisticsSPECULATORSCOMMERCIALSSMALL TRADERS
– Percent of Open Interest Longs:6.979.38.7
– Percent of Open Interest Shorts:41.438.315.3
– Net Position:-91,646109,109-17,463
– Gross Longs:18,466210,88923,226
– Gross Shorts:110,112101,78040,689
– Long to Short Ratio:0.2 to 12.1 to 10.6 to 1
NET POSITION TREND:
– Strength Index Score (3 Year Range Pct):12.488.918.0
– Strength Index Reading (3 Year Range):Bearish-ExtremeBullish-ExtremeBearish-Extreme
NET POSITION MOVEMENT INDEX:
– 6-Week Change in Strength Index:2.4-2.83.9


Swiss Franc Futures:

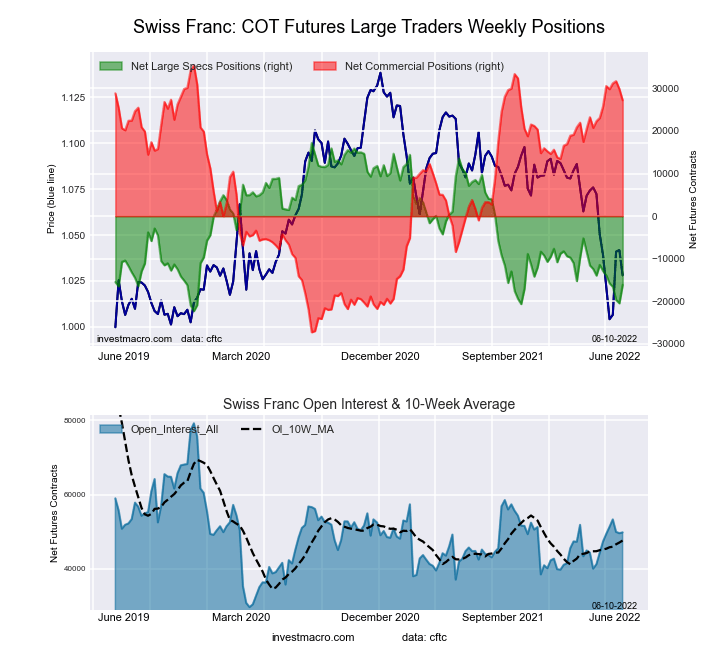
Swiss Franc Forex Futures COT ChartThe Swiss Franc large speculator standing this week recorded a net position of -16,132 contracts in the data reported through Tuesday. This was a weekly advance of 4,326 contracts from the previous week which had a total of -20,458 net contracts.

This week’s current strength score (the trader positioning range over the past three years, measured from 0 to 100) shows the speculators are currently Bearish-Extreme with a score of 15.6 percent. The commercials are Bullish-Extreme with a score of 86.9 percent and the small traders (not shown in chart) are Bearish with a score of 20.0 percent.

SWISS FRANC StatisticsSPECULATORSCOMMERCIALSSMALL TRADERS
– Percent of Open Interest Longs:5.269.318.8
– Percent of Open Interest Shorts:37.614.641.1
– Net Position:-16,13227,216-11,084
– Gross Longs:2,60934,4949,378
– Gross Shorts:18,7417,27820,462
– Long to Short Ratio:0.1 to 14.7 to 10.5 to 1
NET POSITION TREND:
– Strength Index Score (3 Year Range Pct):15.686.920.0
– Strength Index Reading (3 Year Range):Bearish-ExtremeBullish-ExtremeBearish
NET POSITION MOVEMENT INDEX:
– 6-Week Change in Strength Index:-8.32.46.0


Canadian Dollar Futures:

Canadian Dollar Forex Futures COT ChartThe Canadian Dollar large speculator standing this week recorded a net position of -1,062 contracts in the data reported through Tuesday. This was a weekly boost of 5,945 contracts from the previous week which had a total of -7,007 net contracts.

This week’s current strength score (the trader positioning range over the past three years, measured from 0 to 100) shows the speculators are currently Bearish with a score of 40.2 percent. The commercials are Bullish with a score of 57.6 percent and the small traders (not shown in chart) are Bullish with a score of 58.6 percent.

CANADIAN DOLLAR StatisticsSPECULATORSCOMMERCIALSSMALL TRADERS
– Percent of Open Interest Longs:23.544.222.4
– Percent of Open Interest Shorts:24.152.213.7
– Net Position:-1,062-13,40114,463
– Gross Longs:39,28874,04437,463
– Gross Shorts:40,35087,44523,000
– Long to Short Ratio:1.0 to 10.8 to 11.6 to 1
NET POSITION TREND:
– Strength Index Score (3 Year Range Pct):40.257.658.6
– Strength Index Reading (3 Year Range):BearishBullishBullish
NET POSITION MOVEMENT INDEX:
– 6-Week Change in Strength Index:-23.814.29.7


Australian Dollar Futures:

Australian Dollar Forex Futures COT ChartThe Australian Dollar large speculator standing this week recorded a net position of -47,896 contracts in the data reported through Tuesday. This was a weekly increase of 786 contracts from the previous week which had a total of -48,682 net contracts.

This week’s current strength score (the trader positioning range over the past three years, measured from 0 to 100) shows the speculators are currently Bearish with a score of 40.4 percent. The commercials are Bullish with a score of 54.3 percent and the small traders (not shown in chart) are Bullish with a score of 53.6 percent.

AUSTRALIAN DOLLAR StatisticsSPECULATORSCOMMERCIALSSMALL TRADERS
– Percent of Open Interest Longs:19.159.914.5
– Percent of Open Interest Shorts:47.831.414.2
– Net Position:-47,89647,413483
– Gross Longs:31,72099,74724,197
– Gross Shorts:79,61652,33423,714
– Long to Short Ratio:0.4 to 11.9 to 11.0 to 1
NET POSITION TREND:
– Strength Index Score (3 Year Range Pct):40.454.353.6
– Strength Index Reading (3 Year Range):BearishBullishBullish
NET POSITION MOVEMENT INDEX:
– 6-Week Change in Strength Index:-18.813.84.3


New Zealand Dollar Futures:

New Zealand Dollar Forex Futures COT ChartThe New Zealand Dollar large speculator standing this week recorded a net position of -19,771 contracts in the data reported through Tuesday. This was a weekly decline of -1,047 contracts from the previous week which had a total of -18,724 net contracts.

This week’s current strength score (the trader positioning range over the past three years, measured from 0 to 100) shows the speculators are currently Bearish with a score of 38.1 percent. The commercials are Bullish with a score of 65.4 percent and the small traders (not shown in chart) are Bearish-Extreme with a score of 18.5 percent.

NEW ZEALAND DOLLAR StatisticsSPECULATORSCOMMERCIALSSMALL TRADERS
– Percent of Open Interest Longs:19.469.14.0
– Percent of Open Interest Shorts:50.533.48.6
– Net Position:-19,77122,681-2,910
– Gross Longs:12,31043,8902,538
– Gross Shorts:32,08121,2095,448
– Long to Short Ratio:0.4 to 12.1 to 10.5 to 1
NET POSITION TREND:
– Strength Index Score (3 Year Range Pct):38.165.418.5
– Strength Index Reading (3 Year Range):BearishBullishBearish-Extreme
NET POSITION MOVEMENT INDEX:
– 6-Week Change in Strength Index:-33.331.2-4.3


Mexican Peso Futures:

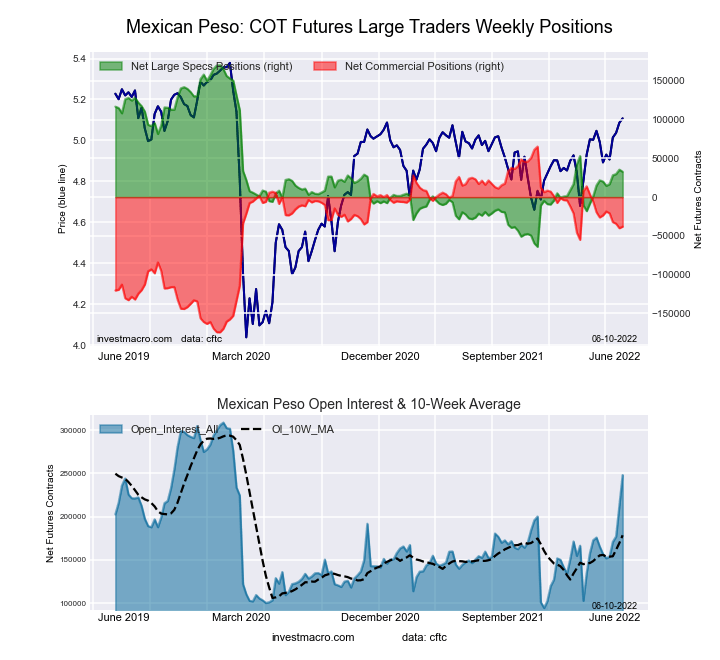
Mexican Peso Futures COT ChartThe Mexican Peso large speculator standing this week recorded a net position of 32,726 contracts in the data reported through Tuesday. This was a weekly decline of -2,723 contracts from the previous week which had a total of 35,449 net contracts.

This week’s current strength score (the trader positioning range over the past three years, measured from 0 to 100) shows the speculators are currently Bearish with a score of 41.3 percent. The commercials are Bullish with a score of 56.9 percent and the small traders (not shown in chart) are Bullish with a score of 65.9 percent.

MEXICAN PESO StatisticsSPECULATORSCOMMERCIALSSMALL TRADERS
– Percent of Open Interest Longs:48.035.43.4
– Percent of Open Interest Shorts:34.850.81.2
– Net Position:32,726-38,1175,391
– Gross Longs:119,16287,8848,441
– Gross Shorts:86,436126,0013,050
– Long to Short Ratio:1.4 to 10.7 to 12.8 to 1
NET POSITION TREND:
– Strength Index Score (3 Year Range Pct):41.356.965.9
– Strength Index Reading (3 Year Range):BearishBullishBullish
NET POSITION MOVEMENT INDEX:
– 6-Week Change in Strength Index:5.4-6.18.3


Brazilian Real Futures:

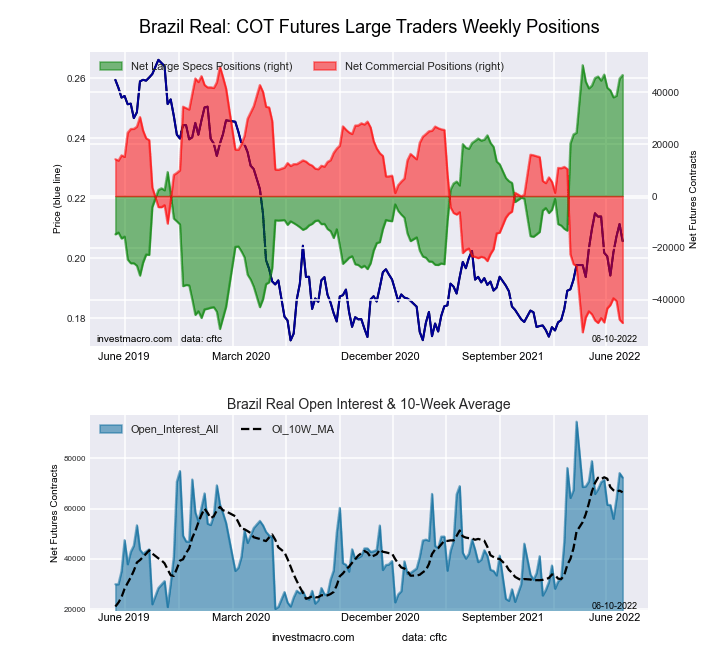
Brazil Real Futures COT ChartThe Brazilian Real large speculator standing this week recorded a net position of 46,705 contracts in the data reported through Tuesday. This was a weekly boost of 1,389 contracts from the previous week which had a total of 45,316 net contracts.

This week’s current strength score (the trader positioning range over the past three years, measured from 0 to 100) shows the speculators are currently Bullish-Extreme with a score of 96.3 percent. The commercials are Bearish-Extreme with a score of 3.5 percent and the small traders (not shown in chart) are Bullish-Extreme with a score of 91.1 percent.

BRAZIL REAL StatisticsSPECULATORSCOMMERCIALSSMALL TRADERS
– Percent of Open Interest Longs:81.113.55.4
– Percent of Open Interest Shorts:16.581.22.3
– Net Position:46,705-48,9542,249
– Gross Longs:58,6579,7803,931
– Gross Shorts:11,95258,7341,682
– Long to Short Ratio:4.9 to 10.2 to 12.3 to 1
NET POSITION TREND:
– Strength Index Score (3 Year Range Pct):96.33.591.1
– Strength Index Reading (3 Year Range):Bullish-ExtremeBearish-ExtremeBullish-Extreme
NET POSITION MOVEMENT INDEX:
– 6-Week Change in Strength Index:-0.2-0.24.4


Bitcoin Futures:

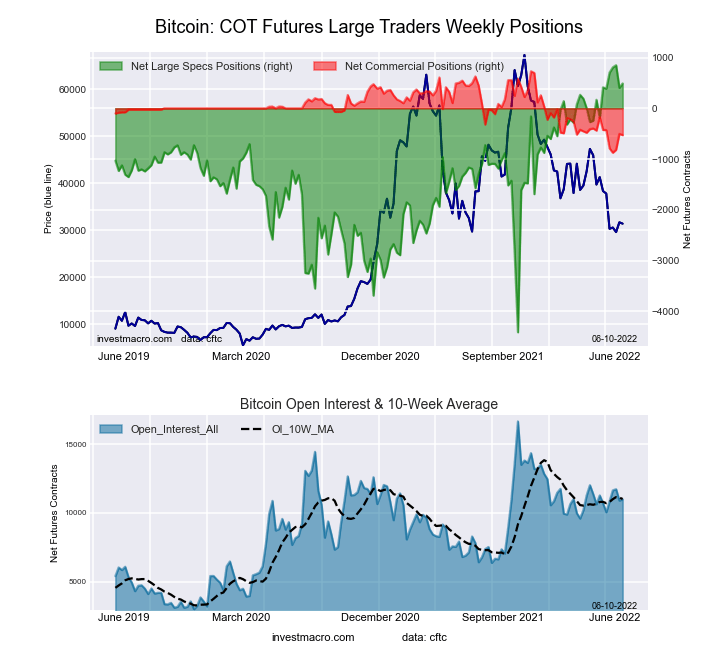
Bitcoin Crypto Futures COT ChartThe Bitcoin large speculator standing this week recorded a net position of 490 contracts in the data reported through Tuesday. This was a weekly lift of 87 contracts from the previous week which had a total of 403 net contracts.

This week’s current strength score (the trader positioning range over the past three years, measured from 0 to 100) shows the speculators are currently Bullish-Extreme with a score of 93.2 percent. The commercials are Bearish with a score of 21.6 percent and the small traders (not shown in chart) are Bearish-Extreme with a score of 13.8 percent.

BITCOIN StatisticsSPECULATORSCOMMERCIALSSMALL TRADERS
– Percent of Open Interest Longs:81.51.59.7
– Percent of Open Interest Shorts:77.16.49.3
– Net Position:490-52939
– Gross Longs:8,9591691,063
– Gross Shorts:8,4696981,024
– Long to Short Ratio:1.1 to 10.2 to 11.0 to 1
NET POSITION TREND:
– Strength Index Score (3 Year Range Pct):93.221.613.8
– Strength Index Reading (3 Year Range):Bullish-ExtremeBearishBearish-Extreme
NET POSITION MOVEMENT INDEX:
– 6-Week Change in Strength Index:1.5-6.40.6


Article By InvestMacroReceive our weekly COT Reports by Email

*COT Report: The COT data, released weekly to the public each Friday, is updated through the most recent Tuesday (data is 3 days old) and shows a quick view of how large speculators or non-commercials (for-profit traders) were positioned in the futures markets.

The CFTC categorizes trader positions according to commercial hedgers (traders who use futures contracts for hedging as part of the business), non-commercials (large traders who speculate to realize trading profits) and nonreportable traders (usually small traders/speculators) as well as their open interest (contracts open in the market at time of reporting).See CFTC criteria here.


COT Week 23 Charts: Precious Metals Speculator bets mostly higher lead by Copper & Platinum

By InvestMacro | COT | Data Tables | COT Leaders | Downloads | COT Newsletter

Here are the latest charts and statistics for the Commitment of Traders (COT) data published by the Commodities Futures Trading Commission (CFTC).

The latest COT data is updated through Tuesday June 7th and shows a quick view of how large traders (for-profit speculators and commercial entities) were positioned in the futures markets.

COT metals market speculator bets were mostly rising this week as five out of the six metals markets we cover had higher positioning this week while only one market had lower contracts.

Leading the gains for the precious metals markets was Copper (14,311 contracts) and Platinum (3,570 contracts) with Silver (3,407 contracts) and Gold (2,679 contracts) also showing a positive week. Meanwhile, the only market with declines in speculator bets this week was Palladium with a fall of -328 contracts.


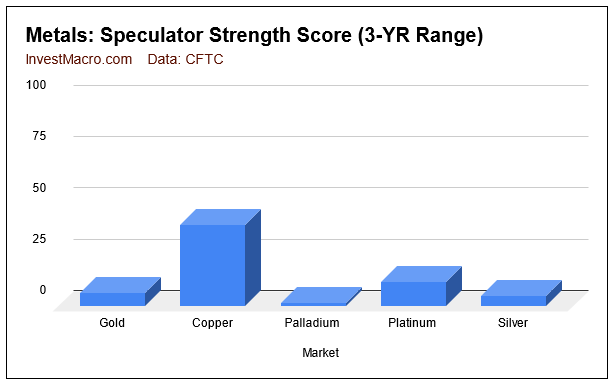
Strength scores (3-Year range of Speculator positions, from 0 to 100 where above 80 is extreme bullish and below 20 is extreme bearish) show that only Copper (39.7 percent) is not in an extreme-bearish position at the current time. Using the Strength Index as a contrarian signal, the metals markets could be at attractive levels depending on the fundamental and technical factors of each market.

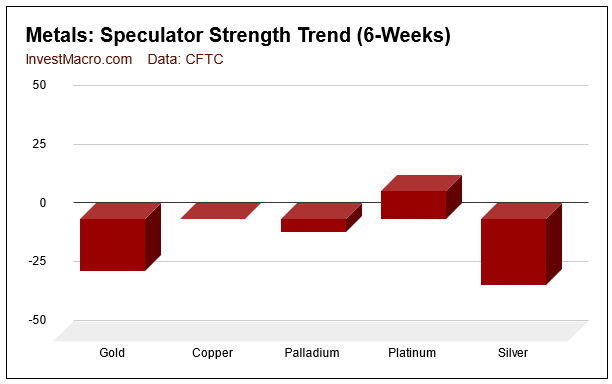
Strength score trends (or move index, that calculate 6-week changes in strength scores) shows that only Platinum has been trending higher over the past six weeks. On the downside, Silver and the Gold have shown the largest downward trends.


Data Snapshot of Commodity Market Traders | Columns Legend
Jun-07-2022OIOI-IndexSpec-NetSpec-IndexCom-NetCOM-IndexSmalls-NetSmalls-Index
WTI Crude1,790,61810328,2568-369,0339340,77772
Gold494,13012175,2687-199,8869524,61818
Silver148,2941517,4045-27,9909410,58610
Copper194,18722-3,71440879602,83542
Palladium7,0353-3,46123,58197-12037
Platinum65,295315,93312-9,742923,80915
Natural Gas1,127,73110-114,3424466,4195247,92393
Brent169,80216-36,0985134,208501,89035
Heating Oil261,651204,88650-24,4284519,54266
Soybeans760,44435176,64468-148,39039-28,25423
Corn1,557,16731391,26480-337,13724-54,12712
Coffee222,5831548,76781-51,363232,59616
Sugar849,81412195,40377-234,4962439,09356
Wheat333,7051223,88150-19,86331-4,01890


Gold Comex Futures:

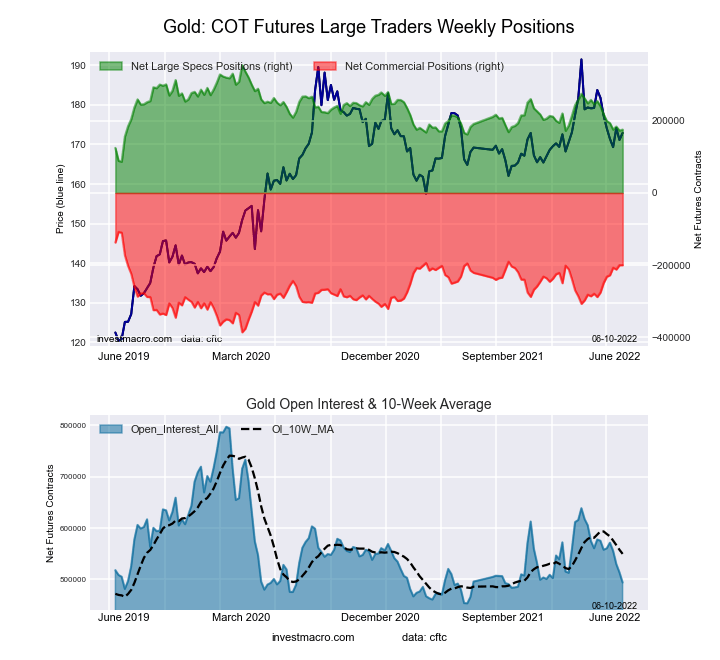
Gold Futures COT ChartThe Gold Comex Futures large speculator standing this week recorded a net position of 175,268 contracts in the data reported through Tuesday. This was a weekly increase of 2,679 contracts from the previous week which had a total of 172,589 net contracts.

This week’s current strength score (the trader positioning range over the past three years, measured from 0 to 100) shows the speculators are currently Bearish-Extreme with a score of 6.8 percent. The commercials are Bullish-Extreme with a score of 95.0 percent and the small traders (not shown in chart) are Bearish-Extreme with a score of 18.0 percent.

Gold Futures StatisticsSPECULATORSCOMMERCIALSSMALL TRADERS
– Percent of Open Interest Longs:54.723.78.9
– Percent of Open Interest Shorts:19.264.13.9
– Net Position:175,268-199,88624,618
– Gross Longs:270,356116,96544,090
– Gross Shorts:95,088316,85119,472
– Long to Short Ratio:2.8 to 10.4 to 12.3 to 1
NET POSITION TREND:
– Strength Index Score (3 Year Range Pct):6.895.018.0
– Strength Index Reading (3 Year Range):Bearish-ExtremeBullish-ExtremeBearish-Extreme
NET POSITION MOVEMENT INDEX:
– 6-Week Change in Strength Index:-22.325.3-23.5


Silver Comex Futures:

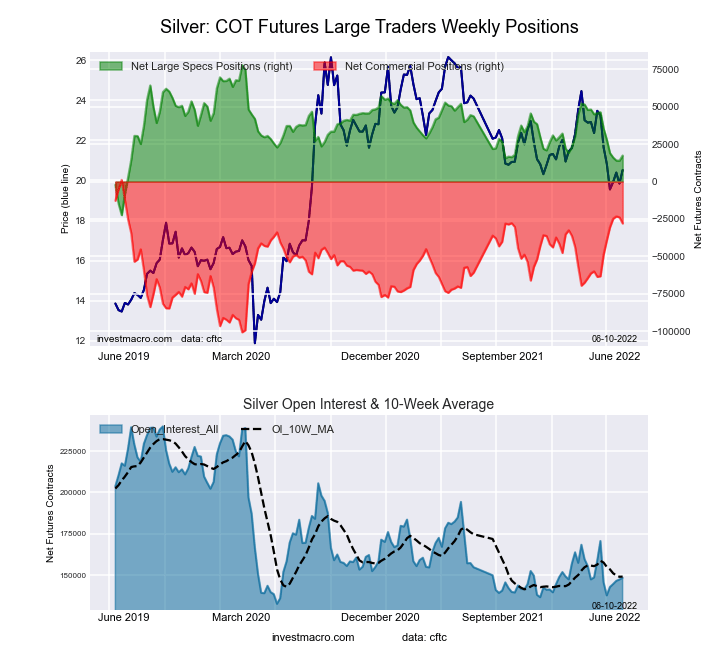
Silver Futures COT ChartThe Silver Comex Futures large speculator standing this week recorded a net position of 17,404 contracts in the data reported through Tuesday. This was a weekly rise of 3,407 contracts from the previous week which had a total of 13,997 net contracts.

This week’s current strength score (the trader positioning range over the past three years, measured from 0 to 100) shows the speculators are currently Bearish-Extreme with a score of 5.3 percent. The commercials are Bullish-Extreme with a score of 93.9 percent and the small traders (not shown in chart) are Bearish-Extreme with a score of 10.2 percent.

Silver Futures StatisticsSPECULATORSCOMMERCIALSSMALL TRADERS
– Percent of Open Interest Longs:37.036.916.9
– Percent of Open Interest Shorts:25.355.89.8
– Net Position:17,404-27,99010,586
– Gross Longs:54,89954,70725,089
– Gross Shorts:37,49582,69714,503
– Long to Short Ratio:1.5 to 10.7 to 11.7 to 1
NET POSITION TREND:
– Strength Index Score (3 Year Range Pct):5.393.910.2
– Strength Index Reading (3 Year Range):Bearish-ExtremeBullish-ExtremeBearish-Extreme
NET POSITION MOVEMENT INDEX:
– 6-Week Change in Strength Index:-28.226.8-15.3


Copper Grade #1 Futures:

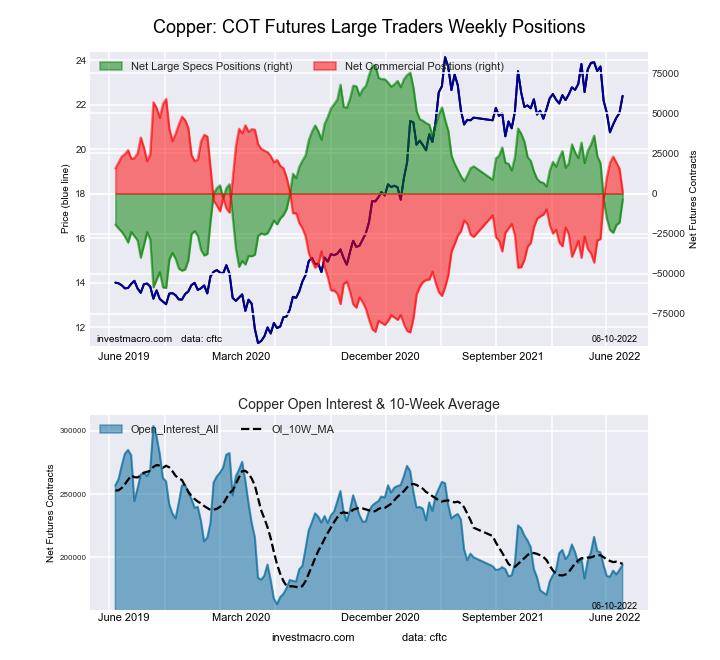
Copper Futures COT ChartThe Copper Grade #1 Futures large speculator standing this week recorded a net position of -3,714 contracts in the data reported through Tuesday. This was a weekly rise of 14,311 contracts from the previous week which had a total of -18,025 net contracts.

This week’s current strength score (the trader positioning range over the past three years, measured from 0 to 100) shows the speculators are currently Bearish with a score of 39.7 percent. The commercials are Bullish with a score of 60.1 percent and the small traders (not shown in chart) are Bearish with a score of 41.7 percent.

Copper Futures StatisticsSPECULATORSCOMMERCIALSSMALL TRADERS
– Percent of Open Interest Longs:30.051.78.6
– Percent of Open Interest Shorts:31.951.37.1
– Net Position:-3,7148792,835
– Gross Longs:58,232100,44916,646
– Gross Shorts:61,94699,57013,811
– Long to Short Ratio:0.9 to 11.0 to 11.2 to 1
NET POSITION TREND:
– Strength Index Score (3 Year Range Pct):39.760.141.7
– Strength Index Reading (3 Year Range):BearishBullishBearish
NET POSITION MOVEMENT INDEX:
– 6-Week Change in Strength Index:0.12.8-23.7


Platinum Futures:

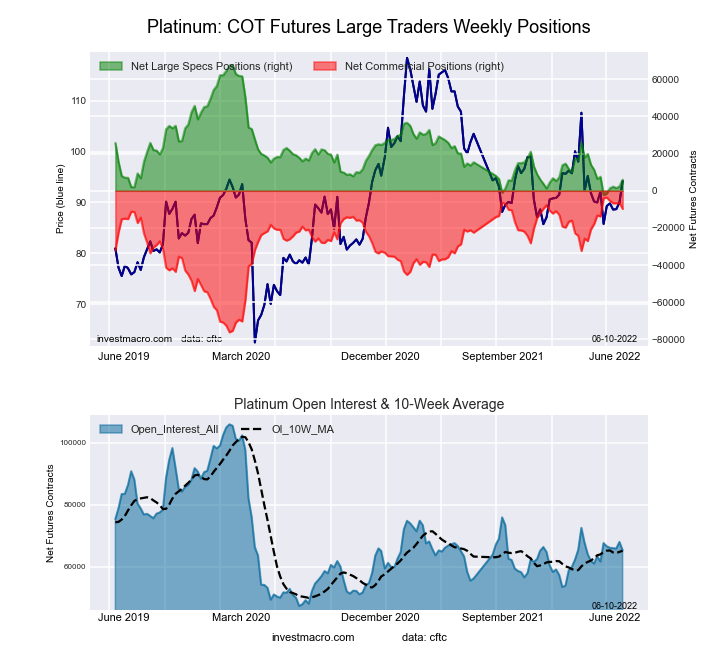
Platinum Futures COT ChartThe Platinum Futures large speculator standing this week recorded a net position of 5,933 contracts in the data reported through Tuesday. This was a weekly advance of 3,570 contracts from the previous week which had a total of 2,363 net contracts.

This week’s current strength score (the trader positioning range over the past three years, measured from 0 to 100) shows the speculators are currently Bearish-Extreme with a score of 11.9 percent. The commercials are Bullish-Extreme with a score of 91.6 percent and the small traders (not shown in chart) are Bearish-Extreme with a score of 15.1 percent.

Platinum Futures StatisticsSPECULATORSCOMMERCIALSSMALL TRADERS
– Percent of Open Interest Longs:41.441.111.5
– Percent of Open Interest Shorts:32.356.05.6
– Net Position:5,933-9,7423,809
– Gross Longs:27,00426,8237,479
– Gross Shorts:21,07136,5653,670
– Long to Short Ratio:1.3 to 10.7 to 12.0 to 1
NET POSITION TREND:
– Strength Index Score (3 Year Range Pct):11.991.615.1
– Strength Index Reading (3 Year Range):Bearish-ExtremeBullish-ExtremeBearish-Extreme
NET POSITION MOVEMENT INDEX:
– 6-Week Change in Strength Index:11.9-7.9-35.4


Palladium Futures:

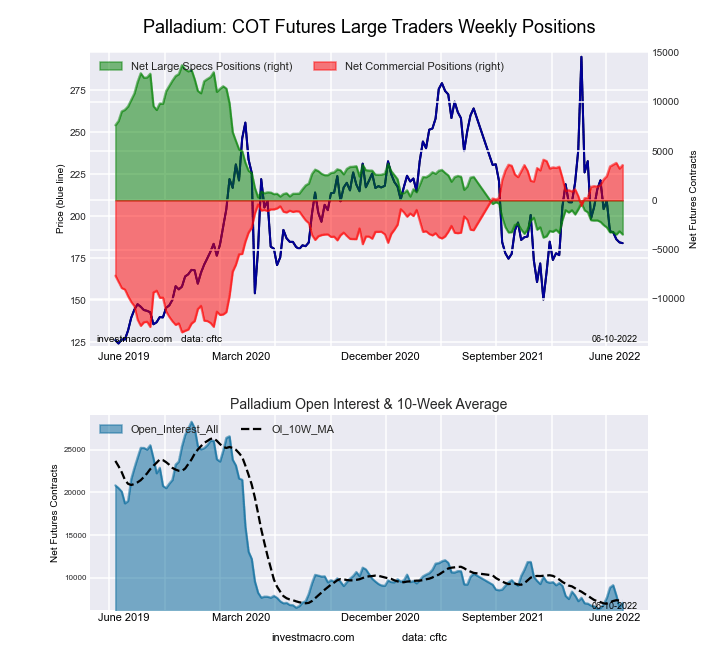
Palladium Futures COT ChartThe Palladium Futures large speculator standing this week recorded a net position of -3,461 contracts in the data reported through Tuesday. This was a weekly decline of -328 contracts from the previous week which had a total of -3,133 net contracts.

This week’s current strength score (the trader positioning range over the past three years, measured from 0 to 100) shows the speculators are currently Bearish-Extreme with a score of 1.8 percent. The commercials are Bullish-Extreme with a score of 96.9 percent and the small traders (not shown in chart) are Bearish with a score of 36.9 percent.

Palladium Futures StatisticsSPECULATORSCOMMERCIALSSMALL TRADERS
– Percent of Open Interest Longs:13.470.915.2
– Percent of Open Interest Shorts:62.620.016.9
– Net Position:-3,4613,581-120
– Gross Longs:9434,9851,072
– Gross Shorts:4,4041,4041,192
– Long to Short Ratio:0.2 to 13.6 to 10.9 to 1
NET POSITION TREND:
– Strength Index Score (3 Year Range Pct):1.896.936.9
– Strength Index Reading (3 Year Range):Bearish-ExtremeBullish-ExtremeBearish
NET POSITION MOVEMENT INDEX:
– 6-Week Change in Strength Index:-5.58.3-29.3


Article By InvestMacroReceive our weekly COT Reports by Email

*COT Report: The COT data, released weekly to the public each Friday, is updated through the most recent Tuesday (data is 3 days old) and shows a quick view of how large speculators or non-commercials (for-profit traders) were positioned in the futures markets.

The CFTC categorizes trader positions according to commercial hedgers (traders who use futures contracts for hedging as part of the business), non-commercials (large traders who speculate to realize trading profits) and nonreportable traders (usually small traders/speculators) as well as their open interest (contracts open in the market at time of reporting).See CFTC criteria here.
COT Week 23 Charts: Bond Speculator bets mostly falling this week led by 2-Year & 10-Year Bonds

By InvestMacro | COT | Data Tables | COT Leaders | Downloads | COT Newsletter

Here are the latest charts and statistics for the Commitment of Traders (COT) data published by the Commodities Futures Trading Commission (CFTC).

The latest COT data is updated through Tuesday June 7th and shows a quick view of how large traders (for-profit speculators and commercial entities) were positioned in the futures markets.

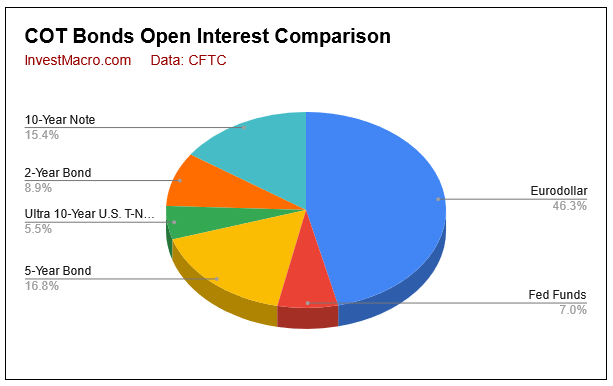
Bond market speculator bets were mostly on the lower side this week as only three out of the eight bond markets we cover had higher positioning this week while five markets had lower contracts.

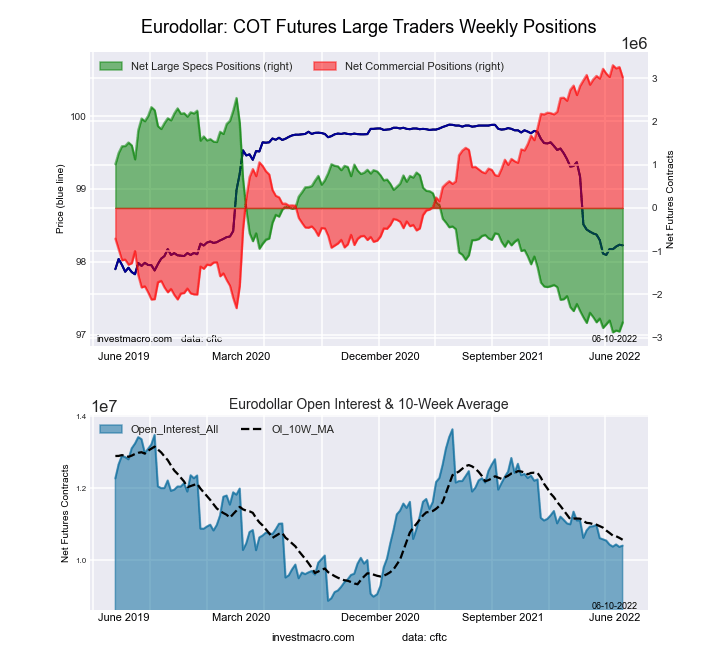
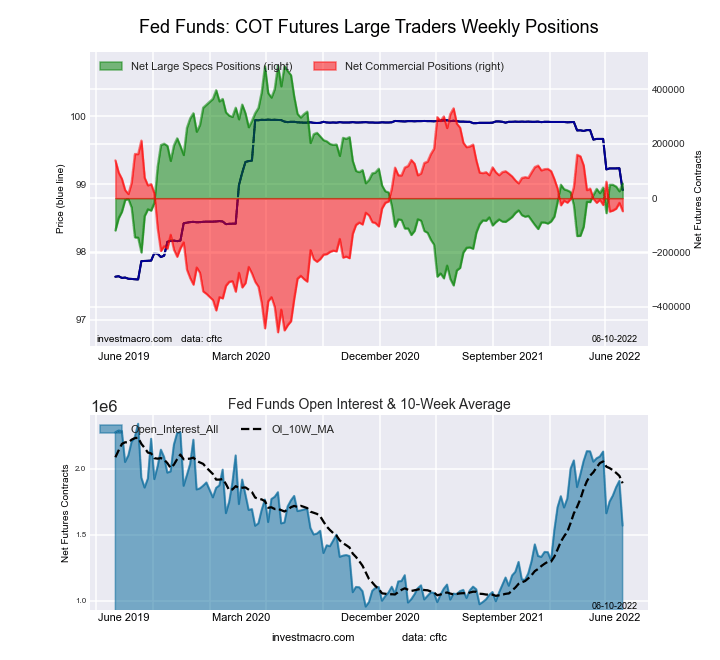
Leading the gains for the COT bonds markets was the Eurodollar (208,714 contracts) and the Fed Funds (29,026 contracts) with the Ultra 10-Year Bond (29,533 contracts) also showing a positive week.

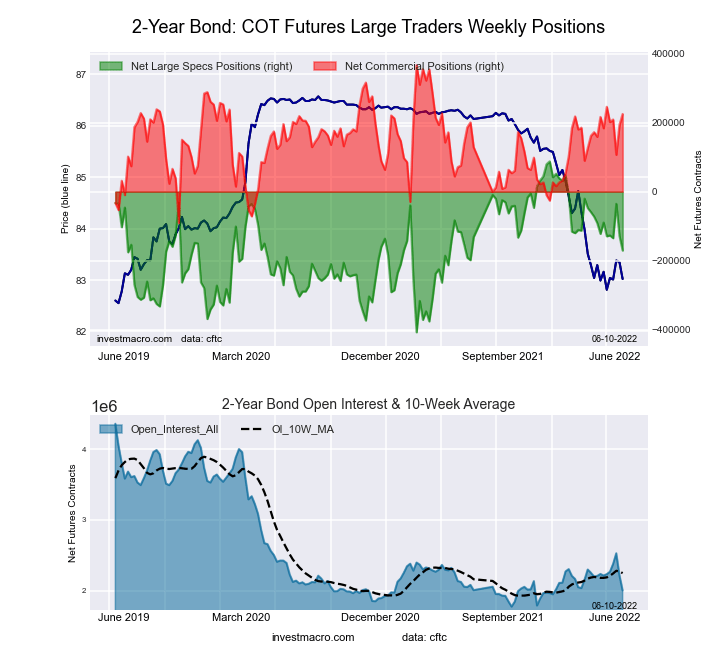
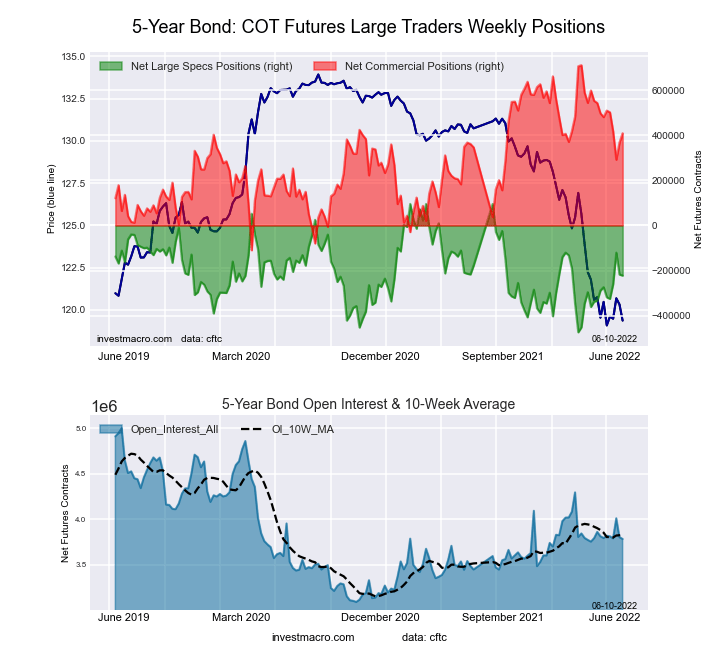
Meanwhile, leading the declines in speculator bets this week were the 2-Year Bond (-42,371 contracts) and the 10-Year Bond (-27,280 contracts) with the Long US Bond (-14,798 contracts), Ultra US Bond (-5,695 contracts) and the 5-Year Bond (-4,759 contracts) also registering lower bets on the week.


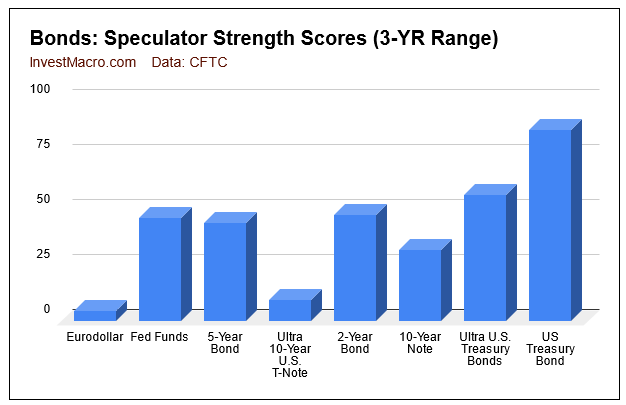
Strength scores (3-Year range of Speculator positions, from 0 to 100 where above 80 is extreme bullish and below 20 is extreme bearish) show that the Ultra US Treasury Bond and the US Treasury Bond are above their midpoint levels for the past 3 years while all the other markets are below the 50 percent level. The US Treasury Bond is actually in an extreme-bullish level currently while the Eurodollar and the Ultra 10-Year Note are both in extreme-bearish levels at the moment.

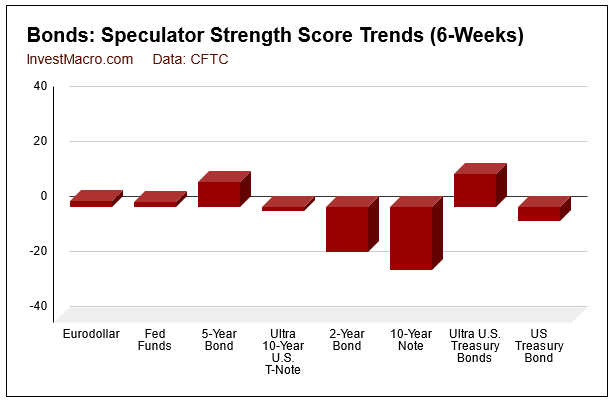
Strength score trends (or move index, that calculate the 6-week changes in strength scores) shows that the 5-Year Bond and the Ultra US Treasury Bond have had the highest rising scores over the past six weeks. On the downside, the 10-Year Bond and the 2-Year Bond have shown the largest downward trends.


Data Snapshot of Bond Market Traders | Columns Legend
Jun-07-2022OIOI-IndexSpec-NetSpec-IndexCom-NetCOM-IndexSmalls-NetSmalls-Index
Eurodollar10,409,83432-2,646,50243,023,49095-376,98821
FedFunds1,568,8234454,23346-47,93254-6,30144
2-Year2,002,13410-170,48948225,04069-54,55126
Long T-Bond1,193,131484,96386-5,6331867053
10-Year3,469,94828-266,18732426,52473-160,33742
5-Year3,784,73239-222,54744409,46363-186,91630


3-Month Eurodollars Futures:

Eurodollar Bonds Futures COT ChartThe 3-Month Eurodollars large speculator standing this week reached a net position of -2,646,502 contracts in the data reported through Tuesday. This was a weekly gain of 208,714 contracts from the previous week which had a total of -2,855,216 net contracts.

This week’s current strength score (the trader positioning range over the past three years, measured from 0 to 100) shows the speculators are currently Bearish-Extreme with a score of 4.2 percent. The commercials are Bullish-Extreme with a score of 95.1 percent and the small traders (not shown in chart) are Bearish with a score of 21.5 percent.

3-Month Eurodollars StatisticsSPECULATORSCOMMERCIALSSMALL TRADERS
– Percent of Open Interest Longs:3.574.13.7
– Percent of Open Interest Shorts:29.045.07.4
– Net Position:-2,646,5023,023,490-376,988
– Gross Longs:367,4767,712,618389,949
– Gross Shorts:3,013,9784,689,128766,937
– Long to Short Ratio:0.1 to 11.6 to 10.5 to 1
NET POSITION TREND:
– Strength Index Score (3 Year Range Pct):4.295.121.5
– Strength Index Reading (3 Year Range):Bearish-ExtremeBullish-ExtremeBearish
NET POSITION MOVEMENT INDEX:
– 6-Week Change in Strength Index:2.3-3.514.9


30-Day Federal Funds Futures:

Federal Funds 30-Day Bonds Futures COT ChartThe 30-Day Federal Funds large speculator standing this week reached a net position of 54,233 contracts in the data reported through Tuesday. This was a weekly boost of 29,026 contracts from the previous week which had a total of 25,207 net contracts.

This week’s current strength score (the trader positioning range over the past three years, measured from 0 to 100) shows the speculators are currently Bearish with a score of 46.3 percent. The commercials are Bullish with a score of 54.1 percent and the small traders (not shown in chart) are Bearish with a score of 43.7 percent.

30-Day Federal Funds StatisticsSPECULATORSCOMMERCIALSSMALL TRADERS
– Percent of Open Interest Longs:9.674.52.6
– Percent of Open Interest Shorts:6.177.53.0
– Net Position:54,233-47,932-6,301
– Gross Longs:149,8531,168,08940,470
– Gross Shorts:95,6201,216,02146,771
– Long to Short Ratio:1.6 to 11.0 to 10.9 to 1
NET POSITION TREND:
– Strength Index Score (3 Year Range Pct):46.354.143.7
– Strength Index Reading (3 Year Range):BearishBullishBearish
NET POSITION MOVEMENT INDEX:
– 6-Week Change in Strength Index:1.9-2.819.2


2-Year Treasury Note Futures:

2-Year Treasury Bonds Futures COT ChartThe 2-Year Treasury Note large speculator standing this week reached a net position of -170,489 contracts in the data reported through Tuesday. This was a weekly decrease of -42,371 contracts from the previous week which had a total of -128,118 net contracts.

This week’s current strength score (the trader positioning range over the past three years, measured from 0 to 100) shows the speculators are currently Bearish with a score of 47.8 percent. The commercials are Bullish with a score of 69.1 percent and the small traders (not shown in chart) are Bearish with a score of 25.8 percent.

2-Year Treasury Note StatisticsSPECULATORSCOMMERCIALSSMALL TRADERS
– Percent of Open Interest Longs:10.079.87.2
– Percent of Open Interest Shorts:18.568.69.9
– Net Position:-170,489225,040-54,551
– Gross Longs:200,3071,598,627143,536
– Gross Shorts:370,7961,373,587198,087
– Long to Short Ratio:0.5 to 11.2 to 10.7 to 1
NET POSITION TREND:
– Strength Index Score (3 Year Range Pct):47.869.125.8
– Strength Index Reading (3 Year Range):BearishBullishBearish
NET POSITION MOVEMENT INDEX:
– 6-Week Change in Strength Index:-16.49.016.5


5-Year Treasury Note Futures:

5-Year Treasury Bonds Futures COT ChartThe 5-Year Treasury Note large speculator standing this week reached a net position of -222,547 contracts in the data reported through Tuesday. This was a weekly decrease of -4,759 contracts from the previous week which had a total of -217,788 net contracts.

This week’s current strength score (the trader positioning range over the past three years, measured from 0 to 100) shows the speculators are currently Bearish with a score of 44.2 percent. The commercials are Bullish with a score of 63.2 percent and the small traders (not shown in chart) are Bearish with a score of 29.7 percent.

5-Year Treasury Note StatisticsSPECULATORSCOMMERCIALSSMALL TRADERS
– Percent of Open Interest Longs:9.580.97.5
– Percent of Open Interest Shorts:15.470.112.4
– Net Position:-222,547409,463-186,916
– Gross Longs:359,7153,061,190283,380
– Gross Shorts:582,2622,651,727470,296
– Long to Short Ratio:0.6 to 11.2 to 10.6 to 1
NET POSITION TREND:
– Strength Index Score (3 Year Range Pct):44.263.229.7
– Strength Index Reading (3 Year Range):BearishBullishBearish
NET POSITION MOVEMENT INDEX:
– 6-Week Change in Strength Index:9.1-8.75.5


10-Year Treasury Note Futures:

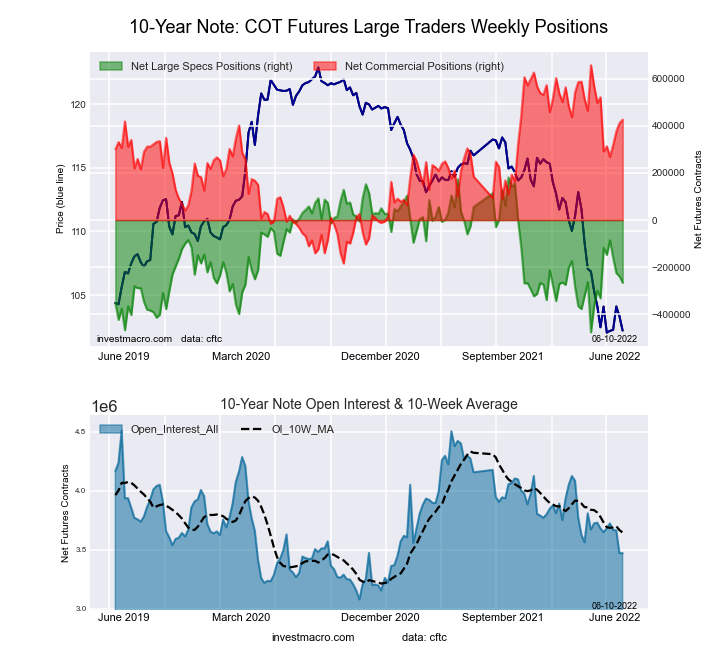
10-Year Treasury Notes Bonds Futures COT ChartThe 10-Year Treasury Note large speculator standing this week reached a net position of -266,187 contracts in the data reported through Tuesday. This was a weekly lowering of -27,280 contracts from the previous week which had a total of -238,907 net contracts.

This week’s current strength score (the trader positioning range over the past three years, measured from 0 to 100) shows the speculators are currently Bearish with a score of 32.0 percent. The commercials are Bullish with a score of 72.6 percent and the small traders (not shown in chart) are Bearish with a score of 41.7 percent.

10-Year Treasury Note StatisticsSPECULATORSCOMMERCIALSSMALL TRADERS
– Percent of Open Interest Longs:5.681.08.9
– Percent of Open Interest Shorts:13.368.713.5
– Net Position:-266,187426,524-160,337
– Gross Longs:195,1202,810,360307,456
– Gross Shorts:461,3072,383,836467,793
– Long to Short Ratio:0.4 to 11.2 to 10.7 to 1
NET POSITION TREND:
– Strength Index Score (3 Year Range Pct):32.072.641.7
– Strength Index Reading (3 Year Range):BearishBullishBearish
NET POSITION MOVEMENT INDEX:
– 6-Week Change in Strength Index:-22.616.13.1


Ultra 10-Year Notes Futures:

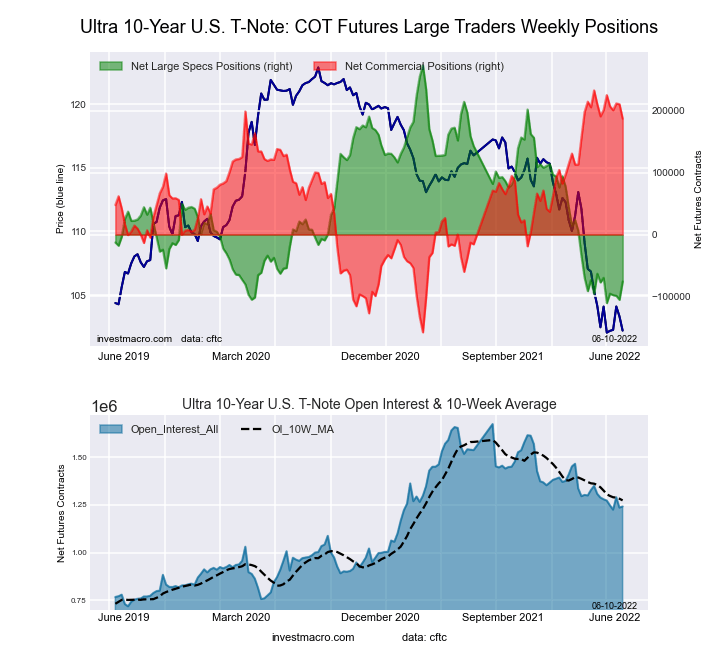
Ultra 10-Year Treasury Notes Bonds Futures COT ChartThe Ultra 10-Year Notes large speculator standing this week reached a net position of -75,834 contracts in the data reported through Tuesday. This was a weekly advance of 29,533 contracts from the previous week which had a total of -105,367 net contracts.

This week’s current strength score (the trader positioning range over the past three years, measured from 0 to 100) shows the speculators are currently Bearish-Extreme with a score of 9.1 percent. The commercials are Bullish-Extreme with a score of 88.3 percent and the small traders (not shown in chart) are Bearish with a score of 48.9 percent.

Ultra 10-Year Notes StatisticsSPECULATORSCOMMERCIALSSMALL TRADERS
– Percent of Open Interest Longs:5.581.811.1
– Percent of Open Interest Shorts:11.666.720.0
– Net Position:-75,834187,134-111,300
– Gross Longs:67,8841,015,640137,608
– Gross Shorts:143,718828,506248,908
– Long to Short Ratio:0.5 to 11.2 to 10.6 to 1
NET POSITION TREND:
– Strength Index Score (3 Year Range Pct):9.188.348.9
– Strength Index Reading (3 Year Range):Bearish-ExtremeBullish-ExtremeBearish
NET POSITION MOVEMENT INDEX:
– 6-Week Change in Strength Index:-1.5-3.612.2


US Treasury Bonds Futures:

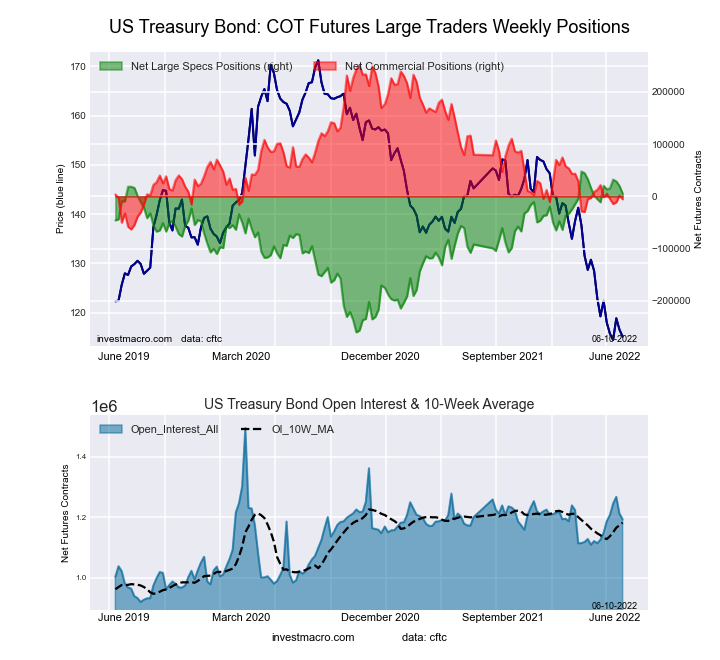
US Year Treasury Notes Long Bonds Futures COT ChartThe US Treasury Bonds large speculator standing this week reached a net position of 4,963 contracts in the data reported through Tuesday. This was a weekly lowering of -14,798 contracts from the previous week which had a total of 19,761 net contracts.

This week’s current strength score (the trader positioning range over the past three years, measured from 0 to 100) shows the speculators are currently Bullish-Extreme with a score of 86.2 percent. The commercials are Bearish-Extreme with a score of 18.3 percent and the small traders (not shown in chart) are Bullish with a score of 53.1 percent.

US Treasury Bonds StatisticsSPECULATORSCOMMERCIALSSMALL TRADERS
– Percent of Open Interest Longs:9.574.814.1
– Percent of Open Interest Shorts:9.075.214.0
– Net Position:4,963-5,633670
– Gross Longs:112,838892,073168,164
– Gross Shorts:107,875897,706167,494
– Long to Short Ratio:1.0 to 11.0 to 11.0 to 1
NET POSITION TREND:
– Strength Index Score (3 Year Range Pct):86.218.353.1
– Strength Index Reading (3 Year Range):Bullish-ExtremeBearish-ExtremeBullish
NET POSITION MOVEMENT INDEX:
– 6-Week Change in Strength Index:-4.9-1.215.1


Ultra US Treasury Bonds Futures:

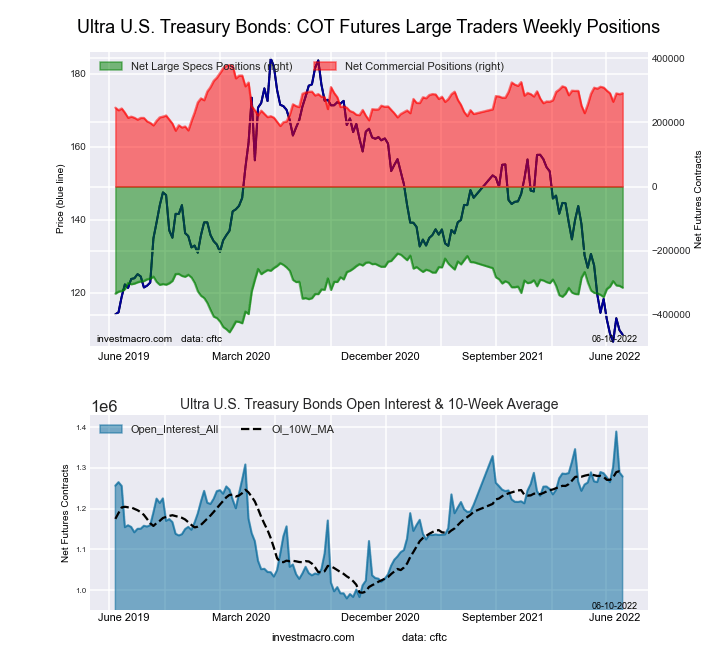
Ultra US Year Treasury Notes Long Bonds Futures COT ChartThe Ultra US Treasury Bonds large speculator standing this week reached a net position of -314,973 contracts in the data reported through Tuesday. This was a weekly decrease of -5,695 contracts from the previous week which had a total of -309,278 net contracts.

This week’s current strength score (the trader positioning range over the past three years, measured from 0 to 100) shows the speculators are currently Bullish with a score of 56.7 percent. The commercials are Bullish with a score of 57.2 percent and the small traders (not shown in chart) are Bearish with a score of 45.6 percent.

Ultra US Treasury Bonds StatisticsSPECULATORSCOMMERCIALSSMALL TRADERS
– Percent of Open Interest Longs:3.483.511.7
– Percent of Open Interest Shorts:28.060.79.8
– Net Position:-314,973290,77124,202
– Gross Longs:42,9571,067,607149,154
– Gross Shorts:357,930776,836124,952
– Long to Short Ratio:0.1 to 11.4 to 11.2 to 1
NET POSITION TREND:
– Strength Index Score (3 Year Range Pct):56.757.245.6
– Strength Index Reading (3 Year Range):BullishBullishBearish
NET POSITION MOVEMENT INDEX:
– 6-Week Change in Strength Index:11.9-8.7-8.2


Article By InvestMacroReceive our weekly COT Reports by Email

*COT Report: The COT data, released weekly to the public each Friday, is updated through the most recent Tuesday (data is 3 days old) and shows a quick view of how large speculators or non-commercials (for-profit traders) were positioned in the futures markets.

The CFTC categorizes trader positions according to commercial hedgers (traders who use futures contracts for hedging as part of the business), non-commercials (large traders who speculate to realize trading profits) and nonreportable traders (usually small traders/speculators) as well as their open interest (contracts open in the market at time of reporting).See CFTC criteria here.

COT Week 23 Charts: Soft Commodities Speculators Positions mostly higher led by Soybean Meal & Live Cattle

By InvestMacro | COT | Data Tables | COT Leaders | Downloads | COT Newsletter

Here are the latest charts and statistics for the Commitment of Traders (COT) data published by the Commodities Futures Trading Commission (CFTC).

The latest COT data is updated through Tuesday June 7th and shows a quick view of how large traders (for-profit speculators and commercial entities) were positioned in the futures markets.

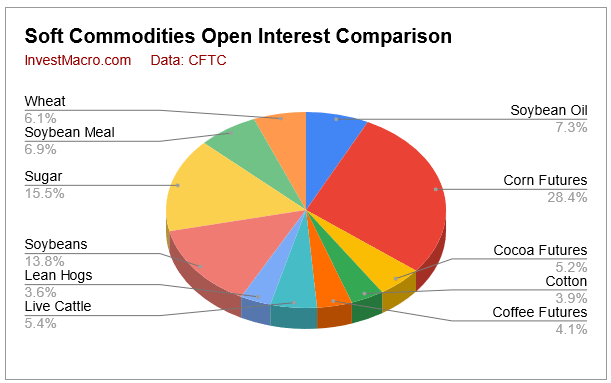
The soft commodities market speculator bets were mostly higher this week as seven out of the eleven soft commodities markets we cover had higher positioning this week while four markets had lower contracts.

Leading the gains for soft commodities markets was Soybean Meal (8,922 contracts) and Live Cattle (5,888 contracts) with Coffee (5,752 contracts), Cocoa (4,341 contracts), Soybean Oil (3,604 contracts), Wheat (1,572 contracts) and Lean Hogs (1,274 contracts) also showing a positive weeks.

Meanwhile, leading the declines in speculator bets this week were Corn (-12,936 contracts) and Soybeans (-9,434 contracts) with Sugar (-6,277 contracts) and Cotton (-2 contracts) also registering lower bets on the week.


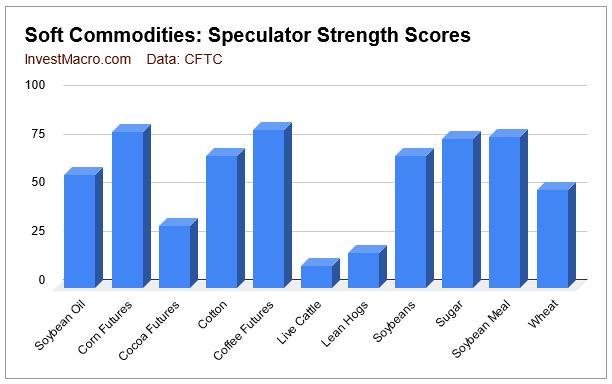
Strength scores (3-Year range of Speculator positions, from 0 to 100 where above 80 is extreme bullish and below 20 is extreme bearish) show that Corn and Coffee are in extreme-bullish levels currently. On the opposite position, Live Cattle and Lean Hogs hold extreme-bearish levels while most of the other markets are in strong bullish positions between 50 percent and 80 percent.

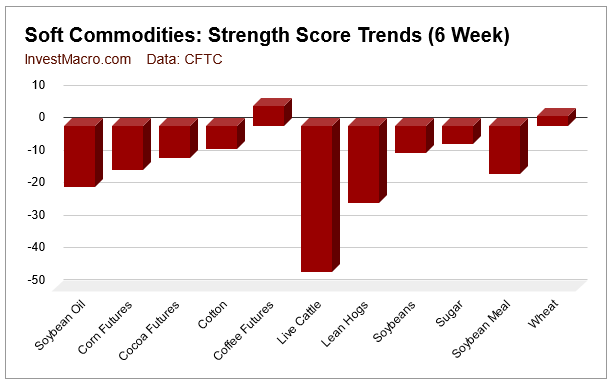
Strength score trends (or move index, that show 6-week changes in strength scores) shows that despite the strong strength scores in the blue chart previously, the trends have been cooling off mightily. This chart shows that only Coffee and Wheat have had rising scores over the past six weeks. Live Cattle and Lean Hogs have had strong declines in the trends over the past six weeks followed by Soybean Meal, Soybean Oil and Corn.


Data Snapshot of Commodity Market Traders | Columns Legend
Jun-07-2022OIOI-IndexSpec-NetSpec-IndexCom-NetCOM-IndexSmalls-NetSmalls-Index
WTI Crude1,790,61810328,2568-369,0339340,77772
Gold494,13012175,2687-199,8869524,61818
Silver148,2941517,4045-27,9909410,58610
Copper194,18722-3,71440879602,83542
Palladium7,0353-3,46123,58197-12037
Platinum65,295315,93312-9,742923,80915
Natural Gas1,127,73110-114,3424466,4195247,92393
Brent169,80216-36,0985134,208501,89035
Heating Oil261,651204,88650-24,4284519,54266
Soybeans760,44435176,64468-148,39039-28,25423
Corn1,557,16731391,26480-337,13724-54,12712
Coffee222,5831548,76781-51,363232,59616
Sugar849,81412195,40377-234,4962439,09356
Wheat333,7051223,88150-19,86331-4,01890


CORN Futures:

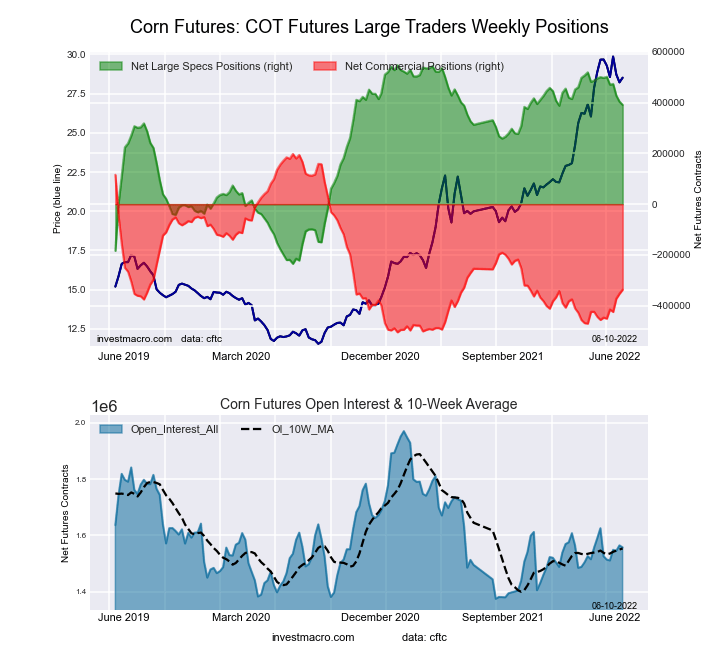
CORN Futures COT ChartThe CORN large speculator standing this week equaled a net position of 391,264 contracts in the data reported through Tuesday. This was a weekly reduction of -12,936 contracts from the previous week which had a total of 404,200 net contracts.

This week’s current strength score (the trader positioning range over the past three years, measured from 0 to 100) shows the speculators are currently Bullish-Extreme with a score of 80.0 percent. The commercials are Bearish with a score of 23.9 percent and the small traders (not shown in chart) are Bearish-Extreme with a score of 11.9 percent.

CORN Futures StatisticsSPECULATORSCOMMERCIALSSMALL TRADERS
– Percent of Open Interest Longs:33.443.28.8
– Percent of Open Interest Shorts:8.364.912.3
– Net Position:391,264-337,137-54,127
– Gross Longs:520,783673,039137,311
– Gross Shorts:129,5191,010,176191,438
– Long to Short Ratio:4.0 to 10.7 to 10.7 to 1
NET POSITION TREND:
– Strength Index Score (3 Year Range Pct):80.023.911.9
– Strength Index Reading (3 Year Range):Bullish-ExtremeBearishBearish-Extreme
NET POSITION MOVEMENT INDEX:
– 6-Week Change in Strength Index:-13.615.7-2.2


SUGAR Futures:

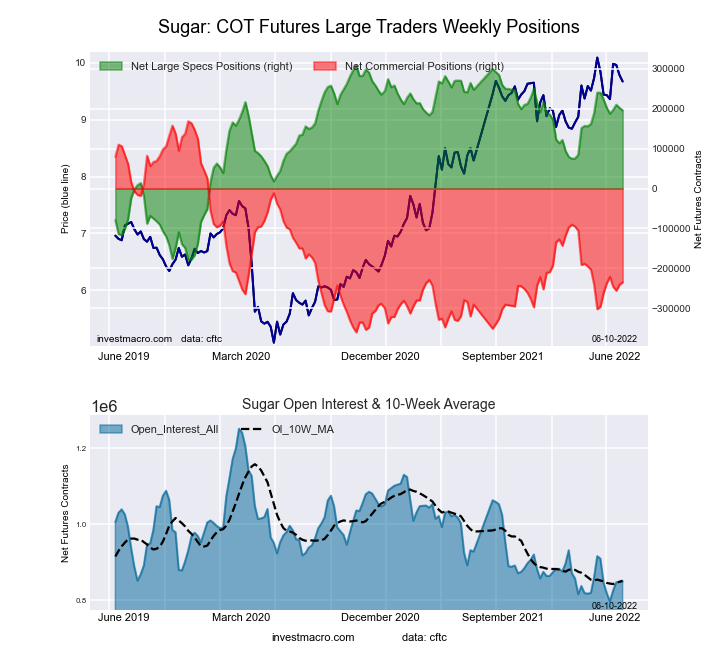
SUGAR Futures COT ChartThe SUGAR large speculator standing this week equaled a net position of 195,403 contracts in the data reported through Tuesday. This was a weekly decline of -6,277 contracts from the previous week which had a total of 201,680 net contracts.

This week’s current strength score (the trader positioning range over the past three years, measured from 0 to 100) shows the speculators are currently Bullish with a score of 76.8 percent. The commercials are Bearish with a score of 23.7 percent and the small traders (not shown in chart) are Bullish with a score of 56.2 percent.

SUGAR Futures StatisticsSPECULATORSCOMMERCIALSSMALL TRADERS
– Percent of Open Interest Longs:29.745.110.6
– Percent of Open Interest Shorts:6.772.76.0
– Net Position:195,403-234,49639,093
– Gross Longs:252,688383,13890,314
– Gross Shorts:57,285617,63451,221
– Long to Short Ratio:4.4 to 10.6 to 11.8 to 1
NET POSITION TREND:
– Strength Index Score (3 Year Range Pct):76.823.756.2
– Strength Index Reading (3 Year Range):BullishBearishBullish
NET POSITION MOVEMENT INDEX:
– 6-Week Change in Strength Index:-5.65.00.8


COFFEE Futures:

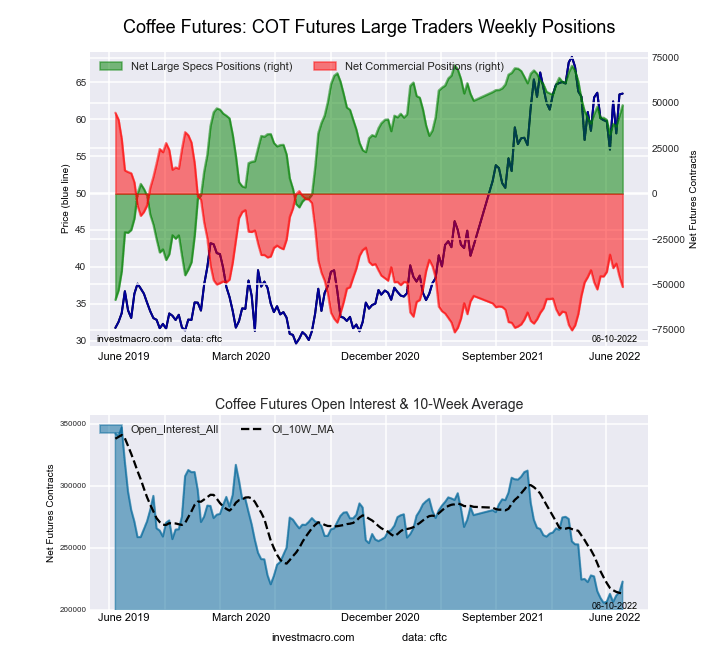
COFFEE Futures COT ChartThe COFFEE large speculator standing this week equaled a net position of 48,767 contracts in the data reported through Tuesday. This was a weekly boost of 5,752 contracts from the previous week which had a total of 43,015 net contracts.

This week’s current strength score (the trader positioning range over the past three years, measured from 0 to 100) shows the speculators are currently Bullish-Extreme with a score of 81.0 percent. The commercials are Bearish with a score of 22.6 percent and the small traders (not shown in chart) are Bearish-Extreme with a score of 16.0 percent.

COFFEE Futures StatisticsSPECULATORSCOMMERCIALSSMALL TRADERS
– Percent of Open Interest Longs:25.848.74.1
– Percent of Open Interest Shorts:3.971.83.0
– Net Position:48,767-51,3632,596
– Gross Longs:57,417108,3439,164
– Gross Shorts:8,650159,7066,568
– Long to Short Ratio:6.6 to 10.7 to 11.4 to 1
NET POSITION TREND:
– Strength Index Score (3 Year Range Pct):81.022.616.0
– Strength Index Reading (3 Year Range):Bullish-ExtremeBearishBearish-Extreme
NET POSITION MOVEMENT INDEX:
– 6-Week Change in Strength Index:6.0-5.3-11.4


SOYBEANS Futures:

SOYBEANS Futures COT ChartThe SOYBEANS large speculator standing this week equaled a net position of 176,644 contracts in the data reported through Tuesday. This was a weekly reduction of -9,434 contracts from the previous week which had a total of 186,078 net contracts.

This week’s current strength score (the trader positioning range over the past three years, measured from 0 to 100) shows the speculators are currently Bullish with a score of 67.9 percent. The commercials are Bearish with a score of 39.2 percent and the small traders (not shown in chart) are Bearish with a score of 23.3 percent.

SOYBEANS Futures StatisticsSPECULATORSCOMMERCIALSSMALL TRADERS
– Percent of Open Interest Longs:30.247.36.5
– Percent of Open Interest Shorts:7.066.810.2
– Net Position:176,644-148,390-28,254
– Gross Longs:229,895359,58749,303
– Gross Shorts:53,251507,97777,557
– Long to Short Ratio:4.3 to 10.7 to 10.6 to 1
NET POSITION TREND:
– Strength Index Score (3 Year Range Pct):67.939.223.3
– Strength Index Reading (3 Year Range):BullishBearishBearish
NET POSITION MOVEMENT INDEX:
– 6-Week Change in Strength Index:-8.38.8-3.8


SOYBEAN OIL Futures:

SOYBEAN OIL Futures COT ChartThe SOYBEAN OIL large speculator standing this week equaled a net position of 78,645 contracts in the data reported through Tuesday. This was a weekly advance of 3,604 contracts from the previous week which had a total of 75,041 net contracts.

This week’s current strength score (the trader positioning range over the past three years, measured from 0 to 100) shows the speculators are currently Bullish with a score of 58.3 percent. The commercials are Bearish with a score of 38.5 percent and the small traders (not shown in chart) are Bullish with a score of 75.4 percent.

SOYBEAN OIL Futures StatisticsSPECULATORSCOMMERCIALSSMALL TRADERS
– Percent of Open Interest Longs:26.948.29.2
– Percent of Open Interest Shorts:7.272.15.0
– Net Position:78,645-95,25816,613
– Gross Longs:107,372192,49336,684
– Gross Shorts:28,727287,75120,071
– Long to Short Ratio:3.7 to 10.7 to 11.8 to 1
NET POSITION TREND:
– Strength Index Score (3 Year Range Pct):58.338.575.4
– Strength Index Reading (3 Year Range):BullishBearishBullish
NET POSITION MOVEMENT INDEX:
– 6-Week Change in Strength Index:-18.917.2-1.2


SOYBEAN MEAL Futures:

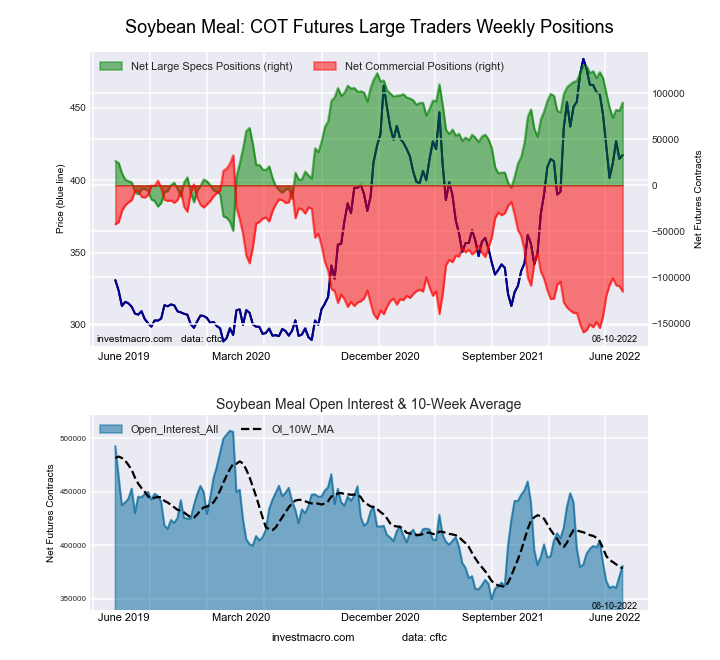
SOYBEAN MEAL Futures COT ChartThe SOYBEAN MEAL large speculator standing this week equaled a net position of 89,676 contracts in the data reported through Tuesday. This was a weekly advance of 8,922 contracts from the previous week which had a total of 80,754 net contracts.

This week’s current strength score (the trader positioning range over the past three years, measured from 0 to 100) shows the speculators are currently Bullish with a score of 77.4 percent. The commercials are Bearish with a score of 23.0 percent and the small traders (not shown in chart) are Bullish with a score of 65.9 percent.

SOYBEAN MEAL Futures StatisticsSPECULATORSCOMMERCIALSSMALL TRADERS
– Percent of Open Interest Longs:28.343.912.2
– Percent of Open Interest Shorts:4.874.25.5
– Net Position:89,676-115,26125,585
– Gross Longs:107,791167,30646,628
– Gross Shorts:18,115282,56721,043
– Long to Short Ratio:6.0 to 10.6 to 12.2 to 1
NET POSITION TREND:
– Strength Index Score (3 Year Range Pct):77.423.065.9
– Strength Index Reading (3 Year Range):BullishBearishBullish
NET POSITION MOVEMENT INDEX:
– 6-Week Change in Strength Index:-14.814.0-1.2


LIVE CATTLE Futures:

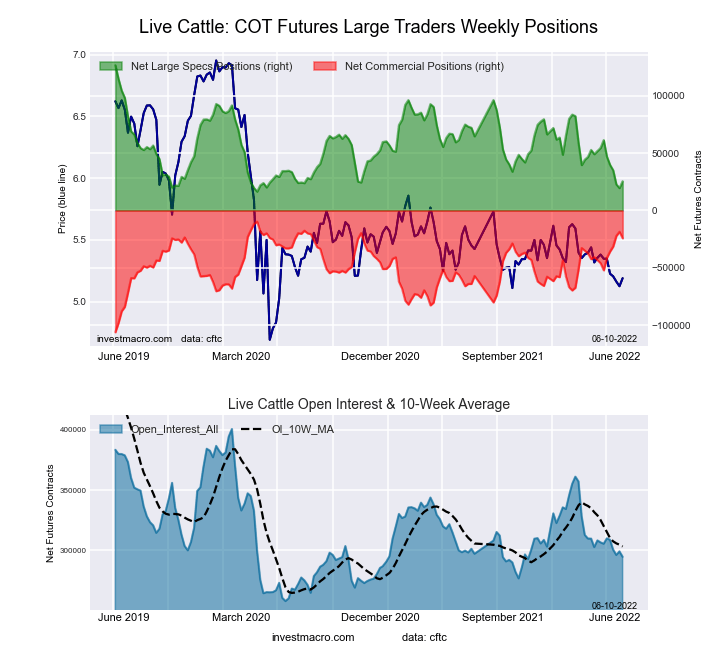
LIVE CATTLE Futures COT ChartThe LIVE CATTLE large speculator standing this week equaled a net position of 25,428 contracts in the data reported through Tuesday. This was a weekly increase of 5,888 contracts from the previous week which had a total of 19,540 net contracts.

This week’s current strength score (the trader positioning range over the past three years, measured from 0 to 100) shows the speculators are currently Bearish-Extreme with a score of 11.3 percent. The commercials are Bullish-Extreme with a score of 80.2 percent and the small traders (not shown in chart) are Bullish with a score of 77.6 percent.

LIVE CATTLE Futures StatisticsSPECULATORSCOMMERCIALSSMALL TRADERS
– Percent of Open Interest Longs:35.540.511.5
– Percent of Open Interest Shorts:26.948.711.9
– Net Position:25,428-24,212-1,216
– Gross Longs:104,585119,32433,798
– Gross Shorts:79,157143,53635,014
– Long to Short Ratio:1.3 to 10.8 to 11.0 to 1
NET POSITION TREND:
– Strength Index Score (3 Year Range Pct):11.380.277.6
– Strength Index Reading (3 Year Range):Bearish-ExtremeBullish-ExtremeBullish
NET POSITION MOVEMENT INDEX:
– 6-Week Change in Strength Index:-45.038.327.7


LEAN HOGS Futures:

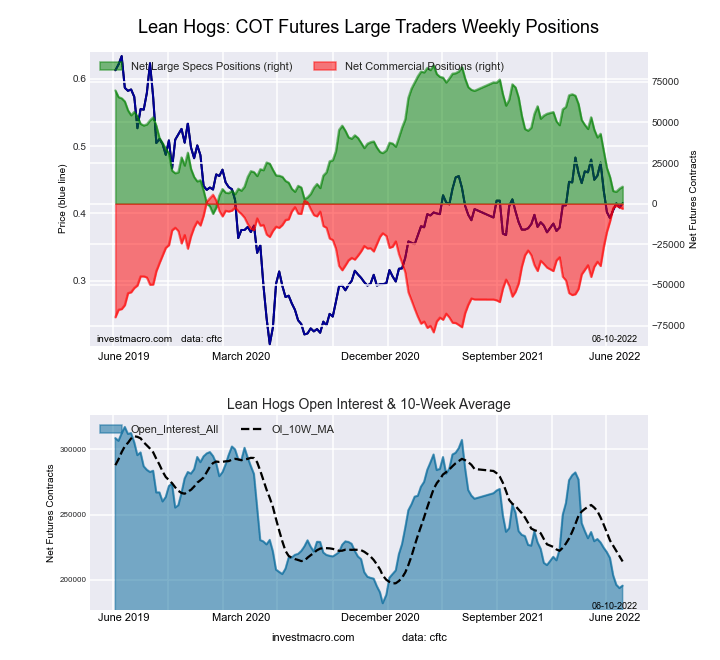
LEAN HOGS Futures COT ChartThe LEAN HOGS large speculator standing this week equaled a net position of 10,491 contracts in the data reported through Tuesday. This was a weekly gain of 1,274 contracts from the previous week which had a total of 9,217 net contracts.

This week’s current strength score (the trader positioning range over the past three years, measured from 0 to 100) shows the speculators are currently Bearish-Extreme with a score of 18.2 percent. The commercials are Bullish-Extreme with a score of 89.8 percent and the small traders (not shown in chart) are Bullish with a score of 58.1 percent.

LEAN HOGS Futures StatisticsSPECULATORSCOMMERCIALSSMALL TRADERS
– Percent of Open Interest Longs:30.341.79.9
– Percent of Open Interest Shorts:24.943.313.6
– Net Position:10,491-3,090-7,401
– Gross Longs:59,20781,58319,271
– Gross Shorts:48,71684,67326,672
– Long to Short Ratio:1.2 to 11.0 to 10.7 to 1
NET POSITION TREND:
– Strength Index Score (3 Year Range Pct):18.289.858.1
– Strength Index Reading (3 Year Range):Bearish-ExtremeBullish-ExtremeBullish
NET POSITION MOVEMENT INDEX:
– 6-Week Change in Strength Index:-23.827.8-8.7


COTTON Futures:

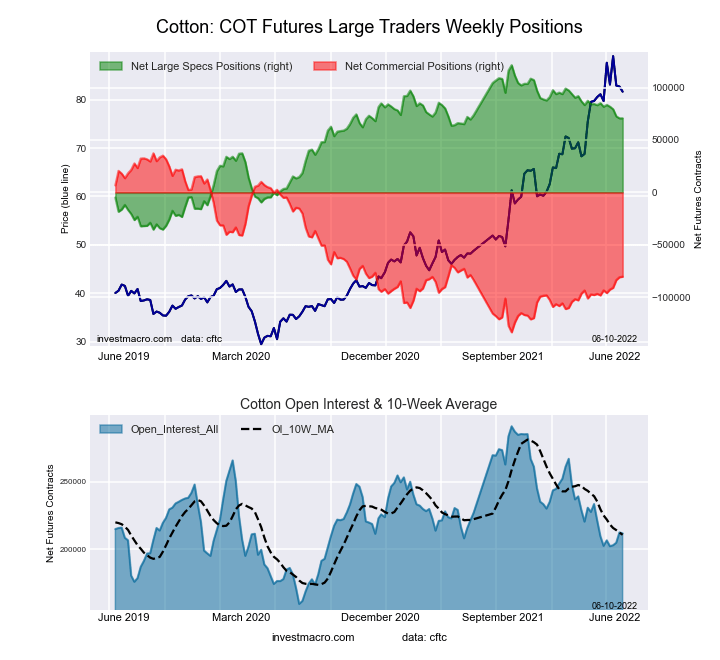
COTTON Futures COT ChartThe COTTON large speculator standing this week equaled a net position of 70,682 contracts in the data reported through Tuesday. This was a weekly decline of -2 contracts from the previous week which had a total of 70,684 net contracts.

This week’s current strength score (the trader positioning range over the past three years, measured from 0 to 100) shows the speculators are currently Bullish with a score of 67.7 percent. The commercials are Bearish with a score of 31.0 percent and the small traders (not shown in chart) are Bullish with a score of 73.4 percent.

COTTON Futures StatisticsSPECULATORSCOMMERCIALSSMALL TRADERS
– Percent of Open Interest Longs:40.937.78.2
– Percent of Open Interest Shorts:7.575.73.6
– Net Position:70,682-80,3479,665
– Gross Longs:86,60979,71817,332
– Gross Shorts:15,927160,0657,667
– Long to Short Ratio:5.4 to 10.5 to 12.3 to 1
NET POSITION TREND:
– Strength Index Score (3 Year Range Pct):67.731.073.4
– Strength Index Reading (3 Year Range):BullishBearishBullish
NET POSITION MOVEMENT INDEX:
– 6-Week Change in Strength Index:-7.17.6-12.1


COCOA Futures:

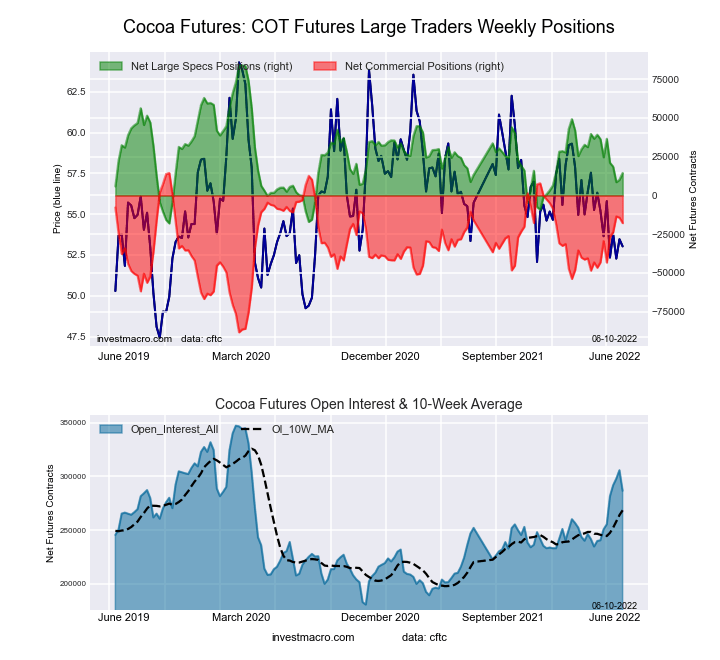
COCOA Futures COT ChartThe COCOA large speculator standing this week equaled a net position of 14,494 contracts in the data reported through Tuesday. This was a weekly lift of 4,341 contracts from the previous week which had a total of 10,153 net contracts.

This week’s current strength score (the trader positioning range over the past three years, measured from 0 to 100) shows the speculators are currently Bearish with a score of 31.8 percent. The commercials are Bullish with a score of 68.6 percent and the small traders (not shown in chart) are Bearish with a score of 29.8 percent.

COCOA Futures StatisticsSPECULATORSCOMMERCIALSSMALL TRADERS
– Percent of Open Interest Longs:31.443.95.2
– Percent of Open Interest Shorts:26.350.14.0
– Net Position:14,494-17,8233,329
– Gross Longs:89,997125,90514,861
– Gross Shorts:75,503143,72811,532
– Long to Short Ratio:1.2 to 10.9 to 11.3 to 1
NET POSITION TREND:
– Strength Index Score (3 Year Range Pct):31.868.629.8
– Strength Index Reading (3 Year Range):BearishBullishBearish
NET POSITION MOVEMENT INDEX:
– 6-Week Change in Strength Index:-10.011.3-14.6


WHEAT Futures:

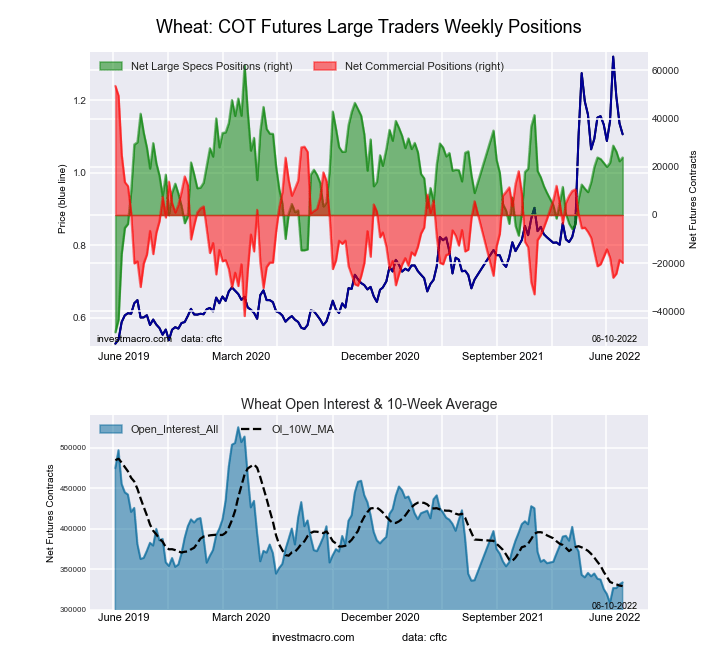
WHEAT Futures COT ChartThe WHEAT large speculator standing this week equaled a net position of 23,881 contracts in the data reported through Tuesday. This was a weekly advance of 1,572 contracts from the previous week which had a total of 22,309 net contracts.

This week’s current strength score (the trader positioning range over the past three years, measured from 0 to 100) shows the speculators are currently Bullish with a score of 50.1 percent. The commercials are Bearish with a score of 31.4 percent and the small traders (not shown in chart) are Bullish-Extreme with a score of 89.6 percent.

WHEAT Futures StatisticsSPECULATORSCOMMERCIALSSMALL TRADERS
– Percent of Open Interest Longs:32.934.810.4
– Percent of Open Interest Shorts:25.740.811.6
– Net Position:23,881-19,863-4,018
– Gross Longs:109,678116,14634,706
– Gross Shorts:85,797136,00938,724
– Long to Short Ratio:1.3 to 10.9 to 10.9 to 1
NET POSITION TREND:
– Strength Index Score (3 Year Range Pct):50.131.489.6
– Strength Index Reading (3 Year Range):BullishBearishBullish-Extreme
NET POSITION MOVEMENT INDEX:
– 6-Week Change in Strength Index:2.9-3.51.2


Article By InvestMacroReceive our weekly COT Reports by Email

*COT Report: The COT data, released weekly to the public each Friday, is updated through the most recent Tuesday (data is 3 days old) and shows a quick view of how large speculators or non-commercials (for-profit traders) were positioned in the futures markets.

The CFTC categorizes trader positions according to commercial hedgers (traders who use futures contracts for hedging as part of the business), non-commercials (large traders who speculate to realize trading profits) and nonreportable traders (usually small traders/speculators) as well as their open interest (contracts open in the market at time of reporting).See CFTC criteria here.

COT Week 23 Charts: Energy Speculator Positions Mixed led by Brent Crude & Heating Oil

By InvestMacro | COT | Data Tables | COT Leaders | Downloads | COT Newsletter

Here are the latest charts and statistics for the Commitment of Traders (COT) data published by the Commodities Futures Trading Commission (CFTC).

The latest COT data is updated through Tuesday June 7th and shows a quick view of how large traders (for-profit speculators and commercial entities) were positioned in the futures markets.

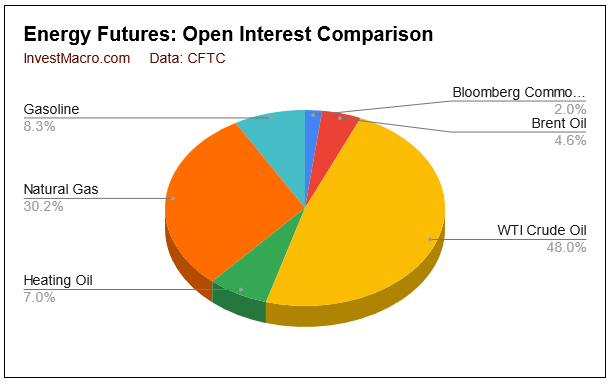
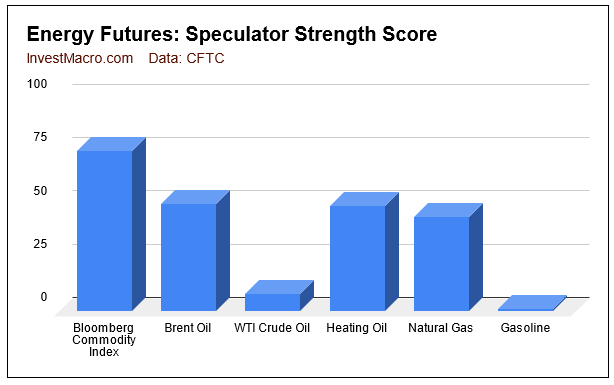
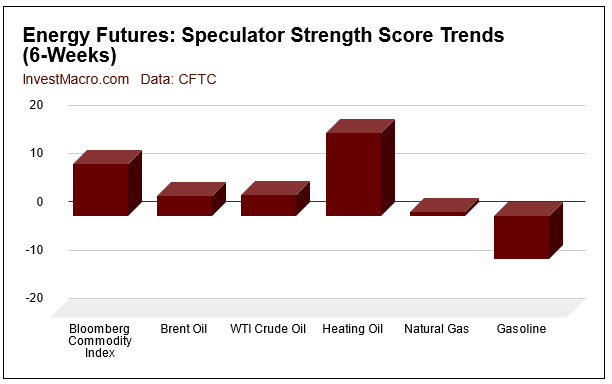
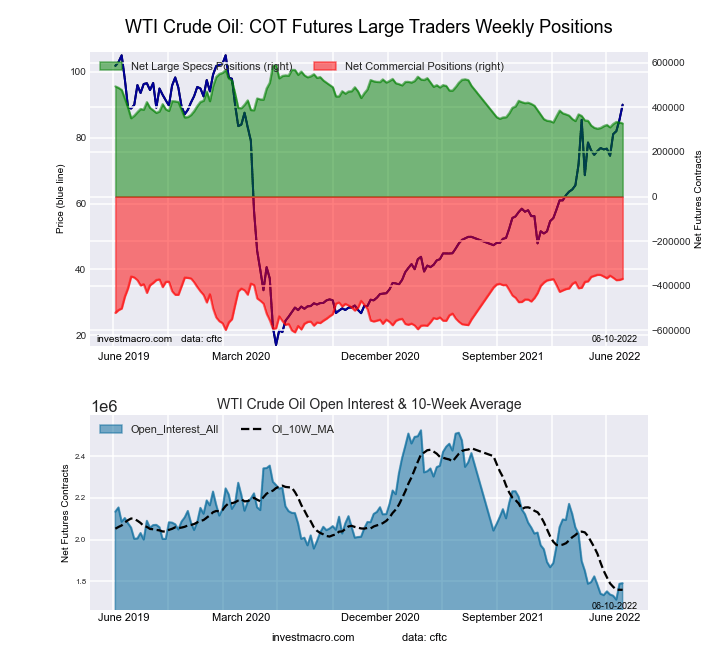
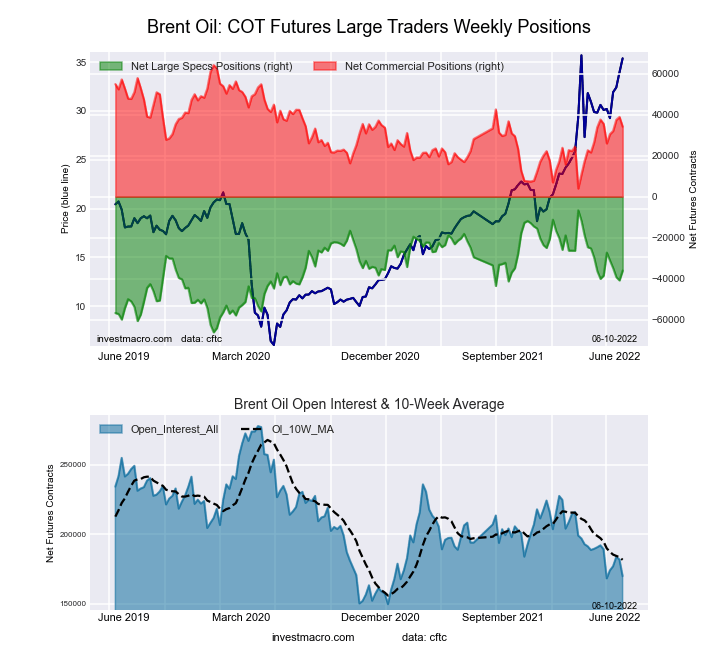
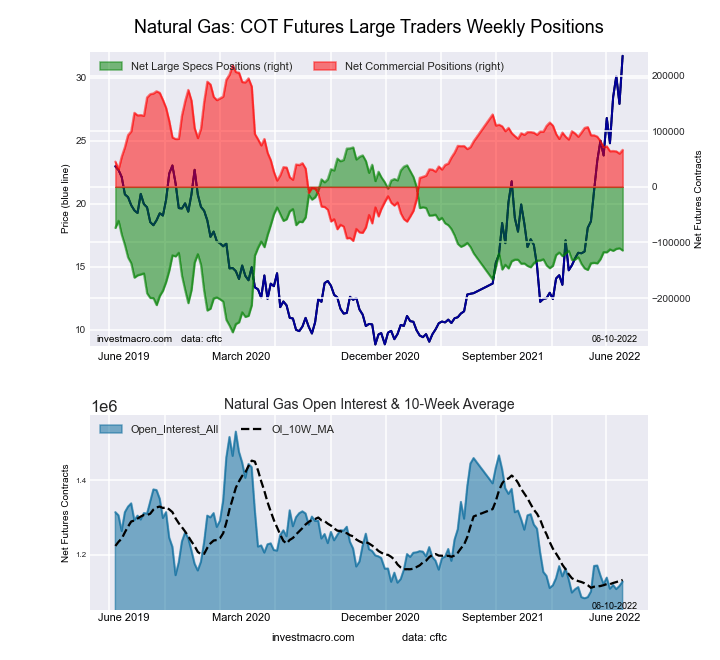
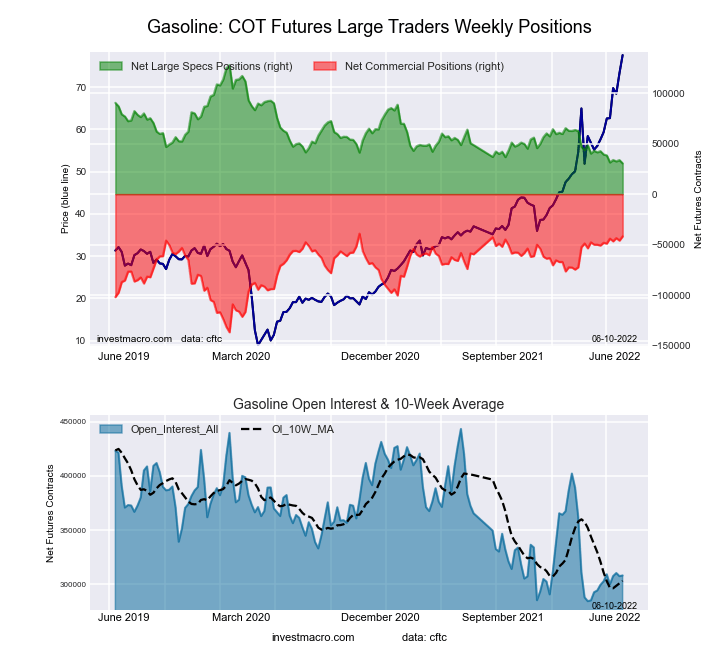
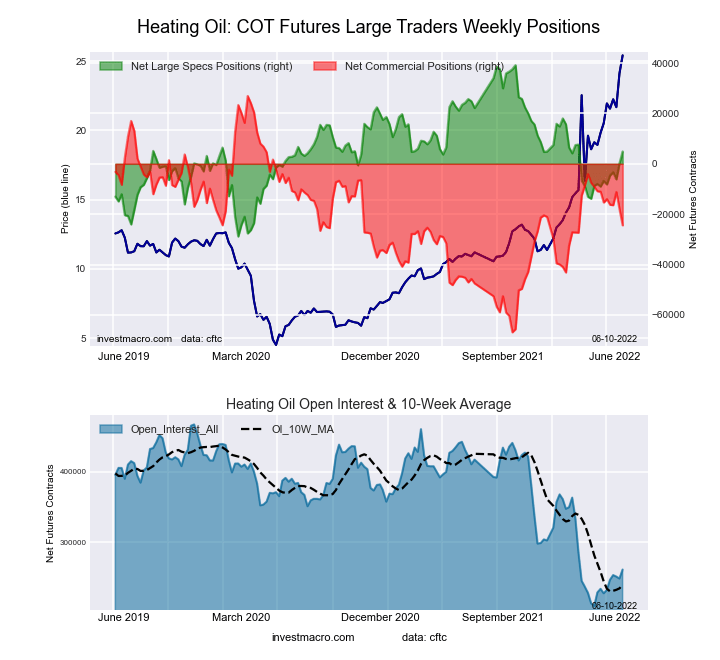
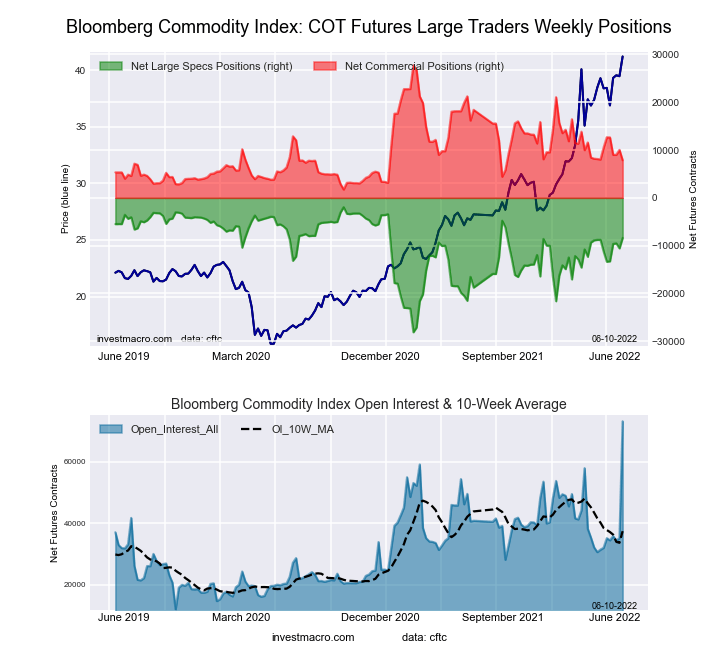
Energy market speculator bets were mixed this week as three out of the six energy markets we cover had higher positioning this week while three markets had lower contracts. Leading the gains for energy markets was Brent Crude Oil (4,774 contracts) and Heating Oil (4,765 contracts) with Bloomberg Commodity Index (2,178 contracts) also showing a positive week. Meanwhile, leading the declines in speculator bets this week were WTI Crude Oil (-4,720 contracts) and Natural Gas (-3,974 contracts) with Gasoline (-3,202 contracts) also registering lower bets on the week.


Strength scores (3-Year range of Speculator positions, from 0 to 100 where above 80 is extreme bullish and below 20 is extreme bearish) show that the Bloomberg Commodity Index is the highest above its midpoint for the past 3 years while Brent, Heating Oil and Natural Gas are slightly below the 50 percent level.

Strength score trends (or move index, that show 6-week changes in strength scores) shows that Heating Oil and the Bloomberg Commodity Index bets have been rising the strongest over the past six weeks while Gasoline is moving the opposite way.


Data Snapshot of Commodity Market Traders | Columns Legend
Jun-07-2022OIOI-IndexSpec-NetSpec-IndexCom-NetCOM-IndexSmalls-NetSmalls-Index
WTI Crude1,790,61810328,2568-369,0339340,77772
Gold494,13012175,2687-199,8869524,61818
Silver148,2941517,4045-27,9909410,58610
Copper194,18722-3,71440879602,83542
Palladium7,0353-3,46123,58197-12037
Platinum65,295315,93312-9,742923,80915
Natural Gas1,127,73110-114,3424466,4195247,92393
Brent169,80216-36,0985134,208501,89035
Heating Oil261,651204,88650-24,4284519,54266
Soybeans760,44435176,64468-148,39039-28,25423
Corn1,557,16731391,26480-337,13724-54,12712
Coffee222,5831548,76781-51,363232,59616
Sugar849,81412195,40377-234,4962439,09356
Wheat333,7051223,88150-19,86331-4,01890


WTI Crude Oil Futures:

WTI Crude Oil Futures COT ChartThe WTI Crude Oil Futures large speculator standing this week recorded a net position of 328,256 contracts in the data reported through Tuesday. This was a weekly decrease of -4,720 contracts from the previous week which had a total of 332,976 net contracts.

This week’s current strength score (the trader positioning range over the past three years, measured from 0 to 100) shows the speculators are currently Bearish-Extreme with a score of 8.2 percent. The commercials are Bullish-Extreme with a score of 92.9 percent and the small traders (not shown in chart) are Bullish with a score of 72.5 percent.

WTI Crude Oil Futures StatisticsSPECULATORSCOMMERCIALSSMALL TRADERS
– Percent of Open Interest Longs:23.734.85.2
– Percent of Open Interest Shorts:5.355.42.9
– Net Position:328,256-369,03340,777
– Gross Longs:423,882622,32092,501
– Gross Shorts:95,626991,35351,724
– Long to Short Ratio:4.4 to 10.6 to 11.8 to 1
NET POSITION TREND:
– Strength Index Score (3 Year Range Pct):8.292.972.5
– Strength Index Reading (3 Year Range):Bearish-ExtremeBullish-ExtremeBullish
NET POSITION MOVEMENT INDEX:
– 6-Week Change in Strength Index:4.3-4.2-2.1


Brent Crude Oil Futures:

Brent Last Day Crude Oil Futures COT ChartThe Brent Crude Oil Futures large speculator standing this week recorded a net position of -36,098 contracts in the data reported through Tuesday. This was a weekly increase of 4,774 contracts from the previous week which had a total of -40,872 net contracts.

This week’s current strength score (the trader positioning range over the past three years, measured from 0 to 100) shows the speculators are currently Bullish with a score of 50.6 percent. The commercials are Bullish with a score of 50.2 percent and the small traders (not shown in chart) are Bearish with a score of 34.8 percent.

Brent Crude Oil Futures StatisticsSPECULATORSCOMMERCIALSSMALL TRADERS
– Percent of Open Interest Longs:15.351.54.4
– Percent of Open Interest Shorts:36.631.43.3
– Net Position:-36,09834,2081,890
– Gross Longs:26,00987,4887,434
– Gross Shorts:62,10753,2805,544
– Long to Short Ratio:0.4 to 11.6 to 11.3 to 1
NET POSITION TREND:
– Strength Index Score (3 Year Range Pct):50.650.234.8
– Strength Index Reading (3 Year Range):BullishBullishBearish
NET POSITION MOVEMENT INDEX:
– 6-Week Change in Strength Index:4.1-2.3-14.1


Natural Gas Futures:

Natural Gas Futures COT ChartThe Natural Gas Futures large speculator standing this week recorded a net position of -114,342 contracts in the data reported through Tuesday. This was a weekly decrease of -3,974 contracts from the previous week which had a total of -110,368 net contracts.

This week’s current strength score (the trader positioning range over the past three years, measured from 0 to 100) shows the speculators are currently Bearish with a score of 44.3 percent. The commercials are Bullish with a score of 51.8 percent and the small traders (not shown in chart) are Bullish-Extreme with a score of 93.5 percent.

Natural Gas Futures StatisticsSPECULATORSCOMMERCIALSSMALL TRADERS
– Percent of Open Interest Longs:20.837.26.8
– Percent of Open Interest Shorts:31.031.32.6
– Net Position:-114,34266,41947,923
– Gross Longs:235,073419,84776,779
– Gross Shorts:349,415353,42828,856
– Long to Short Ratio:0.7 to 11.2 to 12.7 to 1
NET POSITION TREND:
– Strength Index Score (3 Year Range Pct):44.351.893.5
– Strength Index Reading (3 Year Range):BearishBullishBullish-Extreme
NET POSITION MOVEMENT INDEX:
– 6-Week Change in Strength Index:0.9-1.64.6


Gasoline Blendstock Futures:

RBOB Gasoline Energy Futures COT ChartThe Gasoline Blendstock Futures large speculator standing this week recorded a net position of 30,488 contracts in the data reported through Tuesday. This was a weekly decrease of -3,202 contracts from the previous week which had a total of 33,690 net contracts.

This week’s current strength score (the trader positioning range over the past three years, measured from 0 to 100) shows the speculators are currently Bearish-Extreme with a score of 1.2 percent. The commercials are Bullish-Extreme with a score of 95.2 percent and the small traders (not shown in chart) are Bullish-Extreme with a score of 88.5 percent.

Nasdaq Mini Futures StatisticsSPECULATORSCOMMERCIALSSMALL TRADERS
– Percent of Open Interest Longs:24.652.78.0
– Percent of Open Interest Shorts:14.766.24.3
– Net Position:30,488-41,86611,378
– Gross Longs:75,841162,33024,623
– Gross Shorts:45,353204,19613,245
– Long to Short Ratio:1.7 to 10.8 to 11.9 to 1
NET POSITION TREND:
– Strength Index Score (3 Year Range Pct):1.295.288.5
– Strength Index Reading (3 Year Range):Bearish-ExtremeBullish-ExtremeBullish-Extreme
NET POSITION MOVEMENT INDEX:
– 6-Week Change in Strength Index:-8.96.416.0


#2 Heating Oil NY-Harbor Futures:

NY Harbor Heating Oil Energy Futures COT ChartThe #2 Heating Oil NY-Harbor Futures large speculator standing this week recorded a net position of 4,886 contracts in the data reported through Tuesday. This was a weekly rise of 4,765 contracts from the previous week which had a total of 121 net contracts.

This week’s current strength score (the trader positioning range over the past three years, measured from 0 to 100) shows the speculators are currently Bearish with a score of 49.6 percent. The commercials are Bearish with a score of 45.3 percent and the small traders (not shown in chart) are Bullish with a score of 66.1 percent.

Heating Oil Futures StatisticsSPECULATORSCOMMERCIALSSMALL TRADERS
– Percent of Open Interest Longs:17.349.517.5
– Percent of Open Interest Shorts:15.458.910.1
– Net Position:4,886-24,42819,542
– Gross Longs:45,231129,58845,902
– Gross Shorts:40,345154,01626,360
– Long to Short Ratio:1.1 to 10.8 to 11.7 to 1
NET POSITION TREND:
– Strength Index Score (3 Year Range Pct):49.645.366.1
– Strength Index Reading (3 Year Range):BearishBearishBullish
NET POSITION MOVEMENT INDEX:
– 6-Week Change in Strength Index:17.2-9.7-9.1


Bloomberg Commodity Index Futures:

Bloomberg Commodity Index Futures COT ChartThe Bloomberg Commodity Index Futures large speculator standing this week recorded a net position of -8,383 contracts in the data reported through Tuesday. This was a weekly increase of 2,178 contracts from the previous week which had a total of -10,561 net contracts.

This week’s current strength score (the trader positioning range over the past three years, measured from 0 to 100) shows the speculators are currently Bullish with a score of 75.4 percent. The commercials are Bearish with a score of 23.5 percent and the small traders (not shown in chart) are Bearish with a score of 37.9 percent.

Bloomberg Index Futures StatisticsSPECULATORSCOMMERCIALSSMALL TRADERS
– Percent of Open Interest Longs:33.562.01.5
– Percent of Open Interest Shorts:45.051.30.8
– Net Position:-8,3837,865518
– Gross Longs:24,51245,3681,126
– Gross Shorts:32,89537,503608
– Long to Short Ratio:0.7 to 11.2 to 11.9 to 1
NET POSITION TREND:
– Strength Index Score (3 Year Range Pct):75.423.537.9
– Strength Index Reading (3 Year Range):BullishBearishBearish
NET POSITION MOVEMENT INDEX:
– 6-Week Change in Strength Index:10.8-10.2-6.8


Article By InvestMacroReceive our weekly COT Reports by Email

*COT Report: The COT data, released weekly to the public each Friday, is updated through the most recent Tuesday (data is 3 days old) and shows a quick view of how large speculators or non-commercials (for-profit traders) were positioned in the futures markets.

The CFTC categorizes trader positions according to commercial hedgers (traders who use futures contracts for hedging as part of the business), non-commercials (large traders who speculate to realize trading profits) and nonreportable traders (usually small traders/speculators) as well as their open interest (contracts open in the market at time of reporting).See CFTC criteria here.

Economic “Hurricane”: Here’s a Take on a Bank CEO’s Warning

Here’s what reached a nadir as the war in Ukraine broke out

By Elliott Wave International

On June 1, a CNBC headline said:

[Major bank CEO] says ‘brace yourself’ for an economic hurricane caused by the Fed and Ukraine war

Yes, the U.S. central bank is engaging in so-called “quantitative tightening” and the war persists in Ukraine.
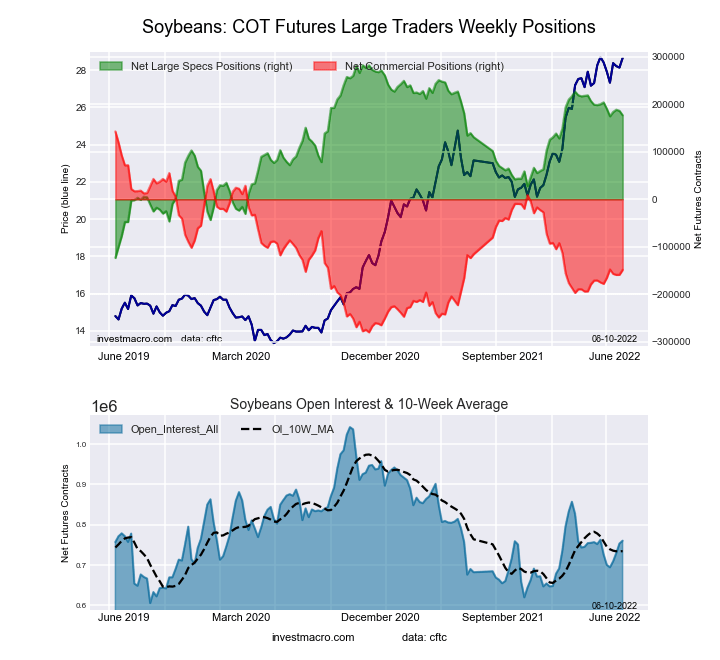
Yet, those cited “causes” of a possible economic “hurricane,” like a severe recession or even a depression, are results themselves. For instance, the war in Ukraine resulted from a shift in social mood — going from positive to negative.
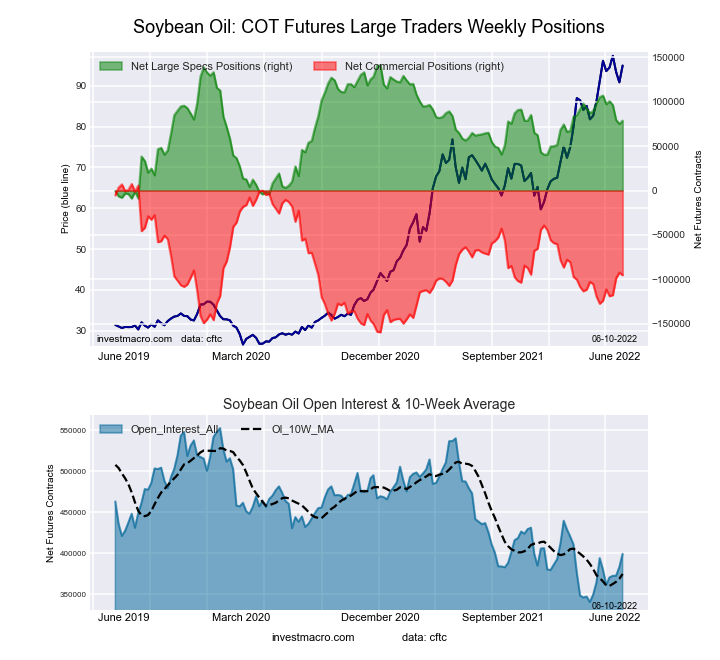
The April Elliott Wave Theorist, a monthly publication which provides analysis of financial markets and cultural trends, drives the point home regarding the war in Ukraine with this chart and commentary:

The outbreak of the war coincided not with the start of a decline in U.S. stock prices, as so many investors feared it would, but the exact low prior to a rally that persisted throughout the fighting. The rally is not due to the bizarre formulation that war is bullish; it is due to natural waves of social mood that had reached a nadir when the war broke out.

Regarding Fed tightening as a contributor to a possible economic crisis, realize that the Fed merely follows the market, it doesn’t lead. In other words, investor psychology is the true cause of the rise in rates.

Interest rates (or bond yields) began to rise well before the Fed started to raise its fed funds rate this year.

Fed officials voted to start lifting rates on March 16. Yet, the yield on the 10-year Treasury note bottomed back in 2020 and has been climbing since.

Of course, rising bond yields mean lower bond prices.

Getting back to the economy, the 1.4% decline in U.S. GDP in Q1 was recently revised downward to 1.5%, so an economic contraction may already be underway.

Returning to that mention of “natural waves of social mood” in the April Elliott Wave Theorist quote, you can get insights into these “waves” by reading Frost & Prechter’s book, Elliott Wave Principle: Key to Market Behavior.

Here’s a quote from the book:

The Wave Principle is governed by man’s social nature, and since he has such a nature, its expression generates forms. As the forms are repetitive, they have predictive value.

If you’d like to read the entire online version of the book, you may do so for free once you become a member of Club EWI, which is the world’s largest Elliott wave educational community (approximately 500,000 members worldwide and growing).

A major benefit of a Club EWI membership is complimentary access to a wealth of Elliott wave educational resources on financial markets, investing and trading.

There’s no cost involved in joining Club EWI and no obligations.

Get started right away by following this link: Elliott Wave Principle: Key to Market Behavior — free, unlimited and instant access.

This article was syndicated by Elliott Wave International and was originally published under the headline Economic “Hurricane”: Here’s a Take on a Bank CEO’s Warning. EWI is the world’s largest market forecasting firm. Its staff of full-time analysts led by Chartered Market Technician Robert Prechter provides 24-hour-a-day market analysis to institutional and private investors around the world.