
By InvestMacro | COT | Data Tables | COT Leaders | Downloads | COT Newsletter
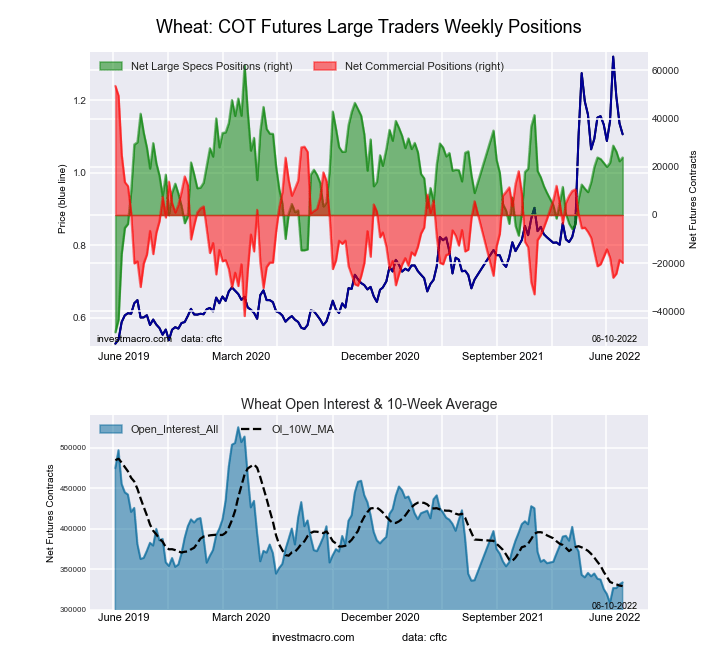
Here are the latest charts and statistics for the Commitment of Traders (COT) data published by the Commodities Futures Trading Commission (CFTC).
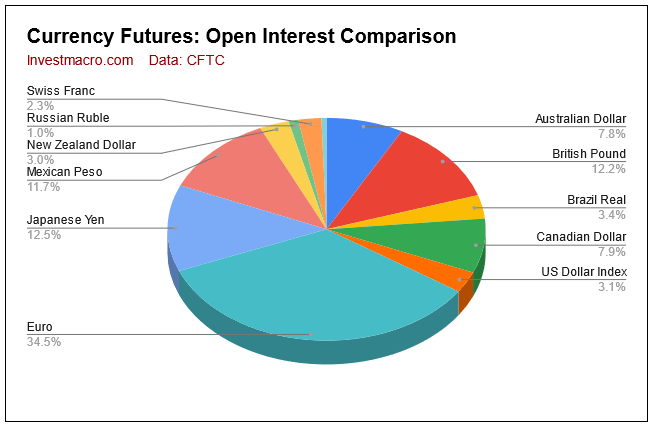
The latest COT data is updated through Tuesday June 7th and shows a quick view of how large traders (for-profit speculators and commercial entities) were positioned in the futures markets. All currency positions are in direct relation to the US dollar where, for example, a bet for the euro is a bet that the euro will rise versus the dollar while a bet against the euro will be a bet that the euro will decline versus the dollar.
COT Currencies market speculator bets were mostly higher this week as eight out of the eleven currency markets we cover had higher positioning this week while three markets had lower contracts.
Leading the gains for currency markets was the Canadian dollar (5,945 contracts) and the Swiss franc (4,326 contracts) with the British pound sterling (3,295 contracts), Japanese yen (2,793 contracts), Brazil real (1,389 contracts), Australian dollar (786 contracts), US Dollar Index (400 contracts) and Bitcoin (87 contracts) also showing a positive week.
Meanwhile, leading the declines in speculator bets this week were Mexican peso (-2,723 contracts) and Euro (-1,729 contracts) with New Zealand dollar (-1,047 contracts) also registering lower bets on the week.
Currency Speculators Notes:
- US Dollar Index speculator bets have continued their upward climb in four out of the past five weeks as well as nine out of the past twelve weeks. USD Index remains in an extreme-bullish strength level and is very close (currently +37,938 contracts) to the highest net speculator position (+39,078 contracts on January 4th) of this recent bullish cycle, emphasizing the strong speculator bias.
- The Euro speculator position saw a pullback this week (-1,729 contracts) after huge gains in the previous three weeks (+58,650 contracts). Speculator sentiment is still pretty strong currently (+50,543 contracts) despite a very weak exchange rate (EURUSD at 1.0524 to close the week) and weak outlook for the Eurozone economy with rising inflation.
- British pound sterling speculator sentiment has crumbled in the past few months. The net speculator position managed to poke its head above its negative bias on February 15th with a total of +2,237 net contracts but sentiment has deteriorated since. From February 22nd to this week, speculator bets have dropped by a total of -73,047 contracts and recently hit a 139-week low on May 24th, the lowest level of speculator sentiment dating back to September of 2019.
- Japanese yen speculator positions are the most bearish of the major currencies just under -100,000 contracts. The USDJPY exchange rate is at a 20-year high and there has been no sign that the BOJ is interest in raising interest rates while other central banks commit to higher rates. These factors seem to say that the rout of the yen will continue ahead for some time (but how far can it go?).
- Commodity currency speculator bets are on the defensive lately. Australian dollar spec bets have fallen in five out of the past six weeks.
- Canadian dollar bets are now in bearish territory for a 5th straight week.
- New Zealand dollar speculator positions have declined in six out of the past seven weeks and the net position has now fallen to the lowest level since March of 2020
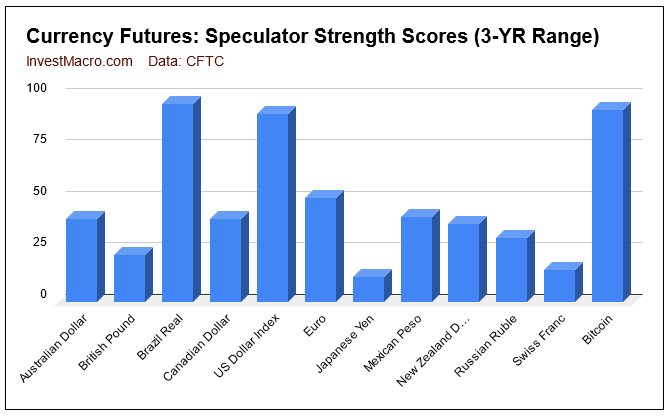
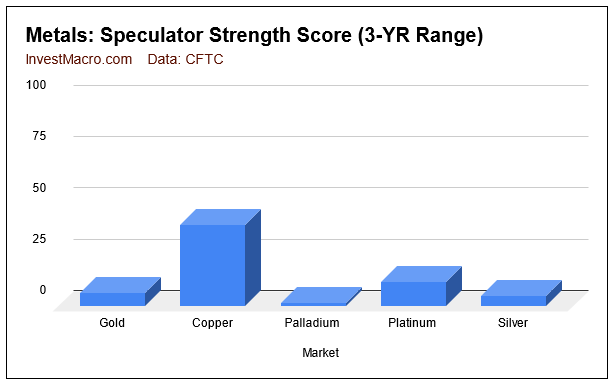
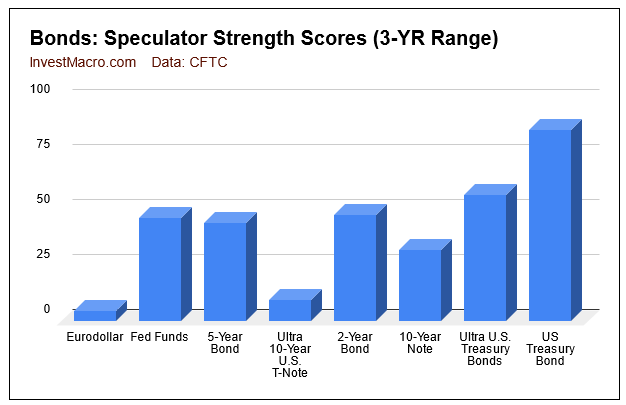
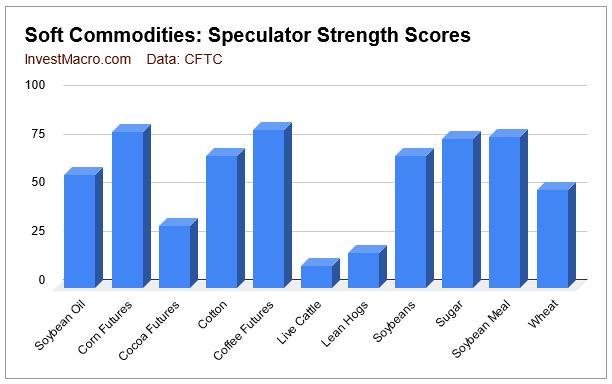
Strength scores (3-Year range of Speculator positions, from 0 to 100 where above 80 is extreme bullish and below 20 is extreme bearish) show that the Brazilian Real, US Dollar Index and Bitcoin are all in extreme-bullish levels at the current moment. On the opposite end of the extreme spectrum, the Japanese yen and the Swiss franc are very weak in relative speculator sentiment and sit in the extreme-bearish levels.
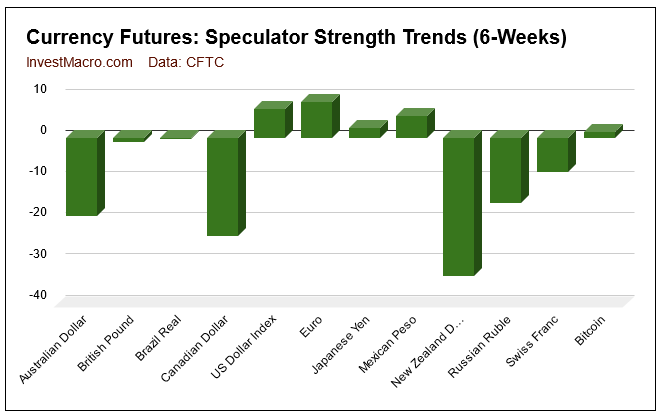
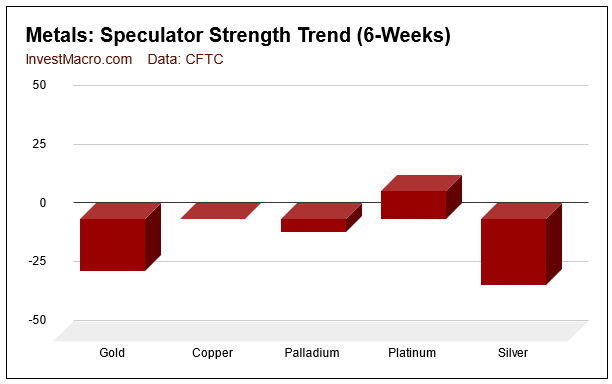
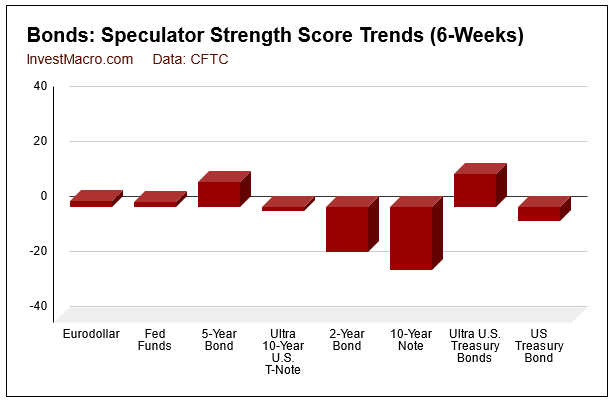
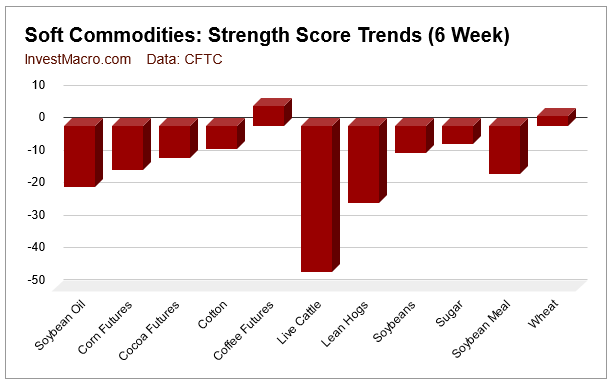
Strength score trends (or move index, that calculate 6-week changes in strength scores) shows that the commodity currencies have been losing sentiment over the last six weeks. The Australian dollar, Canadian dollar and the New Zealand dollar have all had changes of at least -18.8 percent in their strength scores with the New Zealand dollar leading the decline with a -33.3 percent drop in six weeks. The US Dollar Index, Euro and Mexican Peso have had small but rising scores over the past six weeks.
| Jun-07-2022 | OI | OI-Index | Spec-Net | Spec-Index | Com-Net | COM-Index | Smalls-Net | Smalls-Index |
|---|---|---|---|---|---|---|---|---|
| USD Index | 65,163 | 100 | 37,938 | 91 | -41,863 | 5 | 3,925 | 59 |
| EUR | 730,667 | 95 | 50,543 | 51 | -88,189 | 51 | 37,646 | 37 |
| GBP | 258,623 | 76 | -70,810 | 23 | 80,465 | 77 | -9,655 | 36 |
| JPY | 266,054 | 100 | -91,646 | 12 | 109,109 | 89 | -17,463 | 18 |
| CHF | 49,794 | 41 | -16,132 | 16 | 27,216 | 87 | -11,084 | 20 |
| CAD | 167,373 | 42 | -1,062 | 40 | -13,401 | 58 | 14,463 | 59 |
| AUD | 166,422 | 57 | -47,896 | 40 | 47,413 | 54 | 483 | 54 |
| NZD | 63,540 | 70 | -19,771 | 38 | 22,681 | 65 | -2,910 | 19 |
| MXN | 248,184 | 72 | 32,726 | 41 | -38,117 | 57 | 5,391 | 66 |
| RUB | 20,930 | 4 | 7,543 | 31 | -7,150 | 69 | -393 | 24 |
| BRL | 72,371 | 70 | 46,705 | 96 | -48,954 | 4 | 2,249 | 91 |
| Bitcoin | 10,990 | 58 | 490 | 93 | -529 | 0 | 39 | 14 |
US Dollar Index Futures:
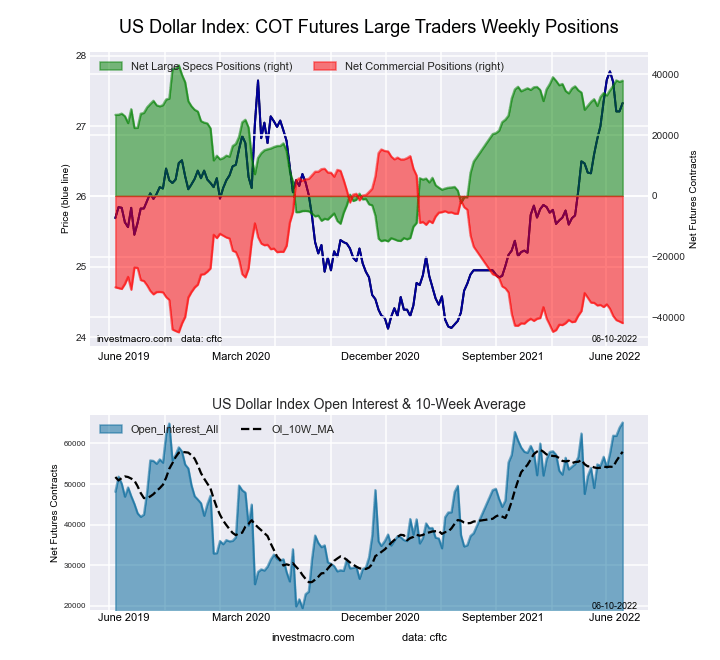 The US Dollar Index large speculator standing this week recorded a net position of 37,938 contracts in the data reported through Tuesday. This was a weekly lift of 400 contracts from the previous week which had a total of 37,538 net contracts.
This week’s current strength score (the trader positioning range over the past three years, measured from 0 to 100) shows the speculators are currently Bullish-Extreme with a score of 91.2 percent. The commercials are Bearish-Extreme with a score of 5.0 percent and the small traders (not shown in chart) are Bullish with a score of 59.5 percent.
| US DOLLAR INDEX Statistics | SPECULATORS | COMMERCIALS | SMALL TRADERS |
| – Percent of Open Interest Longs: | 85.1 | 3.2 | 8.9 |
| – Percent of Open Interest Shorts: | 26.9 | 67.5 | 2.8 |
| – Net Position: | 37,938 | -41,863 | 3,925 |
| – Gross Longs: | 55,460 | 2,090 | 5,780 |
| – Gross Shorts: | 17,522 | 43,953 | 1,855 |
| – Long to Short Ratio: | 3.2 to 1 | 0.0 to 1 | 3.1 to 1 |
| NET POSITION TREND: | |||
| – Strength Index Score (3 Year Range Pct): | 91.2 | 5.0 | 59.5 |
| – Strength Index Reading (3 Year Range): | Bullish-Extreme | Bearish-Extreme | Bullish |
| NET POSITION MOVEMENT INDEX: | |||
| – 6-Week Change in Strength Index: | 7.0 | -8.8 | 13.4 |
Euro Currency Futures:
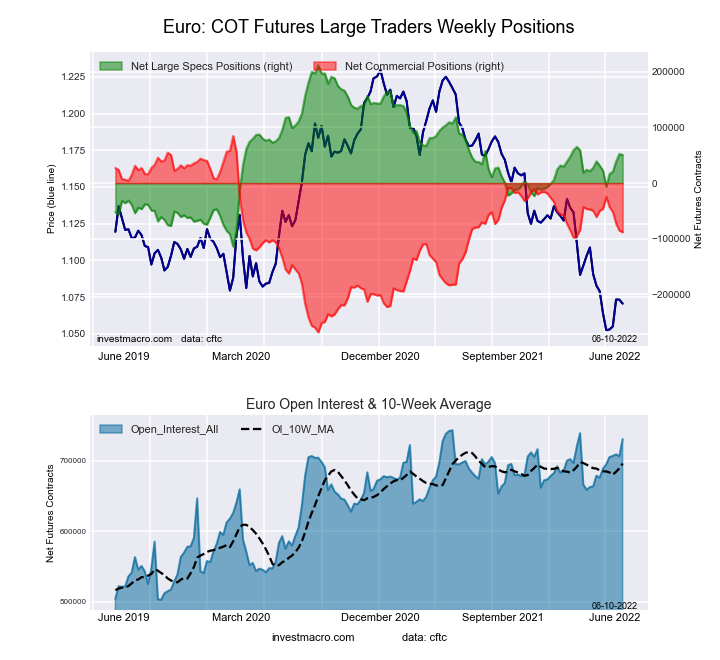 The Euro Currency large speculator standing this week recorded a net position of 50,543 contracts in the data reported through Tuesday. This was a weekly reduction of -1,729 contracts from the previous week which had a total of 52,272 net contracts.
This week’s current strength score (the trader positioning range over the past three years, measured from 0 to 100) shows the speculators are currently Bullish with a score of 50.5 percent. The commercials are Bullish with a score of 51.0 percent and the small traders (not shown in chart) are Bearish with a score of 36.7 percent.
| EURO Currency Statistics | SPECULATORS | COMMERCIALS | SMALL TRADERS |
| – Percent of Open Interest Longs: | 31.5 | 50.0 | 12.5 |
| – Percent of Open Interest Shorts: | 24.6 | 62.1 | 7.3 |
| – Net Position: | 50,543 | -88,189 | 37,646 |
| – Gross Longs: | 230,248 | 365,628 | 90,978 |
| – Gross Shorts: | 179,705 | 453,817 | 53,332 |
| – Long to Short Ratio: | 1.3 to 1 | 0.8 to 1 | 1.7 to 1 |
| NET POSITION TREND: | |||
| – Strength Index Score (3 Year Range Pct): | 50.5 | 51.0 | 36.7 |
| – Strength Index Reading (3 Year Range): | Bullish | Bullish | Bearish |
| NET POSITION MOVEMENT INDEX: | |||
| – 6-Week Change in Strength Index: | 8.7 | -11.9 | 22.7 |
British Pound Sterling Futures:
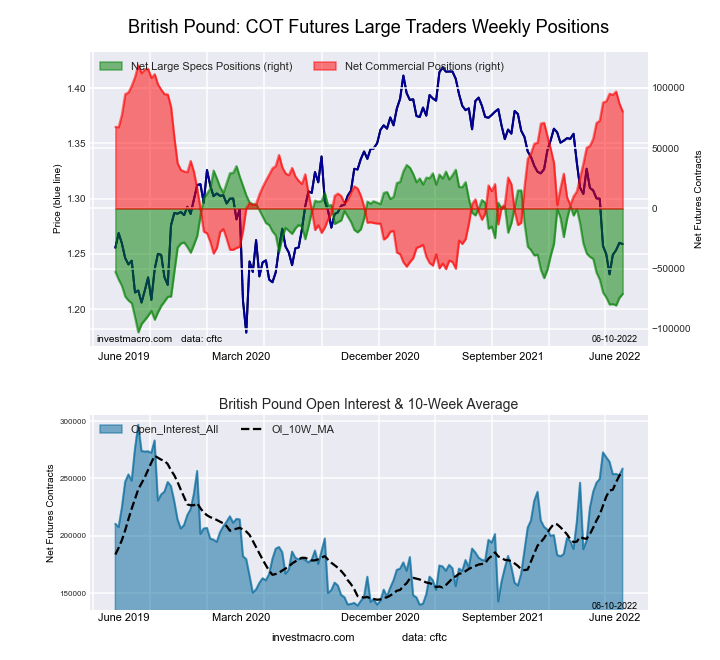 The British Pound Sterling large speculator standing this week recorded a net position of -70,810 contracts in the data reported through Tuesday. This was a weekly increase of 3,295 contracts from the previous week which had a total of -74,105 net contracts.
This week’s current strength score (the trader positioning range over the past three years, measured from 0 to 100) shows the speculators are currently Bearish with a score of 23.0 percent. The commercials are Bullish with a score of 77.3 percent and the small traders (not shown in chart) are Bearish with a score of 35.6 percent.
| BRITISH POUND Statistics | SPECULATORS | COMMERCIALS | SMALL TRADERS |
| – Percent of Open Interest Longs: | 13.4 | 74.1 | 8.4 |
| – Percent of Open Interest Shorts: | 40.8 | 43.0 | 12.1 |
| – Net Position: | -70,810 | 80,465 | -9,655 |
| – Gross Longs: | 34,618 | 191,742 | 21,602 |
| – Gross Shorts: | 105,428 | 111,277 | 31,257 |
| – Long to Short Ratio: | 0.3 to 1 | 1.7 to 1 | 0.7 to 1 |
| NET POSITION TREND: | |||
| – Strength Index Score (3 Year Range Pct): | 23.0 | 77.3 | 35.6 |
| – Strength Index Reading (3 Year Range): | Bearish | Bullish | Bearish |
| NET POSITION MOVEMENT INDEX: | |||
| – 6-Week Change in Strength Index: | -0.9 | -4.4 | 17.9 |
Japanese Yen Futures:
 The Japanese Yen large speculator standing this week recorded a net position of -91,646 contracts in the data reported through Tuesday. This was a weekly boost of 2,793 contracts from the previous week which had a total of -94,439 net contracts.
This week’s current strength score (the trader positioning range over the past three years, measured from 0 to 100) shows the speculators are currently Bearish-Extreme with a score of 12.4 percent. The commercials are Bullish-Extreme with a score of 88.9 percent and the small traders (not shown in chart) are Bearish-Extreme with a score of 18.0 percent.
| JAPANESE YEN Statistics | SPECULATORS | COMMERCIALS | SMALL TRADERS |
| – Percent of Open Interest Longs: | 6.9 | 79.3 | 8.7 |
| – Percent of Open Interest Shorts: | 41.4 | 38.3 | 15.3 |
| – Net Position: | -91,646 | 109,109 | -17,463 |
| – Gross Longs: | 18,466 | 210,889 | 23,226 |
| – Gross Shorts: | 110,112 | 101,780 | 40,689 |
| – Long to Short Ratio: | 0.2 to 1 | 2.1 to 1 | 0.6 to 1 |
| NET POSITION TREND: | |||
| – Strength Index Score (3 Year Range Pct): | 12.4 | 88.9 | 18.0 |
| – Strength Index Reading (3 Year Range): | Bearish-Extreme | Bullish-Extreme | Bearish-Extreme |
| NET POSITION MOVEMENT INDEX: | |||
| – 6-Week Change in Strength Index: | 2.4 | -2.8 | 3.9 |
Swiss Franc Futures:
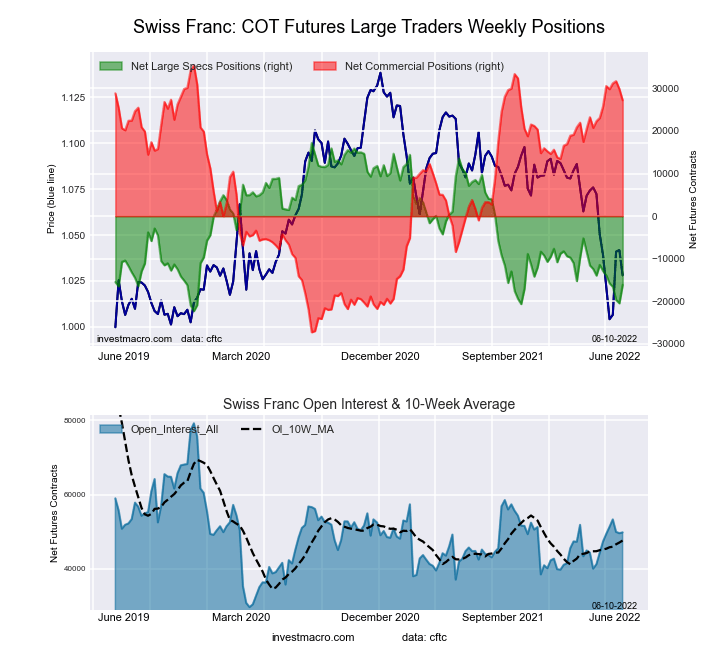 The Swiss Franc large speculator standing this week recorded a net position of -16,132 contracts in the data reported through Tuesday. This was a weekly advance of 4,326 contracts from the previous week which had a total of -20,458 net contracts.
This week’s current strength score (the trader positioning range over the past three years, measured from 0 to 100) shows the speculators are currently Bearish-Extreme with a score of 15.6 percent. The commercials are Bullish-Extreme with a score of 86.9 percent and the small traders (not shown in chart) are Bearish with a score of 20.0 percent.
| SWISS FRANC Statistics | SPECULATORS | COMMERCIALS | SMALL TRADERS |
| – Percent of Open Interest Longs: | 5.2 | 69.3 | 18.8 |
| – Percent of Open Interest Shorts: | 37.6 | 14.6 | 41.1 |
| – Net Position: | -16,132 | 27,216 | -11,084 |
| – Gross Longs: | 2,609 | 34,494 | 9,378 |
| – Gross Shorts: | 18,741 | 7,278 | 20,462 |
| – Long to Short Ratio: | 0.1 to 1 | 4.7 to 1 | 0.5 to 1 |
| NET POSITION TREND: | |||
| – Strength Index Score (3 Year Range Pct): | 15.6 | 86.9 | 20.0 |
| – Strength Index Reading (3 Year Range): | Bearish-Extreme | Bullish-Extreme | Bearish |
| NET POSITION MOVEMENT INDEX: | |||
| – 6-Week Change in Strength Index: | -8.3 | 2.4 | 6.0 |
Canadian Dollar Futures:
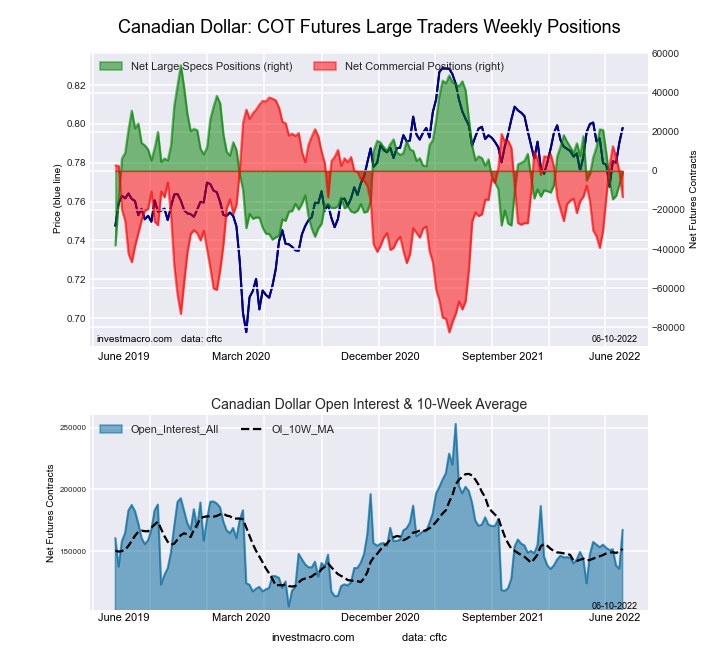 The Canadian Dollar large speculator standing this week recorded a net position of -1,062 contracts in the data reported through Tuesday. This was a weekly boost of 5,945 contracts from the previous week which had a total of -7,007 net contracts.
This week’s current strength score (the trader positioning range over the past three years, measured from 0 to 100) shows the speculators are currently Bearish with a score of 40.2 percent. The commercials are Bullish with a score of 57.6 percent and the small traders (not shown in chart) are Bullish with a score of 58.6 percent.
| CANADIAN DOLLAR Statistics | SPECULATORS | COMMERCIALS | SMALL TRADERS |
| – Percent of Open Interest Longs: | 23.5 | 44.2 | 22.4 |
| – Percent of Open Interest Shorts: | 24.1 | 52.2 | 13.7 |
| – Net Position: | -1,062 | -13,401 | 14,463 |
| – Gross Longs: | 39,288 | 74,044 | 37,463 |
| – Gross Shorts: | 40,350 | 87,445 | 23,000 |
| – Long to Short Ratio: | 1.0 to 1 | 0.8 to 1 | 1.6 to 1 |
| NET POSITION TREND: | |||
| – Strength Index Score (3 Year Range Pct): | 40.2 | 57.6 | 58.6 |
| – Strength Index Reading (3 Year Range): | Bearish | Bullish | Bullish |
| NET POSITION MOVEMENT INDEX: | |||
| – 6-Week Change in Strength Index: | -23.8 | 14.2 | 9.7 |
Australian Dollar Futures:
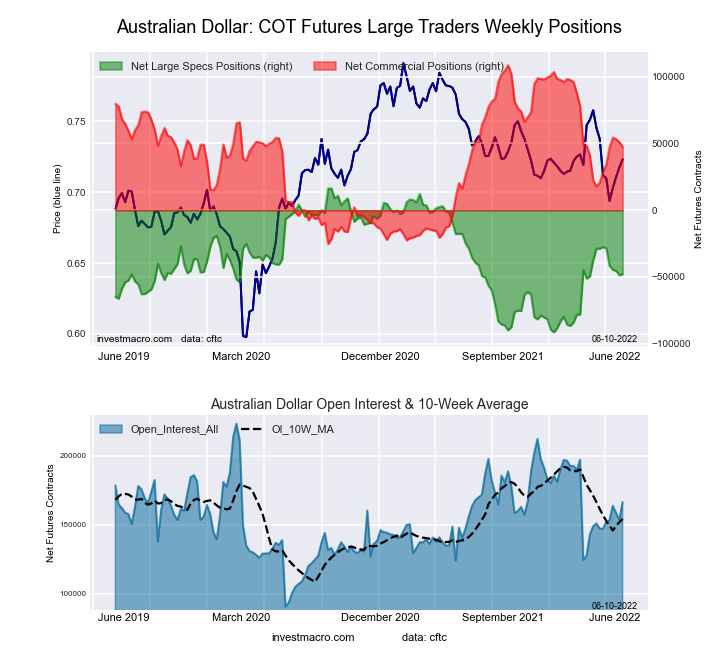 The Australian Dollar large speculator standing this week recorded a net position of -47,896 contracts in the data reported through Tuesday. This was a weekly increase of 786 contracts from the previous week which had a total of -48,682 net contracts.
This week’s current strength score (the trader positioning range over the past three years, measured from 0 to 100) shows the speculators are currently Bearish with a score of 40.4 percent. The commercials are Bullish with a score of 54.3 percent and the small traders (not shown in chart) are Bullish with a score of 53.6 percent.
| AUSTRALIAN DOLLAR Statistics | SPECULATORS | COMMERCIALS | SMALL TRADERS |
| – Percent of Open Interest Longs: | 19.1 | 59.9 | 14.5 |
| – Percent of Open Interest Shorts: | 47.8 | 31.4 | 14.2 |
| – Net Position: | -47,896 | 47,413 | 483 |
| – Gross Longs: | 31,720 | 99,747 | 24,197 |
| – Gross Shorts: | 79,616 | 52,334 | 23,714 |
| – Long to Short Ratio: | 0.4 to 1 | 1.9 to 1 | 1.0 to 1 |
| NET POSITION TREND: | |||
| – Strength Index Score (3 Year Range Pct): | 40.4 | 54.3 | 53.6 |
| – Strength Index Reading (3 Year Range): | Bearish | Bullish | Bullish |
| NET POSITION MOVEMENT INDEX: | |||
| – 6-Week Change in Strength Index: | -18.8 | 13.8 | 4.3 |
New Zealand Dollar Futures:
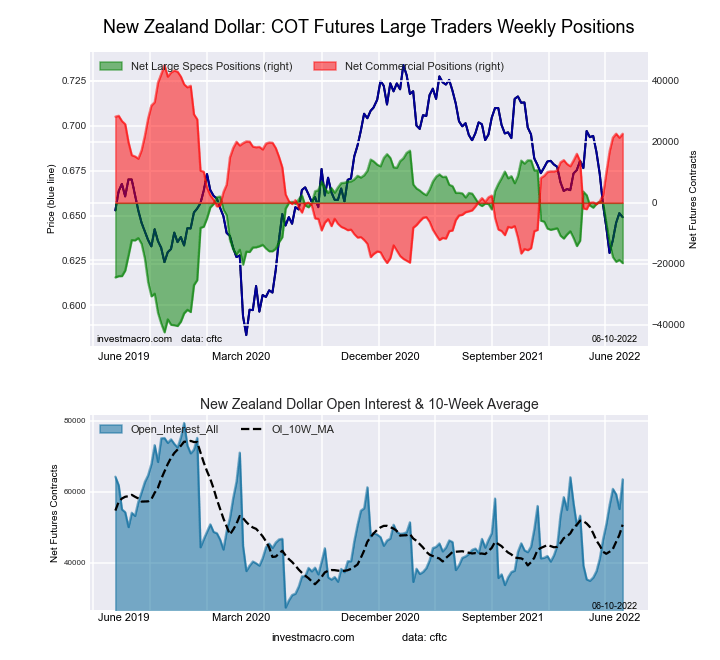 The New Zealand Dollar large speculator standing this week recorded a net position of -19,771 contracts in the data reported through Tuesday. This was a weekly decline of -1,047 contracts from the previous week which had a total of -18,724 net contracts.
This week’s current strength score (the trader positioning range over the past three years, measured from 0 to 100) shows the speculators are currently Bearish with a score of 38.1 percent. The commercials are Bullish with a score of 65.4 percent and the small traders (not shown in chart) are Bearish-Extreme with a score of 18.5 percent.
| NEW ZEALAND DOLLAR Statistics | SPECULATORS | COMMERCIALS | SMALL TRADERS |
| – Percent of Open Interest Longs: | 19.4 | 69.1 | 4.0 |
| – Percent of Open Interest Shorts: | 50.5 | 33.4 | 8.6 |
| – Net Position: | -19,771 | 22,681 | -2,910 |
| – Gross Longs: | 12,310 | 43,890 | 2,538 |
| – Gross Shorts: | 32,081 | 21,209 | 5,448 |
| – Long to Short Ratio: | 0.4 to 1 | 2.1 to 1 | 0.5 to 1 |
| NET POSITION TREND: | |||
| – Strength Index Score (3 Year Range Pct): | 38.1 | 65.4 | 18.5 |
| – Strength Index Reading (3 Year Range): | Bearish | Bullish | Bearish-Extreme |
| NET POSITION MOVEMENT INDEX: | |||
| – 6-Week Change in Strength Index: | -33.3 | 31.2 | -4.3 |
Mexican Peso Futures:
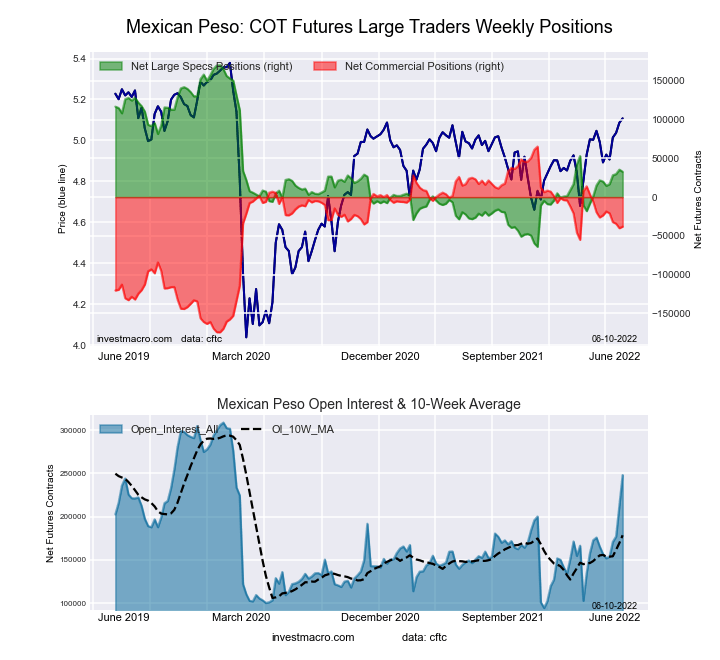 The Mexican Peso large speculator standing this week recorded a net position of 32,726 contracts in the data reported through Tuesday. This was a weekly decline of -2,723 contracts from the previous week which had a total of 35,449 net contracts.
This week’s current strength score (the trader positioning range over the past three years, measured from 0 to 100) shows the speculators are currently Bearish with a score of 41.3 percent. The commercials are Bullish with a score of 56.9 percent and the small traders (not shown in chart) are Bullish with a score of 65.9 percent.
| MEXICAN PESO Statistics | SPECULATORS | COMMERCIALS | SMALL TRADERS |
| – Percent of Open Interest Longs: | 48.0 | 35.4 | 3.4 |
| – Percent of Open Interest Shorts: | 34.8 | 50.8 | 1.2 |
| – Net Position: | 32,726 | -38,117 | 5,391 |
| – Gross Longs: | 119,162 | 87,884 | 8,441 |
| – Gross Shorts: | 86,436 | 126,001 | 3,050 |
| – Long to Short Ratio: | 1.4 to 1 | 0.7 to 1 | 2.8 to 1 |
| NET POSITION TREND: | |||
| – Strength Index Score (3 Year Range Pct): | 41.3 | 56.9 | 65.9 |
| – Strength Index Reading (3 Year Range): | Bearish | Bullish | Bullish |
| NET POSITION MOVEMENT INDEX: | |||
| – 6-Week Change in Strength Index: | 5.4 | -6.1 | 8.3 |
Brazilian Real Futures:
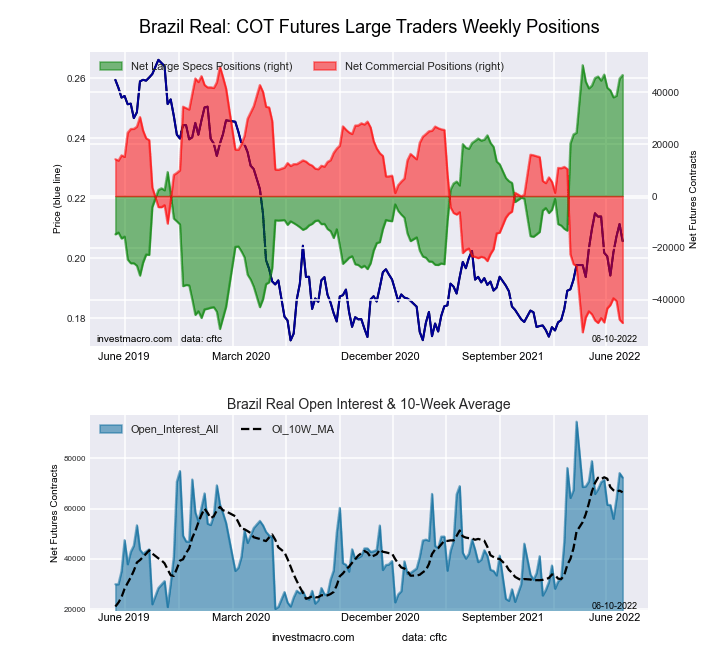 The Brazilian Real large speculator standing this week recorded a net position of 46,705 contracts in the data reported through Tuesday. This was a weekly boost of 1,389 contracts from the previous week which had a total of 45,316 net contracts.
This week’s current strength score (the trader positioning range over the past three years, measured from 0 to 100) shows the speculators are currently Bullish-Extreme with a score of 96.3 percent. The commercials are Bearish-Extreme with a score of 3.5 percent and the small traders (not shown in chart) are Bullish-Extreme with a score of 91.1 percent.
| BRAZIL REAL Statistics | SPECULATORS | COMMERCIALS | SMALL TRADERS |
| – Percent of Open Interest Longs: | 81.1 | 13.5 | 5.4 |
| – Percent of Open Interest Shorts: | 16.5 | 81.2 | 2.3 |
| – Net Position: | 46,705 | -48,954 | 2,249 |
| – Gross Longs: | 58,657 | 9,780 | 3,931 |
| – Gross Shorts: | 11,952 | 58,734 | 1,682 |
| – Long to Short Ratio: | 4.9 to 1 | 0.2 to 1 | 2.3 to 1 |
| NET POSITION TREND: | |||
| – Strength Index Score (3 Year Range Pct): | 96.3 | 3.5 | 91.1 |
| – Strength Index Reading (3 Year Range): | Bullish-Extreme | Bearish-Extreme | Bullish-Extreme |
| NET POSITION MOVEMENT INDEX: | |||
| – 6-Week Change in Strength Index: | -0.2 | -0.2 | 4.4 |
Bitcoin Futures:
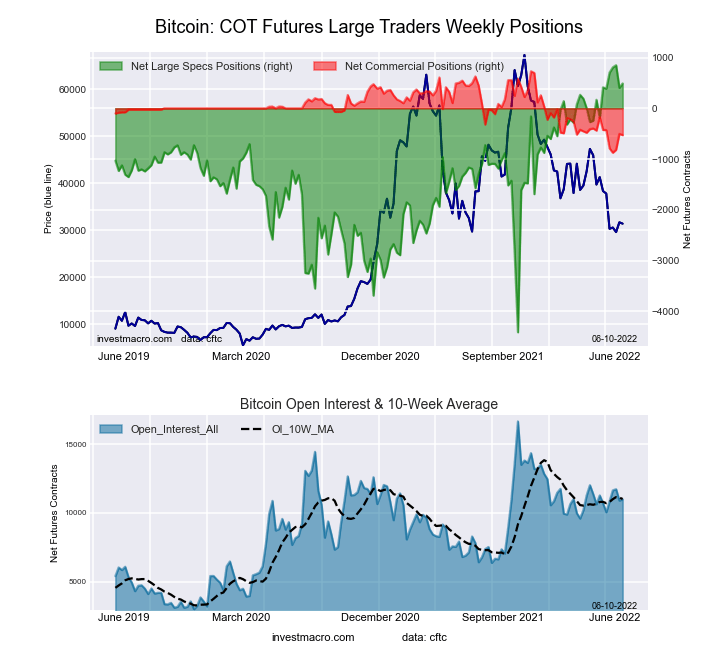 The Bitcoin large speculator standing this week recorded a net position of 490 contracts in the data reported through Tuesday. This was a weekly lift of 87 contracts from the previous week which had a total of 403 net contracts.
This week’s current strength score (the trader positioning range over the past three years, measured from 0 to 100) shows the speculators are currently Bullish-Extreme with a score of 93.2 percent. The commercials are Bearish with a score of 21.6 percent and the small traders (not shown in chart) are Bearish-Extreme with a score of 13.8 percent.
| BITCOIN Statistics | SPECULATORS | COMMERCIALS | SMALL TRADERS |
| – Percent of Open Interest Longs: | 81.5 | 1.5 | 9.7 |
| – Percent of Open Interest Shorts: | 77.1 | 6.4 | 9.3 |
| – Net Position: | 490 | -529 | 39 |
| – Gross Longs: | 8,959 | 169 | 1,063 |
| – Gross Shorts: | 8,469 | 698 | 1,024 |
| – Long to Short Ratio: | 1.1 to 1 | 0.2 to 1 | 1.0 to 1 |
| NET POSITION TREND: | |||
| – Strength Index Score (3 Year Range Pct): | 93.2 | 21.6 | 13.8 |
| – Strength Index Reading (3 Year Range): | Bullish-Extreme | Bearish | Bearish-Extreme |
| NET POSITION MOVEMENT INDEX: | |||
| – 6-Week Change in Strength Index: | 1.5 | -6.4 | 0.6 |
Article By InvestMacro – Receive our weekly COT Reports by Email
*COT Report: The COT data, released weekly to the public each Friday, is updated through the most recent Tuesday (data is 3 days old) and shows a quick view of how large speculators or non-commercials (for-profit traders) were positioned in the futures markets.
The CFTC categorizes trader positions according to commercial hedgers (traders who use futures contracts for hedging as part of the business), non-commercials (large traders who speculate to realize trading profits) and nonreportable traders (usually small traders/speculators) as well as their open interest (contracts open in the market at time of reporting).See CFTC criteria here.


