COT Week 31 Charts: Energy Speculators push bets higher led by Brent Crude Oil & Gasoline

By InvestMacro | COT | Data Tables | COT Leaders | Downloads | COT Newsletter
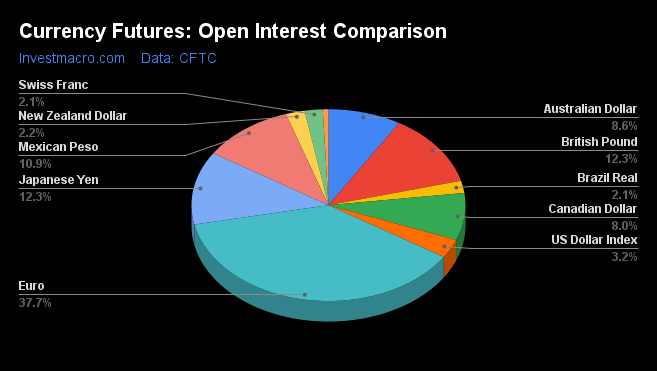
Here are the latest charts and statistics for the Commitment of Traders (COT) data published by the Commodities Futures Trading Commission (CFTC).

The latest COT data is updated through Tuesday August 2nd and shows a quick view of how large traders (for-profit speculators and commercial entities) were positioned in the futures markets.

Weekly Speculator Changes

COT energy market speculator bets were higher this week as four out of the six energy markets we cover had higher positioning this week while the other two markets recorded lower contracts on the week.

Leading the gains for energy markets was Brent Crude Oil (8,700 contracts) with Gasoline (5,414 contracts), Heating Oil (3,384 contracts) and the Bloomberg Commodity Index (3,040 contracts) also showing positive weeks.

The energy markets with declines in speculator bets this week were Natural Gas (-6,683 contracts) and WTI Crude Oil with a week change of -5,508 contracts for the week.


Data Snapshot of Commodity Market Traders | Columns Legend
Aug-02-2022OIOI-IndexSpec-NetSpec-IndexCom-NetCOM-IndexSmalls-NetSmalls-Index
WTI Crude1,606,9103253,7520-272,86610019,11442
Gold459,6492124,32612-135,5659011,2390
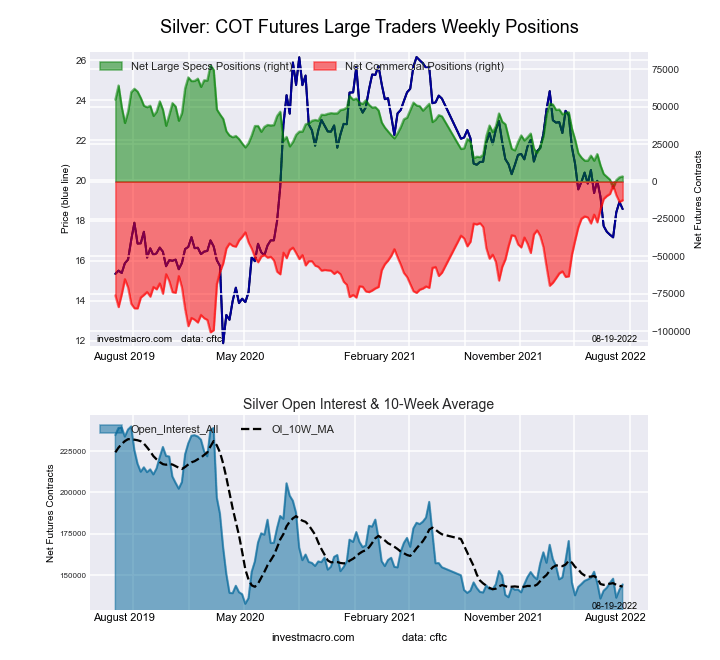
Silver136,26739747-9,064938,0908
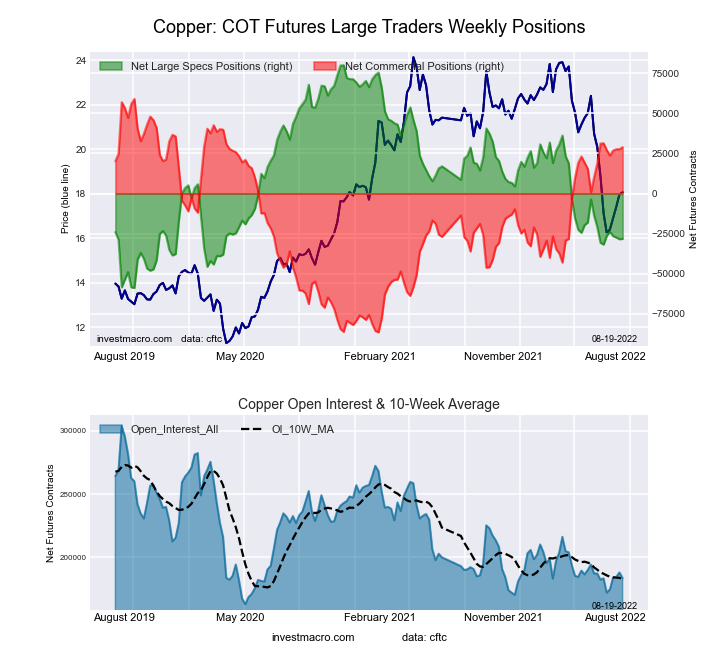
Copper184,44116-27,4062327,67278-26624
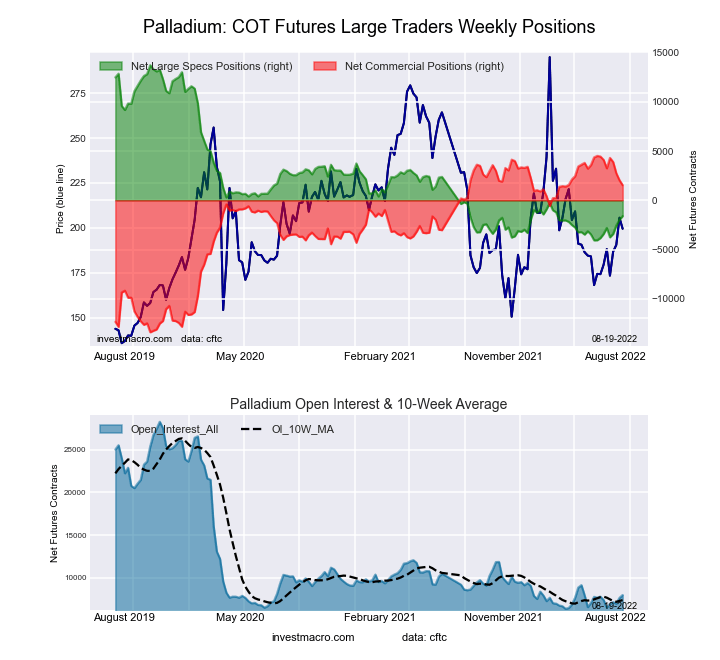
Palladium6,9453-2,56082,74390-18333
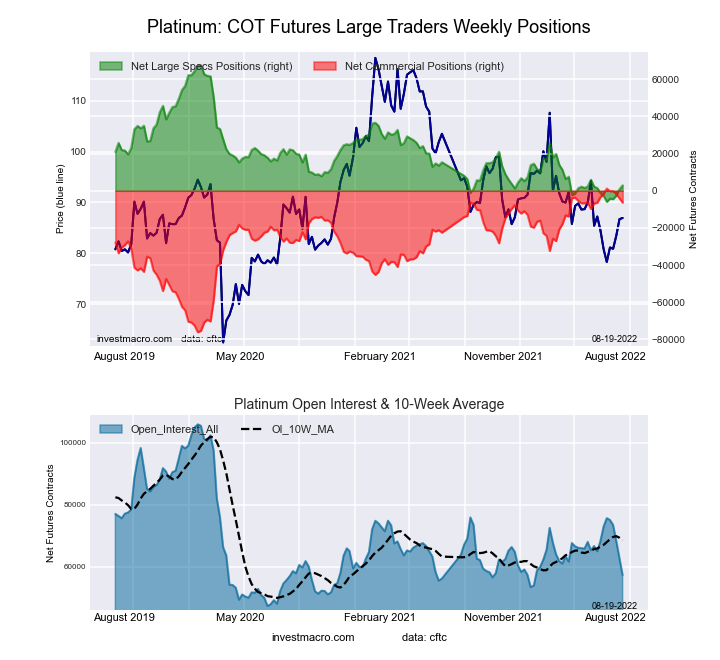
Platinum68,26636-2,5415-1,708964,24921
Natural Gas984,5705-124,9734187,5965837,37769
Brent171,75117-32,7825631,8354694722
Heating Oil276,5202622,06875-35,3893413,32144
Soybeans572,925092,52742-65,63264-26,89526
Corn1,347,8946201,35556-149,43451-51,92113
Coffee207,7401227,28462-27,968446846
Sugar760,0931134,43844-35,229617919
Wheat316,24412-7251810,88875-10,16358


Strength Scores

Strength Scores (a normalized measure of Speculator positions over a 3-Year range, from 0 to 100 where above 80 is extreme bullish and below 20 is extreme bearish) showed that Heating Oil (74.9 percent) leads the energy markets currently and is up from 69.9 percent last week. The Bloomberg Commodity Index (59.2 percent) comes in as the next highest energy market followed by Brent Crude Oil (56.2 percent). On the downside, WTI Crude Oil (0.0 percent) remains at the bottom of its three-year range and is in a bearish extreme level. Gasoline (22.9 percent) comes in as the next lowest followed by Natural Gas (41.1 percent).

Strength Statistics:
WTI Crude Oil (0.0 percent) vs WTI Crude Oil previous week (1.6 percent)
Brent Crude Oil (56.2 percent) vs Brent Crude Oil previous week (41.6 percent)
Natural Gas (41.1 percent) vs Natural Gas previous week (43.1 percent)
Gasoline (22.9 percent) vs Gasoline previous week (17.4 percent)
Heating Oil (74.9 percent) vs Heating Oil previous week (69.9 percent)
Bloomberg Commodity Index (59.2 percent) vs Bloomberg Commodity Index previous week (47.6 percent)

Strength Trends

Strength Score Trends (or move index, calculates the 6-week changes in strength scores) show that the Gasoline (19.5 percent) leads the past six weeks trends for energy this week. Heating Oil (18.4 percent), Brent Crude Oil (8.8 percent) and the Natural Gas (1.8 percent) fill out the other positive movers in the latest trends data. The Bloomberg Commodity Index (-17.5 percent) leads the downside trend scores currently followed by WTI Crude Oil at -10.7 percent.


Strength Trend Statistics:
WTI Crude Oil (-10.7 percent) vs WTI Crude Oil previous week (-13.0 percent)
Brent Crude Oil (8.8 percent) vs Brent Crude Oil previous week (-8.6 percent)
Natural Gas (1.8 percent) vs Natural Gas previous week (1.6 percent)
Gasoline (19.5 percent) vs Gasoline previous week (14.0 percent)
Heating Oil (18.4 percent) vs Heating Oil previous week (15.0 percent)
Bloomberg Commodity Index (-17.5 percent) vs Bloomberg Commodity Index previous week (-28.1 percent)


Individual Markets:

WTI Crude Oil Futures:

WTI Crude Oil Futures COT ChartThe WTI Crude Oil Futures large speculator standing this week resulted in a net position of 253,752 contracts in the data reported through Tuesday. This was a weekly reduction of -5,508 contracts from the previous week which had a total of 259,260 net contracts.

This week’s current strength score (the trader positioning range over the past three years, measured from 0 to 100) shows the speculators are currently Bearish-Extreme with a score of 0.0 percent. The commercials are Bullish-Extreme with a score of 100.0 percent and the small traders (not shown in chart) are Bearish with a score of 41.9 percent.

WTI Crude Oil Futures StatisticsSPECULATORSCOMMERCIALSSMALL TRADERS
– Percent of Open Interest Longs:22.538.44.6
– Percent of Open Interest Shorts:6.755.43.4
– Net Position:253,752-272,86619,114
– Gross Longs:361,810616,74174,356
– Gross Shorts:108,058889,60755,242
– Long to Short Ratio:3.3 to 10.7 to 11.3 to 1
NET POSITION TREND:
– Strength Index Score (3 Year Range Pct):0.0100.041.9
– Strength Index Reading (3 Year Range):Bearish-ExtremeBullish-ExtremeBearish
NET POSITION MOVEMENT INDEX:
– 6-Week Change in Strength Index:-10.715.2-21.6


Brent Crude Oil Futures:

Brent Last Day Crude Oil Futures COT ChartThe Brent Crude Oil Futures large speculator standing this week resulted in a net position of -32,782 contracts in the data reported through Tuesday. This was a weekly gain of 8,700 contracts from the previous week which had a total of -41,482 net contracts.

This week’s current strength score (the trader positioning range over the past three years, measured from 0 to 100) shows the speculators are currently Bullish with a score of 56.2 percent. The commercials are Bearish with a score of 46.2 percent and the small traders (not shown in chart) are Bearish with a score of 22.0 percent.

Brent Crude Oil Futures StatisticsSPECULATORSCOMMERCIALSSMALL TRADERS
– Percent of Open Interest Longs:16.350.34.0
– Percent of Open Interest Shorts:35.431.83.4
– Net Position:-32,78231,835947
– Gross Longs:28,07486,4156,872
– Gross Shorts:60,85654,5805,925
– Long to Short Ratio:0.5 to 11.6 to 11.2 to 1
NET POSITION TREND:
– Strength Index Score (3 Year Range Pct):56.246.222.0
– Strength Index Reading (3 Year Range):BullishBearishBearish
NET POSITION MOVEMENT INDEX:
– 6-Week Change in Strength Index:8.8-7.0-13.7


Natural Gas Futures:

Natural Gas Futures COT ChartThe Natural Gas Futures large speculator standing this week resulted in a net position of -124,973 contracts in the data reported through Tuesday. This was a weekly decline of -6,683 contracts from the previous week which had a total of -118,290 net contracts.

This week’s current strength score (the trader positioning range over the past three years, measured from 0 to 100) shows the speculators are currently Bearish with a score of 41.1 percent. The commercials are Bullish with a score of 58.5 percent and the small traders (not shown in chart) are Bullish with a score of 68.6 percent.

Natural Gas Futures StatisticsSPECULATORSCOMMERCIALSSMALL TRADERS
– Percent of Open Interest Longs:17.740.16.8
– Percent of Open Interest Shorts:30.431.23.0
– Net Position:-124,97387,59637,377
– Gross Longs:174,529394,37166,623
– Gross Shorts:299,502306,77529,246
– Long to Short Ratio:0.6 to 11.3 to 12.3 to 1
NET POSITION TREND:
– Strength Index Score (3 Year Range Pct):41.158.568.6
– Strength Index Reading (3 Year Range):BearishBullishBullish
NET POSITION MOVEMENT INDEX:
– 6-Week Change in Strength Index:1.80.5-17.7


Gasoline Blendstock Futures:

RBOB Gasoline Energy Futures COT ChartThe Gasoline Blendstock Futures large speculator standing this week resulted in a net position of 50,818 contracts in the data reported through Tuesday. This was a weekly increase of 5,414 contracts from the previous week which had a total of 45,404 net contracts.

This week’s current strength score (the trader positioning range over the past three years, measured from 0 to 100) shows the speculators are currently Bearish with a score of 22.9 percent. The commercials are Bullish with a score of 76.4 percent and the small traders (not shown in chart) are Bullish with a score of 55.9 percent.

Nasdaq Mini Futures StatisticsSPECULATORSCOMMERCIALSSMALL TRADERS
– Percent of Open Interest Longs:31.146.87.5
– Percent of Open Interest Shorts:11.069.44.9
– Net Position:50,818-57,2956,477
– Gross Longs:78,784118,68619,000
– Gross Shorts:27,966175,98112,523
– Long to Short Ratio:2.8 to 10.7 to 11.5 to 1
NET POSITION TREND:
– Strength Index Score (3 Year Range Pct):22.976.455.9
– Strength Index Reading (3 Year Range):BearishBullishBullish
NET POSITION MOVEMENT INDEX:
– 6-Week Change in Strength Index:19.5-14.6-27.9


#2 Heating Oil NY-Harbor Futures:

NY Harbor Heating Oil Energy Futures COT ChartThe #2 Heating Oil NY-Harbor Futures large speculator standing this week resulted in a net position of 22,068 contracts in the data reported through Tuesday. This was a weekly boost of 3,384 contracts from the previous week which had a total of 18,684 net contracts.

This week’s current strength score (the trader positioning range over the past three years, measured from 0 to 100) shows the speculators are currently Bullish with a score of 74.9 percent. The commercials are Bearish with a score of 33.6 percent and the small traders (not shown in chart) are Bearish with a score of 44.5 percent.

Heating Oil Futures StatisticsSPECULATORSCOMMERCIALSSMALL TRADERS
– Percent of Open Interest Longs:16.852.714.8
– Percent of Open Interest Shorts:8.865.59.9
– Net Position:22,068-35,38913,321
– Gross Longs:46,505145,84440,829
– Gross Shorts:24,437181,23327,508
– Long to Short Ratio:1.9 to 10.8 to 11.5 to 1
NET POSITION TREND:
– Strength Index Score (3 Year Range Pct):74.933.644.5
– Strength Index Reading (3 Year Range):BullishBearishBearish
NET POSITION MOVEMENT INDEX:
– 6-Week Change in Strength Index:18.4-7.7-18.4


Bloomberg Commodity Index Futures:

Bloomberg Commodity Index Futures COT ChartThe Bloomberg Commodity Index Futures large speculator standing this week resulted in a net position of -12,623 contracts in the data reported through Tuesday. This was a weekly advance of 3,040 contracts from the previous week which had a total of -15,663 net contracts.

This week’s current strength score (the trader positioning range over the past three years, measured from 0 to 100) shows the speculators are currently Bullish with a score of 59.2 percent. The commercials are Bearish with a score of 40.9 percent and the small traders (not shown in chart) are Bearish-Extreme with a score of 18.7 percent.

Bloomberg Index Futures StatisticsSPECULATORSCOMMERCIALSSMALL TRADERS
– Percent of Open Interest Longs:23.574.40.6
– Percent of Open Interest Shorts:42.455.90.2
– Net Position:-12,62312,388235
– Gross Longs:15,79149,891373
– Gross Shorts:28,41437,503138
– Long to Short Ratio:0.6 to 11.3 to 12.7 to 1
NET POSITION TREND:
– Strength Index Score (3 Year Range Pct):59.240.918.7
– Strength Index Reading (3 Year Range):BullishBearishBearish-Extreme
NET POSITION MOVEMENT INDEX:
– 6-Week Change in Strength Index:-17.517.8-2.1


Article By InvestMacroReceive our weekly COT Reports by Email

*COT Report: The COT data, released weekly to the public each Friday, is updated through the most recent Tuesday (data is 3 days old) and shows a quick view of how large speculators or non-commercials (for-profit traders) were positioned in the futures markets.

The CFTC categorizes trader positions according to commercial hedgers (traders who use futures contracts for hedging as part of the business), non-commercials (large traders who speculate to realize trading profits) and nonreportable traders (usually small traders/speculators) as well as their open interest (contracts open in the market at time of reporting).See CFTC criteria here.

COT Week 31 Charts: Stock Market Speculator bets led lower by Russell 2000 & MSCI EAFE Minis

By InvestMacro | COT | Data Tables | COT Leaders | Downloads | COT Newsletter

Here are the latest charts and statistics for the Commitment of Traders (COT) data published by the Commodities Futures Trading Commission (CFTC).

The latest COT data is updated through Tuesday August 2nd and shows a quick view of how large traders (for-profit speculators and commercial entities) were positioned in the futures markets.

Weekly Speculator Changes

COT stock market speculator bets were overall lower this week as just two out of the seven stock markets we cover had higher positioning this week while the other five markets had lower contracts on the week.

Leading the gains for stock markets was the S&P500 Mini (5,750 contracts) and the Dow Jones Industrial Average Mini with a gain of 2,764 contracts.

The stock markets leading the declines in speculator bets this week were the Russell 2000 Mini (-14,743 contracts) and the MSCI EAFE Mini (-14,707 contracts) while the Nasdaq Mini (-7,097 contracts), the VIX (-6,273 contracts) and the Nikkei 225 USD (-245 contracts) also had lower bets on the week.


Data Snapshot of Stock Market Traders | Columns Legend
Aug-02-2022OIOI-IndexSpec-NetSpec-IndexCom-NetCOM-IndexSmalls-NetSmalls-Index
S&P500-Mini2,310,6658-231,88513293,137100-61,25214
Nikkei 22513,4108-4,635553,353461,28244
Nasdaq-Mini262,3255024,71289-9,09421-15,61816
DowJones-Mini72,61931-18,4211422,96090-4,53914
VIX322,60433-98,83860105,97141-7,13357
Nikkei 225 Yen59,868438,3486024,11686-32,4648


Strength Scores

Strength Scores (a normalized measure of Speculator positions over a 3-Year range, from 0 to 100 where above 80 is extreme bullish and below 20 is extreme bearish) showed that the Nasdaq-Mini (88.8 percent) has the highest strength score currently and remains in a bullish extreme position (above 80 percent) although slightly lower from last week (92.8 percent). The VIX (59.8 percent) and the Nikkei USD (55.4 percent) come in as the next highest stocks market in strength scores. On the downside, the Russell 2000-Mini (0.0 percent), the EAFE-Mini (1.9 percent), the S&P500-Mini (13.2 percent) and the DowJones-Mini (13.8 percent) all currently have very weak speculator sentiment and are in bearish extreme positions (below 20 percent).


Strength Statistics:
VIX (59.8 percent) vs VIX previous week (62.9 percent)
S&P500-Mini (13.2 percent) vs S&P500-Mini previous week (12.2 percent)
DowJones-Mini (13.8 percent) vs DowJones-Mini previous week (10.1 percent)
Nasdaq-Mini (88.8 percent) vs Nasdaq-Mini previous week (92.8 percent)
Russell2000-Mini (0.0 percent) vs Russell2000-Mini previous week (8.3 percent)
Nikkei USD (55.4 percent) vs Nikkei USD previous week (56.6 percent)
EAFE-Mini (1.9 percent) vs EAFE-Mini previous week (18.6 percent)

Strength Trends

Strength Score Trends (or move index, calculates the 6-week changes in strength scores) showed that the DowJones-Mini (9.4 percent) is the only stock market that has a positive six week trend for stocks at the moment.  The EAFE-Mini (-35.9 percent) leads the downside trend scores currently while the next lower trend scores were from the VIX (-24.5 percent) followed by the S&P500-Mini (-21.8 percent) and the Nikkei USD (-14.5 percent).


Strength Trend Statistics:
VIX (-24.5 percent) vs VIX previous week (-9.2 percent)
S&P500-Mini (-21.8 percent) vs S&P500-Mini previous week (-50.4 percent)
DowJones-Mini (9.4 percent) vs DowJones-Mini previous week (1.5 percent)
Nasdaq-Mini (-3.4 percent) vs Nasdaq-Mini previous week (1.9 percent)
Russell2000-Mini (-8.1 percent) vs Russell2000-Mini previous week (-5.6 percent)
Nikkei USD (-14.5 percent) vs Nikkei USD previous week (-9.4 percent)
EAFE-Mini (-35.9 percent) vs EAFE-Mini previous week (-24.8 percent)


Individual Markets:

VIX Volatility Futures:

VIX Volatility Futures COT ChartThe VIX Volatility large speculator standing this week resulted in a net position of -98,838 contracts in the data reported through Tuesday. This was a weekly decline of -6,273 contracts from the previous week which had a total of -92,565 net contracts.

This week’s current strength score (the trader positioning range over the past three years, measured from 0 to 100) shows the speculators are currently Bullish with a score of 59.8 percent. The commercials are Bearish with a score of 40.7 percent and the small traders (not shown in chart) are Bullish with a score of 56.8 percent.

VIX Volatility Futures StatisticsSPECULATORSCOMMERCIALSSMALL TRADERS
– Percent of Open Interest Longs:12.262.87.7
– Percent of Open Interest Shorts:42.929.99.9
– Net Position:-98,838105,971-7,133
– Gross Longs:39,442202,54224,811
– Gross Shorts:138,28096,57131,944
– Long to Short Ratio:0.3 to 12.1 to 10.8 to 1
NET POSITION TREND:
– Strength Index Score (3 Year Range Pct):59.840.756.8
– Strength Index Reading (3 Year Range):BullishBearishBullish
NET POSITION MOVEMENT INDEX:
– 6-Week Change in Strength Index:-24.524.5-6.4


S&P500 Mini Futures:

SP500 Mini Futures COT ChartThe S&P500 Mini large speculator standing this week resulted in a net position of -231,885 contracts in the data reported through Tuesday. This was a weekly advance of 5,750 contracts from the previous week which had a total of -237,635 net contracts.

This week’s current strength score (the trader positioning range over the past three years, measured from 0 to 100) shows the speculators are currently Bearish-Extreme with a score of 13.2 percent. The commercials are Bullish-Extreme with a score of 100.0 percent and the small traders (not shown in chart) are Bearish-Extreme with a score of 13.5 percent.

S&P500 Mini Futures StatisticsSPECULATORSCOMMERCIALSSMALL TRADERS
– Percent of Open Interest Longs:10.377.39.6
– Percent of Open Interest Shorts:20.364.612.2
– Net Position:-231,885293,137-61,252
– Gross Longs:237,5941,786,757220,741
– Gross Shorts:469,4791,493,620281,993
– Long to Short Ratio:0.5 to 11.2 to 10.8 to 1
NET POSITION TREND:
– Strength Index Score (3 Year Range Pct):13.2100.013.5
– Strength Index Reading (3 Year Range):Bearish-ExtremeBullish-ExtremeBearish-Extreme
NET POSITION MOVEMENT INDEX:
– 6-Week Change in Strength Index:-21.822.5-6.6


Dow Jones Mini Futures:

Dow Jones Mini Futures COT ChartThe Dow Jones Mini large speculator standing this week resulted in a net position of -18,421 contracts in the data reported through Tuesday. This was a weekly boost of 2,764 contracts from the previous week which had a total of -21,185 net contracts.

This week’s current strength score (the trader positioning range over the past three years, measured from 0 to 100) shows the speculators are currently Bearish-Extreme with a score of 13.8 percent. The commercials are Bullish-Extreme with a score of 89.8 percent and the small traders (not shown in chart) are Bearish-Extreme with a score of 14.2 percent.

Dow Jones Mini Futures StatisticsSPECULATORSCOMMERCIALSSMALL TRADERS
– Percent of Open Interest Longs:22.362.514.1
– Percent of Open Interest Shorts:47.630.920.4
– Net Position:-18,42122,960-4,539
– Gross Longs:16,16145,38510,253
– Gross Shorts:34,58222,42514,792
– Long to Short Ratio:0.5 to 12.0 to 10.7 to 1
NET POSITION TREND:
– Strength Index Score (3 Year Range Pct):13.889.814.2
– Strength Index Reading (3 Year Range):Bearish-ExtremeBullish-ExtremeBearish-Extreme
NET POSITION MOVEMENT INDEX:
– 6-Week Change in Strength Index:9.4-8.0-5.7


Nasdaq Mini Futures:

Nasdaq Mini Futures COT ChartThe Nasdaq Mini large speculator standing this week resulted in a net position of 24,712 contracts in the data reported through Tuesday. This was a weekly decrease of -7,097 contracts from the previous week which had a total of 31,809 net contracts.

This week’s current strength score (the trader positioning range over the past three years, measured from 0 to 100) shows the speculators are currently Bullish-Extreme with a score of 88.8 percent. The commercials are Bearish with a score of 20.9 percent and the small traders (not shown in chart) are Bearish-Extreme with a score of 16.3 percent.

Nasdaq Mini Futures StatisticsSPECULATORSCOMMERCIALSSMALL TRADERS
– Percent of Open Interest Longs:28.657.111.6
– Percent of Open Interest Shorts:19.160.617.6
– Net Position:24,712-9,094-15,618
– Gross Longs:74,918149,77330,452
– Gross Shorts:50,206158,86746,070
– Long to Short Ratio:1.5 to 10.9 to 10.7 to 1
NET POSITION TREND:
– Strength Index Score (3 Year Range Pct):88.820.916.3
– Strength Index Reading (3 Year Range):Bullish-ExtremeBearishBearish-Extreme
NET POSITION MOVEMENT INDEX:
– 6-Week Change in Strength Index:-3.411.4-25.5


Russell 2000 Mini Futures:

Russell 2000 Mini Futures COT ChartThe Russell 2000 Mini large speculator standing this week resulted in a net position of -119,954 contracts in the data reported through Tuesday. This was a weekly decline of -14,743 contracts from the previous week which had a total of -105,211 net contracts.

This week’s current strength score (the trader positioning range over the past three years, measured from 0 to 100) shows the speculators are currently Bearish-Extreme with a score of 0.0 percent. The commercials are Bullish-Extreme with a score of 99.7 percent and the small traders (not shown in chart) are Bearish-Extreme with a score of 16.6 percent.

Russell 2000 Mini Futures StatisticsSPECULATORSCOMMERCIALSSMALL TRADERS
– Percent of Open Interest Longs:5.589.53.5
– Percent of Open Interest Shorts:27.167.34.1
– Net Position:-119,954123,483-3,529
– Gross Longs:30,724497,84419,324
– Gross Shorts:150,678374,36122,853
– Long to Short Ratio:0.2 to 11.3 to 10.8 to 1
NET POSITION TREND:
– Strength Index Score (3 Year Range Pct):0.099.716.6
– Strength Index Reading (3 Year Range):Bearish-ExtremeBullish-ExtremeBearish-Extreme
NET POSITION MOVEMENT INDEX:
– 6-Week Change in Strength Index:-8.18.1-3.8


Nikkei Stock Average (USD) Futures:

Nikkei Stock Average (USD) Futures COT ChartThe Nikkei Stock Average (USD) large speculator standing this week resulted in a net position of -4,635 contracts in the data reported through Tuesday. This was a weekly fall of -245 contracts from the previous week which had a total of -4,390 net contracts.

This week’s current strength score (the trader positioning range over the past three years, measured from 0 to 100) shows the speculators are currently Bullish with a score of 55.4 percent. The commercials are Bearish with a score of 46.4 percent and the small traders (not shown in chart) are Bearish with a score of 44.4 percent.

Nikkei Stock Average Futures StatisticsSPECULATORSCOMMERCIALSSMALL TRADERS
– Percent of Open Interest Longs:8.860.829.8
– Percent of Open Interest Shorts:43.335.820.3
– Net Position:-4,6353,3531,282
– Gross Longs:1,1788,1514,002
– Gross Shorts:5,8134,7982,720
– Long to Short Ratio:0.2 to 11.7 to 11.5 to 1
NET POSITION TREND:
– Strength Index Score (3 Year Range Pct):55.446.444.4
– Strength Index Reading (3 Year Range):BullishBearishBearish
NET POSITION MOVEMENT INDEX:
– 6-Week Change in Strength Index:-14.56.123.0


MSCI EAFE Mini Futures:

MSCI EAFE Mini Futures COT ChartThe MSCI EAFE Mini large speculator standing this week resulted in a net position of -31,514 contracts in the data reported through Tuesday. This was a weekly fall of -14,707 contracts from the previous week which had a total of -16,807 net contracts.

This week’s current strength score (the trader positioning range over the past three years, measured from 0 to 100) shows the speculators are currently Bearish-Extreme with a score of 1.9 percent. The commercials are Bullish-Extreme with a score of 100.0 percent and the small traders (not shown in chart) are Bullish with a score of 64.8 percent.

MSCI EAFE Mini Futures StatisticsSPECULATORSCOMMERCIALSSMALL TRADERS
– Percent of Open Interest Longs:4.991.42.9
– Percent of Open Interest Shorts:12.784.91.6
– Net Position:-31,51426,2695,245
– Gross Longs:20,008370,69811,622
– Gross Shorts:51,522344,4296,377
– Long to Short Ratio:0.4 to 11.1 to 11.8 to 1
NET POSITION TREND:
– Strength Index Score (3 Year Range Pct):1.9100.064.8
– Strength Index Reading (3 Year Range):Bearish-ExtremeBullish-ExtremeBullish
NET POSITION MOVEMENT INDEX:
– 6-Week Change in Strength Index:-35.933.229.5


Article By InvestMacroReceive our weekly COT Reports by Email

*COT Report: The COT data, released weekly to the public each Friday, is updated through the most recent Tuesday (data is 3 days old) and shows a quick view of how large speculators or non-commercials (for-profit traders) were positioned in the futures markets.

The CFTC categorizes trader positions according to commercial hedgers (traders who use futures contracts for hedging as part of the business), non-commercials (large traders who speculate to realize trading profits) and nonreportable traders (usually small traders/speculators) as well as their open interest (contracts open in the market at time of reporting).See CFTC criteria here.

The cryptocurrency market digest (BTC). Overview for 05.08.2022

Article By RoboForex.com

After several failed attempts, the BTC is trying to rise once again. As a result, major crypto has been “in the red” for seven consecutive trading sessions, and here’s another attempt to correct that. On Friday, the BTC is looking rather neutral and trading at $23,244.

The struggle between bulls and bears continues as they keep the BTC inside the range of $22,500-$23,500. Nothing will change here until the price breaks either border of the range.

The “greenback” behaviour helps the BTC one day and upsets it the next day. When the USD gets weaker, the BTC goes up, just like today. However, local upward movements in the American currency brought the BTC’s feeble attempts to rise to naught.

Franck Muller accepts payments in BNB

Swiss company Franck Muller, which is involved in selling watches, started accepting payments for its goods in crypto, BNB in particular. Earlier, an auction was completed on the Binance NFT trading platform. The fact that the crypto can be used in real life is good for its price.

ZB was hacked

Crypto exchange ZB was hacked and lost $4.7 million worth cryptocurrency. Daily trading volume at the exchange is estimated at $1.1 billion; it ranks 47th on the list of crypto platforms.

Nomad Bridge managed to get crypto back

Hackers returned $9 million in cryptocurrency they stole after hacking Nomad bridge. They sent it back to a special wallet created for these purposes. Some part of this money came from popular ENS addresses. We remind you that Nomad Bridge was hacked on 1 August.

Article By RoboForex.com

Attention!
Forecasts presented in this section only reflect the author’s private opinion and should not be considered as guidance for trading. RoboForex LP bears no responsibility for trading results based on trading recommendations described in these analytical reviews.

Murrey Math Lines 05.08.2022 (Brent, S&P 500)

Article By RoboForex.com

BRENT

As we can see in the H4 chart, Brent is trading within the “oversold area”. In this case, the price is expected to break -1/8 and continue moving upwards to reach the resistance at 1/8. However, this scenario may no longer be valid if the asset breaks the support at -2/8 to the downside. After that, the lines in the chart will be redrawn, thus helping us to define new downside targets.

BRENTH4
Risk Warning: the result of previous trading operations do not guarantee the same results in the future

In the M15 chart, the pair may break the upside line of the VoltyChannel indicator and, as a result, continue its growth.

BRENT_M15
Risk Warning: the result of previous trading operations do not guarantee the same results in the future

S&P 500

As we can see in the H4 chart, the S&P Index is still trading below the 200-day Moving Average to indicate a descending tendency. In this case, the price is expected to test 2/8, break it, and then continue falling towards the support at 1/8. However, this scenario may no longer be valid if the asset breaks the resistance at 3/8 to the upside. After that, the instrument may reverse and grow to reach the next resistance at 5/8.

S&P 500_H4
Risk Warning: the result of previous trading operations do not guarantee the same results in the future

In the M15 chart, the pair may break the downside line of the VoltyChannel indicator and, as a result, continue trading downwards.

S&P 500_M15

Article By RoboForex.com

Attention!
Forecasts presented in this section only reflect the author’s private opinion and should not be considered as guidance for trading. RoboForex LP bears no responsibility for trading results based on trading recommendations described in these analytical reviews.

Week Ahead: Persistent inflation to revive Dollar bulls?

By ForexTime

Inflation angst could make its jarring presence felt once more, as the upcoming US inflation data release holds court amidst the coming week’s global economic calendar:

Monday, August 8

  • AUD: Australia July foreign reserves
  • NZD: New Zealand 3Q 2-year inflation expectation

Tuesday, August 9

  • AUD: Australia July household spending, August consumer confidence
  • Coinbase 2Q earnings

Wednesday, August 10

  • CNH: China July CPI, PPI
  • USD: US July consumer price index (CPI), speeches by Chicago Fed President Charles Evans, Minneapolis Fed President Neel Kashkari
  • US crude: EIA weekly oil inventory report
  • Disney 2Q earnings

Thursday, August 11

  • AUD: Australia August consumer inflation expectations
  • USD: US weekly jobless claims, July PPI, speech by San Francisco Fed President Mary Daly

Friday, August 12

  • GBP: UK June GDP, industrial production; 2Q GDP, external trade
  • EUR: Eurozone June industrial production
  • USD: US August consumer sentiment


For the US July consumer price index (CPI), the median estimate from the Bloomberg survey comes in at 8.8%.

If so, that would mark a moderation in the headline inflation print from June’s 9.1%, after four consecutive months of the headline CPI print exceeding market forecasts.

Signs of easing inflationary pressures may allow the US Federal Reserve to start backing off from its aggressive rate-hiking stance, having already raised interest rates by a cumulative 225 basis points since March.

Markets are expecting just another 100 basis points to go in this ongoing rate hike cycle, before the Fed then reversing course by mid-2023 to avoid tipping the US economy into a recession.

In other words, markets think that the “largest chunks” of the Fed’s hiking cycle are already behind us.

Such a narrative has put the US dollar in the back seat in recent weeks, in turn allowing risk assets such as stocks and cryptos to stage a recovery.

(Note that such expectations may alter significantly later today – Friday, August 5th – given that this article is being written before the release of the July US nonfarm payrolls report).


US dollar pulls away from multi-year high

Since posting a 2-year high on July 14th, the equally-weighted US dollar index has faltered back to its 50-day simple moving average (SMA).

This USD index measures the US dollar’s performance against six other major currencies, all in equal proportions:

  • NZDUSD
  • USDCAD
  • GBPUSD
  • USDCHF
  • AUDUSD
  • EURUSD


How might the upcoming US CPI print impact the dollar?

A lower-than-expected CPI print may prompt this USD index to fall below its 50-day SMA and test the 1.16832 – 1.17090, being its recent cycle low and a key Fibonacci retracement line since its ascent from early April.

Otherwise, a fifth-consecutive upside surprise in the official CPI data, that forces markets to restore their bets for more larger-than-usual Fed rate hikes in the pipeline, may see the USD index climbing back above its 50-day SMA.

Immediate resistance can be seen around the 1.18913 Fibonacci level, with stronger resistance set to arrive at the “twin peaks” around 1.195.

Pay attention also to the roster of Fed speak in the coming week, which may offer greater insights into how Fed officials interpret the path forward for US interest rates.

Fresh meaningful insights into the path forward for US interest rates are set to sway the greenback, which in turn would reverberate across the FX universe.


Forex-Time-LogoArticle by ForexTime

ForexTime Ltd (FXTM) is an award winning international online forex broker regulated by CySEC 185/12 www.forextime.com


The Analytical Overview of the Main Currency Pairs on 2022.08.05

By JustForex

The EUR/USD currency pair

Technical indicators of the currency pair:
  • Prev Open: 1.0159
  • Prev Close: 1.0245
  • % chg. over the last day: +0.84%

An important report on US Nonfarm Payrolls will be released today. Economists expect the US economy to have added about 250,000 jobs in July, up from 372,000 the previous month. The jobs report will also serve as an overview of the likely path of monetary policy action by the Federal Reserve, as the Сentral Bank emphasized the strength of the labor market as evidence that the economy remains resilient and able to withstand further rate hikes.

Trading recommendations
  • Support levels: 1.0196, 1.0112, 1.0035, 1.0000
  • Resistance levels: 1.0245, 1.0264, 1.0284, 1.0365, 1.0415, 1.050

From the technical point of view, the trend on the EUR/USD currency pair on the hourly time frame is bullish. The price is still forming a wide volatile balance with the borders of 1.0112-1.0284. Buyer pressure increased significantly over yesterday. The MACD indicator became positive again. Under such market conditions, buy trades are best sought on intraday time frames from the support level of 1.0196. Sell trades can be considered from the resistance level of 1.0245 or 1.0264, but only after additional confirmation and only with short targets.

Alternative scenario: if the price breaks down through the 1.0112 support level and fixes below, the downtrend will likely resume.

EUR/USD
News feed for 2022.08.05:
  • – German Industrial Production (m/m) at 09:00 (GMT+3);
  • – US Nonfarm Payrolls (m/m) at 15:30 (GMT+3);
  • – US Unemployment Rate (m/m) at 15:30 (GMT+3).

The GBP/USD currency pair

Technical indicators of the currency pair:
  • Prev Open: 1.2135
  • Prev Close: 1.2158
  • % chg. over the last day: +0.19%

The Bank of England raised the interest rate by 0.5% as expected. The rate is now at the level of 1.75%, higher than the ECB (0.5%) but lower than the US Federal Reserve (2.5%), the Canadian central bank (2.5%), and the Reserve Bank of New Zealand (2.5%). Normally when the interest rate rises, the national rate strengthens. Still, as mentioned earlier, the rate hike scenario was already built into the price movement, so the focus was on the Bank of England statement. Having produced the largest rate hike in nearly 30 years, the Bank of England suggested that it may be less decisive in raising rates in the coming months. The report also indicated that the UK would be in recession for more than a year under skyrocketing inflation, which caused traders to sell off the British currency yesterday.

Trading recommendations
  • Support levels: 1.2114, 1.2114, 1.2063, 1.1907, 1.1803
  • Resistance levels: 1.2167, 1.2209, 1.2294

From the technical point of view, the trend on the GBP/USD currency pair on the hourly time frame is bullish. The price is now balanced and trading between the moving averages. The MACD indicator has become inactive. Under such market conditions, it is better to look for buy trades on the intraday time frames from the support level of 1.2114, but only with confirmation. Sell trades can be considered from the resistance level of 1.2167, but only after additional confirmation and with short targets.

Alternative scenario: if the price breaks down through the 1.2063 support level and fixes below, the downtrend will likely resume.

GBP/USD
There is no news feed for today.

The USD/JPY currency pair

Technical indicators of the currency pair:
  • Prev Open: 133.85
  • Prev Close: 132.92
  • % chg. over the last day: -0.70%

A Reuters poll of strategists showed that 61% of participants believe that the rise in the Japanese yen against the US dollar since mid-July has been temporary. According to analysts, the yen is unlikely to strengthen in the short term as the Bank of Japan remains the exception among global central banks with its ultra-easy monetary policy. At the same time, the US Federal Reserve raises interest rates and will not complete its increases cycle until 2023.

Trading recommendations
  • Support levels: 132.85, 132.12, 131.37, 130.85
  • Resistance levels: 134.05, 135.29, 136.03, 137.11

From the technical point of view, the medium-term trend on the USD/JPY currency pair is bearish. But now the price has corrected to the average lines and is forming a balance. The MACD indicator has become inactive. Under such market conditions, buy trades can be sought from the support level of 132.85, but with additional confirmation. Resistance levels of 134.05 may be considered for sell deals, but only with additional confirmation and short targets.

Alternative scenario: If the price fixes above 135.29, the uptrend will likely resume.

USD/JPY
There is no news feed for today.

The USD/CAD currency pair

Technical indicators of the currency pair:
  • Prev Open: 1.2838
  • Prev Close: 1.2863
  • % chg. over the last day: +0.19%

Canada’s trade surplus widened in June, but the Canadian dollar fell yesterday amid falling oil prices. The Canadian dollar is a commodity currency as oil is one of Canada’s main exports. Therefore, the Canadian currency is under pressure as a wave of sales has swept the crude oil markets. With crude oil inventories rising as the summer auto season draws close, investors are betting that oil prices could fall further in the coming months, negatively affecting the Canadian (USD/CAD rise).

Trading recommendations
  • Support levels: 1.2832, 1.2803, 1.2786
  • Resistance levels: 1.2871, 1.2929, 1.3006, 1.3085, 1.3154

In terms of technical analysis, the USD/CAD currency pair trend is bearish. At the moment, the price is forming a wide balance. The MACD indicator became positive, and there was an initiative of buyers. Under such market conditions, it is better to consider sell deals from the resistance level of 1.2871 but with confirmation. Buy trades should be considered on the lower time frames from the support level of 1.2832, but only with confirmation and short targets.

Alternative scenario: if the price breaks out and consolidates above the 1.2929 resistance level, the uptrend will likely resume.

USD/CAD
News feed for 2022.08.05:
  • – Canada Unemployment Rate (m/m) at 15:30 (GMT+3);
  • – Canada Ivey PMI (m/m) at 17:00 (GMT+3).

By JustForex


This article reflects a personal opinion and should not be interpreted as an investment advice, and/or offer, and/or a persistent request for carrying out financial transactions, and/or a guarantee, and/or a forecast of future events.

RBA raises inflation forecasts. Oil fell below $90 a barrel for the first time since February

By JustForex

The US stock indices traded without a single trend. At the close of trading yesterday, the Dow Jones Index (US30) decreased by 0.26%, while the S&P 500 Index (US500) lost 0.08%. The NASDAQ Technology Index (US100) added 0.41%.

The US Labor Department reported yesterday that about 260,000 people filed unemployment claims during the previous week, 6,000 more than the previous week. The Nonfarm Payrolls report today will also serve as an overview of the Federal Reserve’s likely path for monetary policy, as the Central Bank emphasized labor market strength as evidence that the economy remains resilient and capable of resisting further rate hikes.

Fed spokeswoman Loretta Mester said yesterday that she would like to see the rate rise to just above 4% at the end of the interest rate cycle. However, analysts predict that the Fed will stop at 3.5-3.75%. Mester added that the Fed could raise rates by 75 bps in September, but it could well be 50 bps, with the Committee guided by inflation and labor market data.

Coinbase stock jumped more than 40% yesterday. The cryptocurrency exchange announced a partnership agreement with BlackRock (BLK) to provide institutional clients access to cryptocurrency trading and storage services.

Stock markets in Europe were mostly up on Thursday. German DAX (DE30) gained 0.55%, French CAC 40 (FR40) jumped by 0.64%, Spanish IBEX 35 (ES35) added 0.23%, British FTSE 100 (UK100) closed on the rise by 0.03%.

The Bank of England raised its interest rate by 0.5% as expected. The rate is now at 1.75%, higher than the ECB (0.5%) but lower than the US Federal Reserve (2.5%), the Canadian Central Bank (2.5%), and the Reserve Bank of New Zealand (2.5%). Having made its most significant rate hike in nearly 30 years, the Bank of England suggested that it may be less decisive in raising rates in the coming months. The report also indicates that under the weight of skyrocketing inflation, the UK will be in recession for more than a year.

Russia is beginning to drag out the process of launching the Nord Stream 1 pipeline. Moscow is demanding additional documents confirming that the equipment used in the repairs is not subject to sanctions. Thus, the energy problems in Europe are exacerbated.

On Thursday, US crude oil prices fell below $90 a barrel for the first time since Russia invaded Ukraine. The drop to its lowest level since February was driven by lingering fears that global growth slow would hurt oil demand. Fears of a recession intensified after the Bank of England warned of a prolonged recession and expectations of a one-year recession.

Saudi Arabia and the UAE are ready to provide a “significant increase” in oil production only if winter’s global supply crisis worsens.

Gold prices reached their highest level a month after rising more than 1.5% yesterday. A weaker dollar helped support gold even as US Treasury yields rose.

Asian markets traded higher yesterday. Japan’s Nikkei 225 (JP225) gained 0.69%, Hong Kong’s Hang Seng (HK50) jumped by 2.06%, and Australia’s S&P/ASX 200 (AU200) was down by 0.01%. Asian stock indices rebounded strongly after several declines, as strong earnings reports in the US boosted optimism about the corporate outlook. Investors in the region are preparing for a slew of earnings reports next week from Chinese, Japanese, and South Korean companies.

The Monetary Policy report from the RBA showed that Australia’s economy would slow down sharply soon due to a sharp rise in inflation. A full percentage point cut economic growth forecasts for this year to 3.25%, and for 2023 and 2024 by about a quarter point to 1.75%. The inflation forecast has also increased from 5.9% to 7.75%, requiring further interest rate increases.

S&P 500 (F) (US500) 4,152.02 −3.15 (−0.076%)

Dow Jones (US30) 32,727.19 −85.31 (−0.26%)

DAX (DE40) 13,662.68 +75.12 (+0.55%)

FTSE 100 (UK100) 7,448.06 +2.38 (+0.032%)

USD Index 105.69 −0.81 (−0.76%)

Important events for today:
  • – Australia RBA Monetary Policy Statement (m/m) at 04:30 (GMT+3);
  • – German Industrial Production (m/m) at 09:00 (GMT+3);
  • – US Nonfarm Payrolls (m/m) at 15:30 (GMT+3);
  • – US Unemployment Rate (m/m) at 15:30 (GMT+3);
  • – Canada Unemployment Rate (m/m) at 15:30 (GMT+3);
  • – Canada Ivey PMI (m/m) at 17:00 (GMT+3).

By JustForex


This article reflects a personal opinion and should not be interpreted as an investment advice, and/or offer, and/or a persistent request for carrying out financial transactions, and/or a guarantee, and/or a forecast of future events.

If all the vehicles in the world were to convert to electric, would it be quieter?

By Erica D. Walker, Brown University 

Curious Kids is a series for children of all ages. If you have a question you’d like an expert to answer, send it to [email protected].


If all of the vehicles in the world were to convert to electric, would it be quieter? – Joseph, age 10, Chatham, New Jersey


If everyone everywhere received a free electric vehicle at the same time – and owners were required to travel at really slow speeds across well-maintained roads – the world would sound different.

But that doesn’t mean it would be quieter.

People can have different feelings about the same sound. As the founder of Community Noise Lab at Brown University’s School of Public Health, I am particularly interested in how we, as humans, decide what is a sound and what is a noise – which is what we call unwanted sounds. We perceive the sounds that we experience in our daily lives in many ways, from quiet to loud. And they can make us feel happy, angry or many things in between.

These feelings can affect our health by relaxing or stressing us. Studies also show that chronic exposure to noise can affect your sleep and hearing and contribute to health problems like heart disease.

How loud are cars?

We know that gasoline-powered cars make a lot of noise, especially on highways where they can travel at high speeds. In 1981, the U.S. Environmental Protection Agency estimated that nearly 100 million people nationwide were exposed to traffic noise every year that was loud enough to be harmful to their health. At the time, this was about 50% of the U.S. population.

Many factors influence how loud a car is on the road, including its design, how fast it travels and physical road conditions. On average, cars moving at around 30 mph on local roads will produce sound levels ranging from 33 to 69 decibels. That’s the range between a quiet library and a loud dishwasher.

This video compares the decibel levels produced by loud, moderate and quiet dishwashers.

For cars traveling at typical speeds on the interstate, which is around 70 mph, sound levels range up to 89 decibels. That’s equivalent to two people shouting their conversation at each other.

Electric and hybrid gas/electric cars emit very low sounds at low speeds because they don’t have internal combustion engines producing noise and vibrations. To ensure that pedestrians will hear electric and hybrid vehicles coming, the National Highway Traffic Safety Administration requires these vehicles to emit sounds ranging from 43 to 64 decibels when they are moving at less than 18.6 mph. Each manufacturer uses its own warning sounds.

At high speeds, there may not be much difference between gas-powered cars and EVs or hybrids. That’s because other factors like tire and wind noise become louder as cars move faster.

Urban noise is a serious health threat worldwide, and the main source is motor vehicles.

Quieter streets for everyone

Infrastructure also contributes to street noise. Cracks, depressions and holes in roads can increase sound levels as cars travel across them.

Lower-income communities tend to have poorer-quality streets and highways. So failing to fix roads could drown out any improvements in a community’s soundscape from EVs, quite literally.

Another way to reduce traffic noise would be to build more bike lanes and paths in less-wealthy communities, which often lack them, and encourage people to substitute this cheaper, healthier, cleaner and quieter mode of transportation when they can.

Electric vehicles are still out of reach for many people because most models cost more than gas-powered cars. So in reality, the benefits of switching to electric-powered vehicles – such as lower fuel costs, cleaner air and somewhat quieter streets – are going now mainly to people who live in wealthier communities and can afford EVs.

That inequitable distribution of benefits is what the EPA calls an environmental injustice: a situation in which everyone doesn’t have the same degree of protection from environmental and health hazards. To share those benefits more equally, electric vehicles will have to become as affordable as gas-powered versions.

Many people think of noise as a nuisance that’s less urgent than other, more pressing environmental issues like air and water pollution. As a result, governments fail to plan for noise, measure it, mitigate it or regulate it in any meaningful way.

In fact, noise is a significant environmental stressor that negatively affects everyone’s health and well-being, especially those who are most vulnerable. At Community Noise Lab, we aim to shed light on the public health implications of noise, argue for more holistic measurements of sound, and study noise together with other environmental pollutants like water and air pollution, working alongside vulnerable communities across the United States.


Hello, curious kids! Do you have a question you’d like an expert to answer? Ask an adult to send your question to [email protected]. Please tell us your name, age and the city where you live.

And since curiosity has no age limit – adults, let us know what you’re wondering, too. We won’t be able to answer every question, but we will do our best.The Conversation

About the Author:

Erica D. Walker, Assistant Professor of Epidemiology, Brown University

This article is republished from The Conversation under a Creative Commons license. Read the original article.


What are automotive ‘over-the-air’ updates? A marketing professor explains

By Vivek Astvansh, Indiana University 

Whenever automakers discover that a vehicle has a defect or does not comply with U.S. laws, they must notify the National Highway Traffic Safety Administration and mail a notice to each customer who owns or leases the affected vehicles. Automakers must also recall those cars, trucks or SUVs – which means they have to fix the defect across the entire fleet.

People with recalled vehicles usually have to schedule a visit to an authorized dealership, where a mechanic repairs the car.

But vehicles are increasingly high-tech contraptions. Although most recalls still require the replacement or repair of auto parts, such as air bags or brakes, a growing number of issues are resolved without any help from a mechanic.

All they require is an “over-the-air update.” That’s the technical term for what happens when you update any software program used by a device, whether’s it’s a smartphone or a sedan.

Over-the-air updates are especially common for vehicles that run fully or partially on electricity instead of gasoline or another fuel. These digital recalls require little or no effort. For example, Tesla regularly fixes its cars by updating its software. Its drivers often don’t have to do a thing. In other cases, a Tesla owner simply has to tap a few buttons on the car’s touchscreen.

According to the law, it doesn’t matter if safety-related fixes demand a software upgrade or a trip to the dealership. Either way, notifying the National Highway Traffic Safety Administration and all affected drivers is mandatory.

Why over-the-air updates matter

Electric vehicle sales nearly doubled from about 300,000 in 2020 to more than 600,000 in 2021. EV sales rose another 76% in first quarter of 2022 even as sales of all new vehicles dropped by 15.7%.

U.S. EV sales could be on the verge of far more growth, which would make over-the-air updates increasingly common. But drivers and investors are raising an array of safety concerns that could put the brakes on the EV market’s expansion.

Serious problems have included electric vehicles failing to start, losing power and catching fire because of battery defects.

Musk objects to the word ‘recall’

Tesla has pushed harder than its competitors to rely primarily on over-the-air updates to fix problems with its electric vehicles. Its CEO, Elon Musk, has for years publicly questioned the wisdom of calling over-the-air updates “recalls.”

In some cases, Tesla has conducted over-the-air updates to resolve safety defects without notifying the National Highway Traffic Safety Administration or Tesla owners that a recall was underway.

Because that’s against the law, the agency has ordered Tesla to provide those details.

Tesla has used over-the-air updates to resolve, for example, issues with its windshield wipers and seat belt chimes. It has also used over-the-air updates to address problems with its partially automated driving systems. Those features are the subject of a government investigation because of a spate of crashes with parked emergency vehicles in which first responders were using warning signs, such as flashing lights or flares.The Conversation

About the Author:

Vivek Astvansh, Professor of Marketing and Data Science, Indiana University

This article is republished from The Conversation under a Creative Commons license. Read the original article.


Ichimoku Cloud Analysis 04.08.2022 (GBPUSD, USDCHF, USDJPY)

Article By RoboForex.com

GBPUSD, “Great Britain Pound vs US Dollar”

GBPUSD is correcting inside the bullish channel. The instrument is currently moving above Ichimoku Cloud, thus indicating an ascending tendency. The markets could indicate that the price may test the cloud’s upside border at 1.2130 and then resume moving upwards to reach 1.2435. Another signal in favour of a further uptrend will be a rebound from the rising channel’s downside border. However, the bullish scenario may no longer be valid if the price breaks the cloud’s downside border and fixes below 1.2020. In this case, the pair may continue falling towards 1.1925.

GBPUSD
Risk Warning: the result of previous trading operations do not guarantee the same results in the future

USDCHF, “US Dollar vs Swiss Franc”

USDCHF is no longer moving within the bullish channel. The instrument is currently moving inside Ichimoku Cloud, thus indicating a sideways tendency. The markets could indicate that the price may test the cloud’s downside border at 0.9585 and then resume moving upwards to reach 0.9795. Another signal in favour of a further uptrend will be a rebound from the descending channel’s upside border. However, the bullish scenario may no longer be valid if the price breaks the cloud’s downside border and fixes below 0.9485. In this case, the pair may continue falling towards 0.9390. To confirm a further uptrend, the price must break the cloud’s upside and fix above 0.9657.

USDCHF
Risk Warning: the result of previous trading operations do not guarantee the same results in the future

USDJPY, “US Dollar vs Japanese Yen”

USDJPY is rebounding from Tenkan-Sen and Kijun-Sen. The instrument is currently moving above Ichimoku Cloud, thus indicating an ascending tendency. The markets could indicate that the price may test the cloud’s upside border at 133.10 and then resume moving upwards to reach 137.60. Another signal in favour of a further uptrend will be a rebound from the rising channel’s downside border. However, the bullish scenario may no longer be valid if the price breaks the cloud’s downside border and fixes below 131.95. In this case, the pair may continue falling towards 130.90.

USDJPY

Article By RoboForex.com

Attention!
Forecasts presented in this section only reflect the author’s private opinion and should not be considered as guidance for trading. RoboForex LP bears no responsibility for trading results based on trading recommendations described in these analytical reviews.