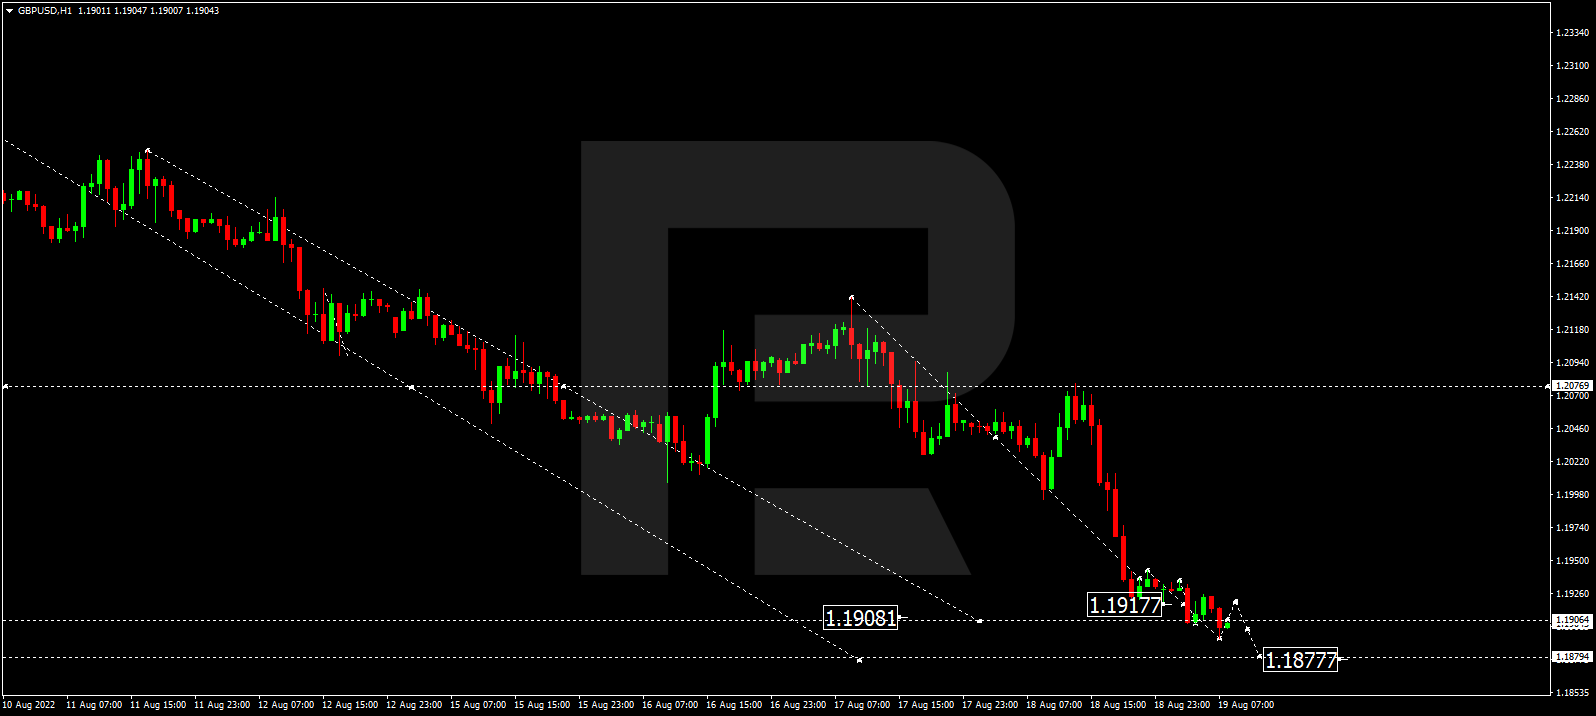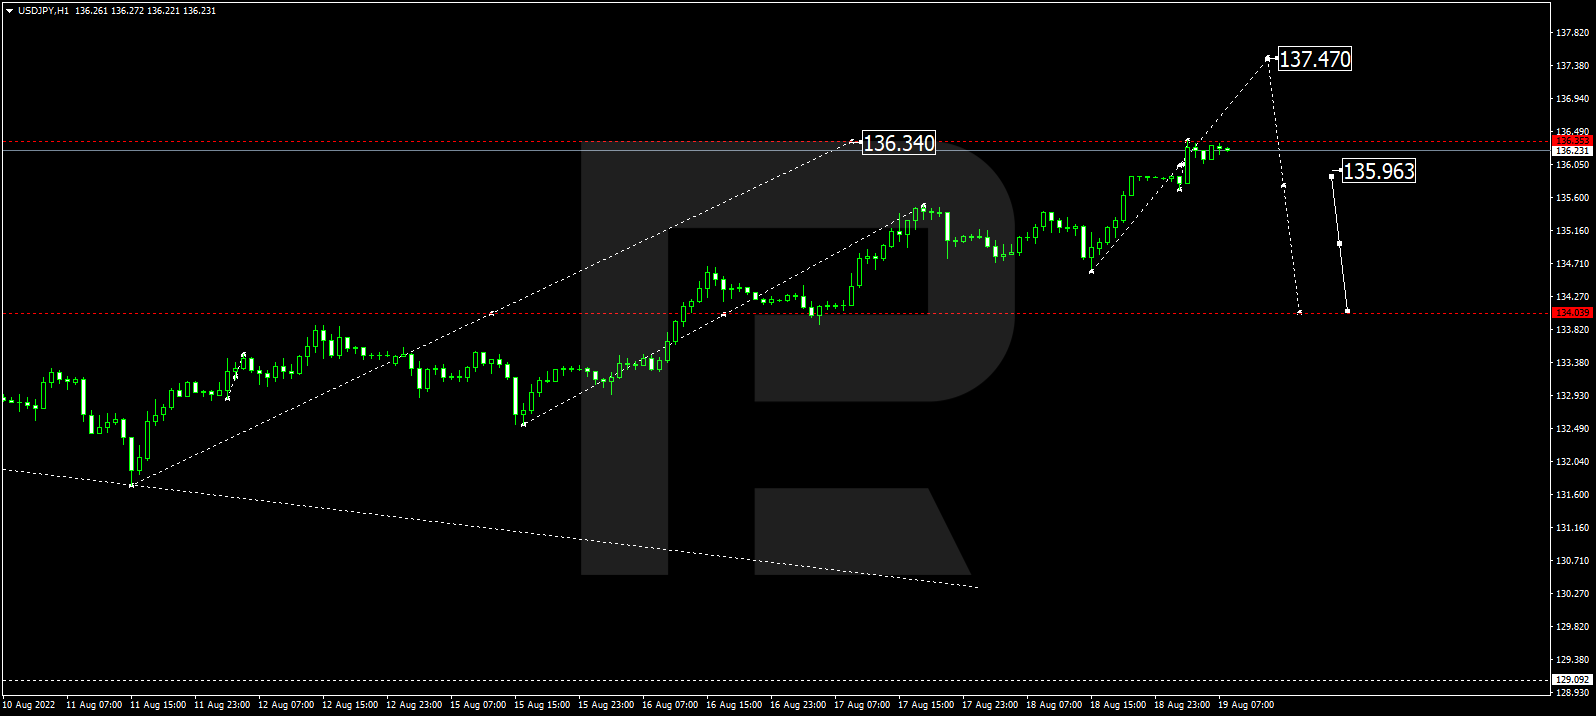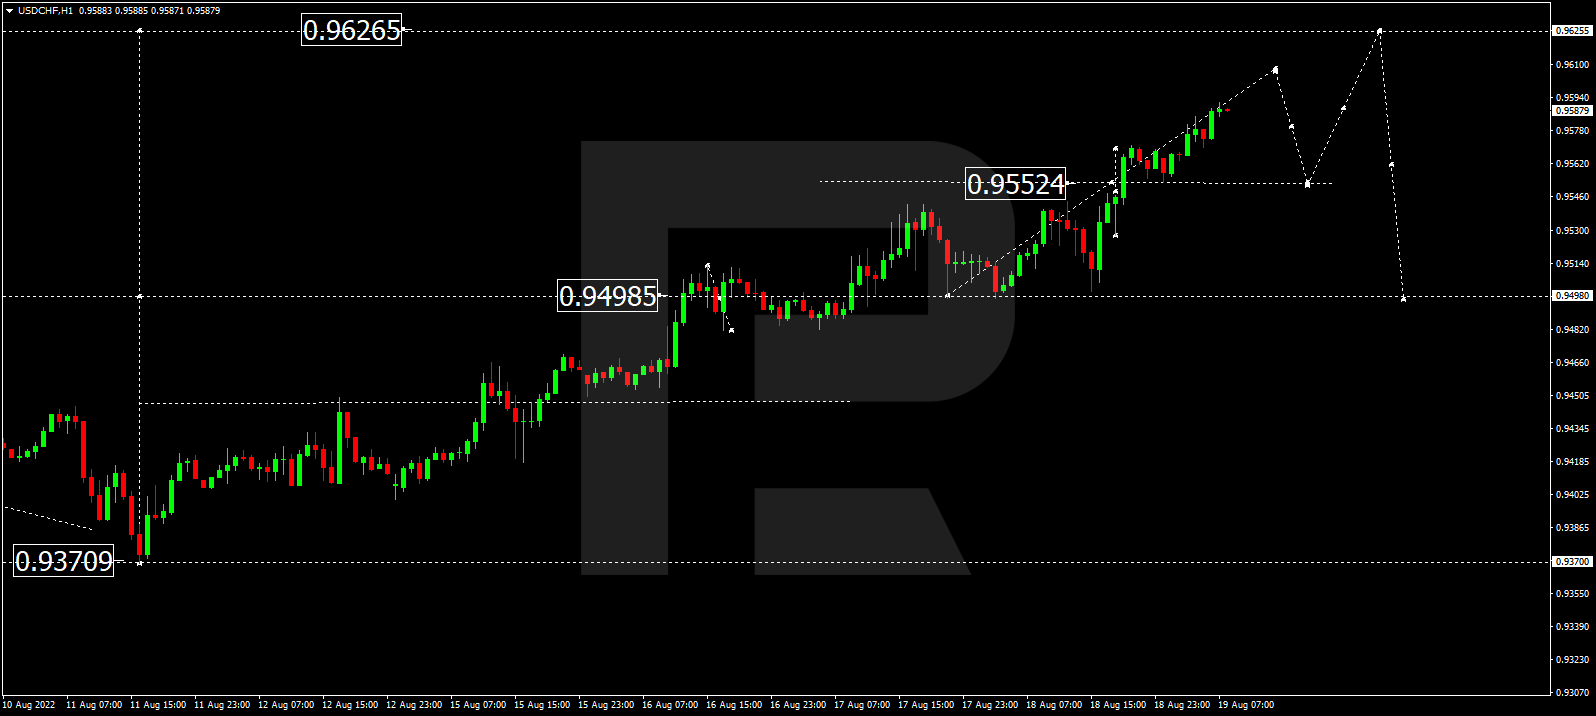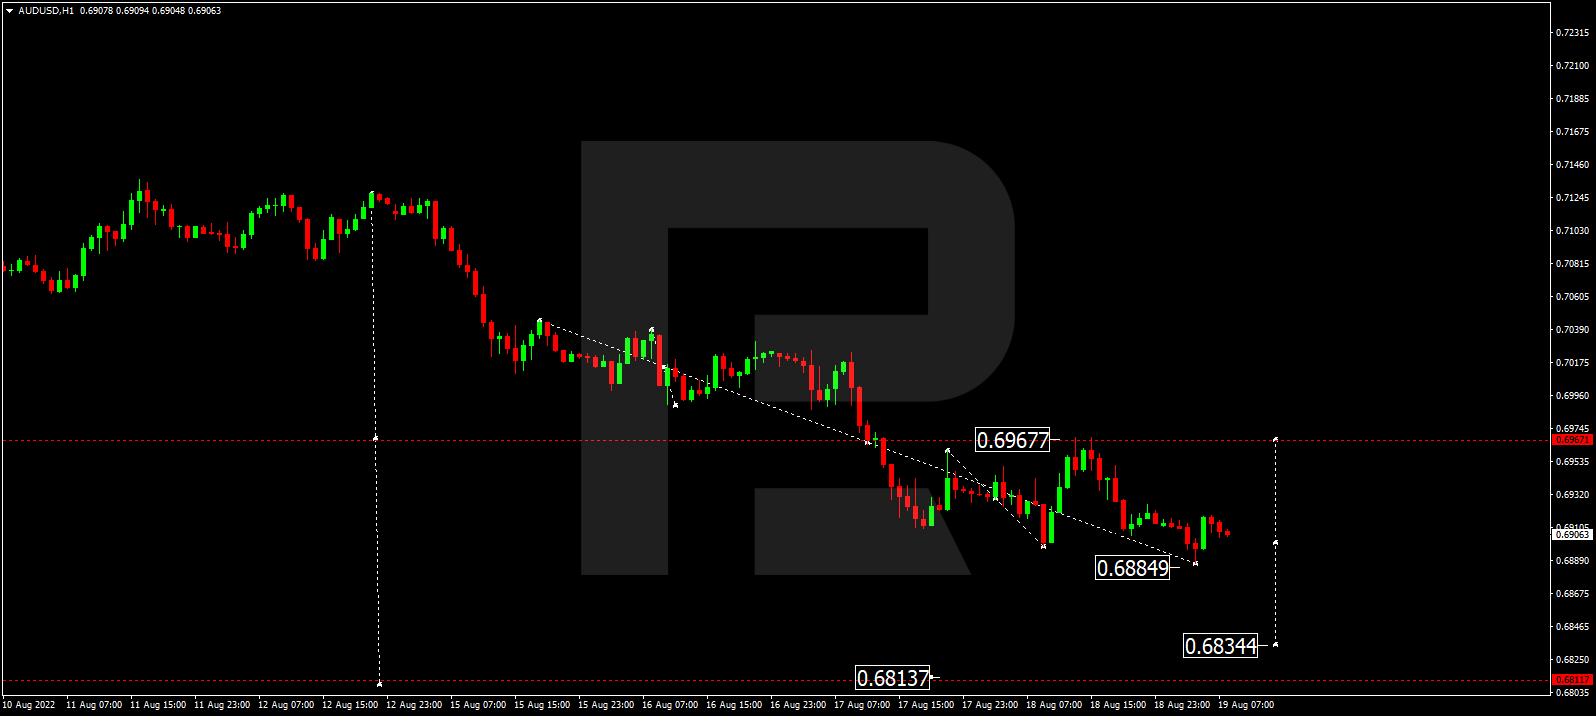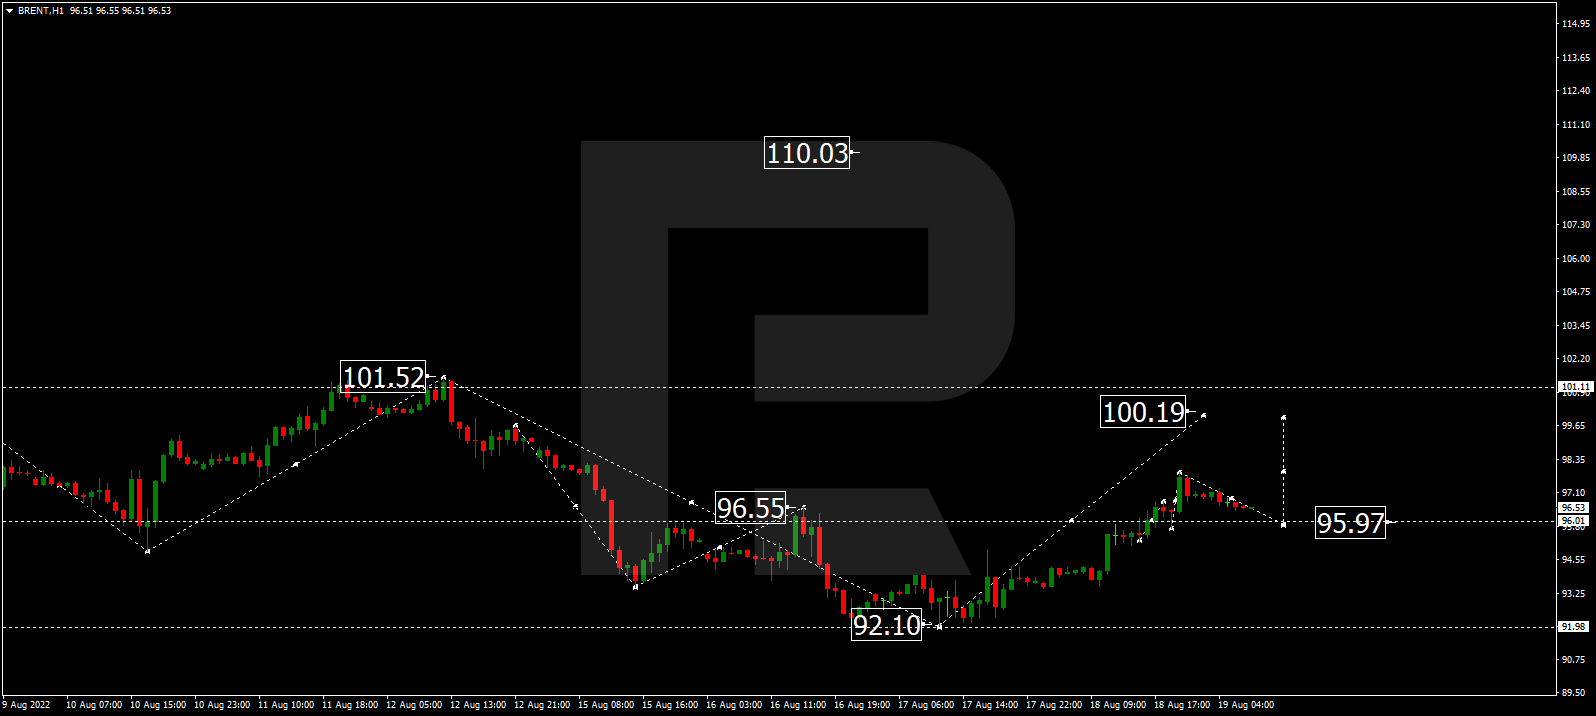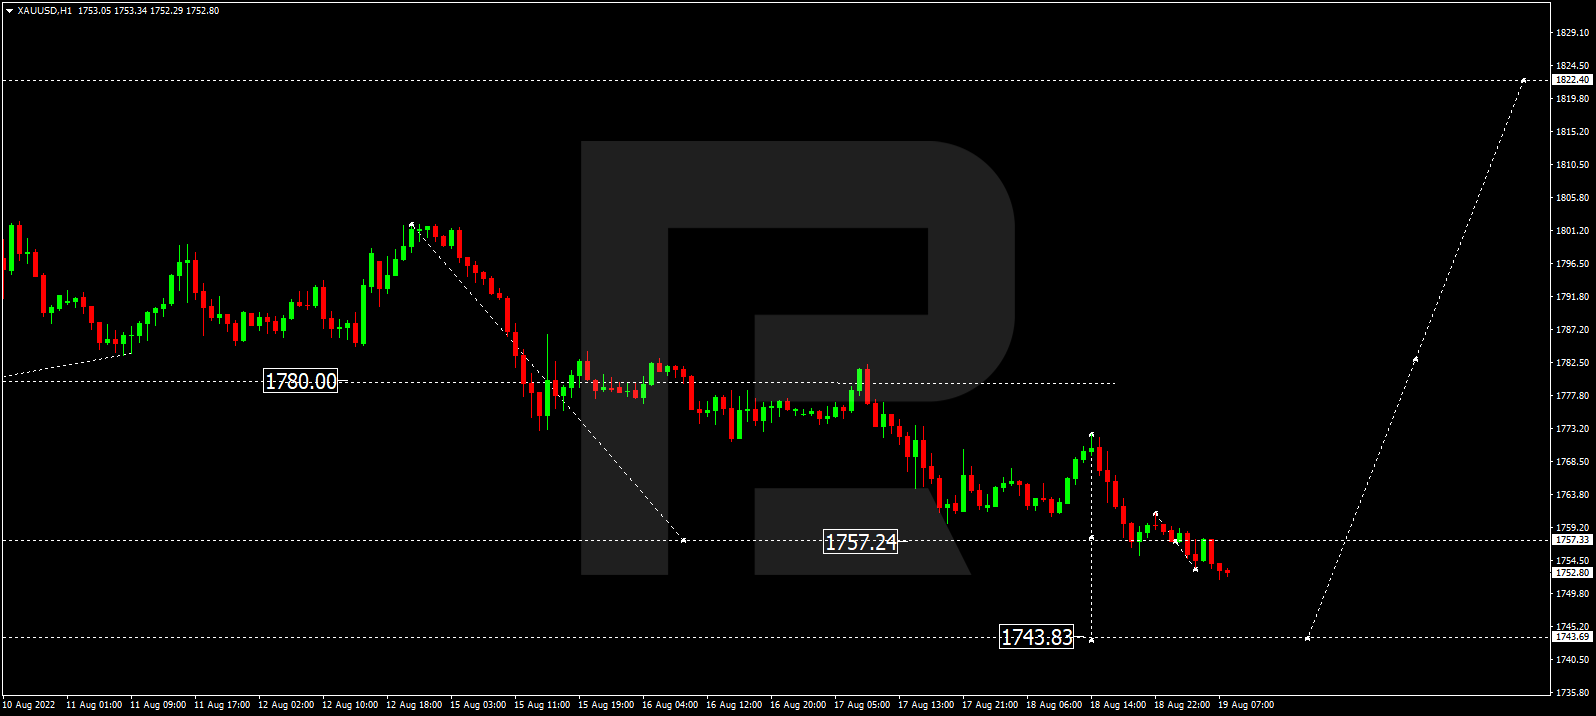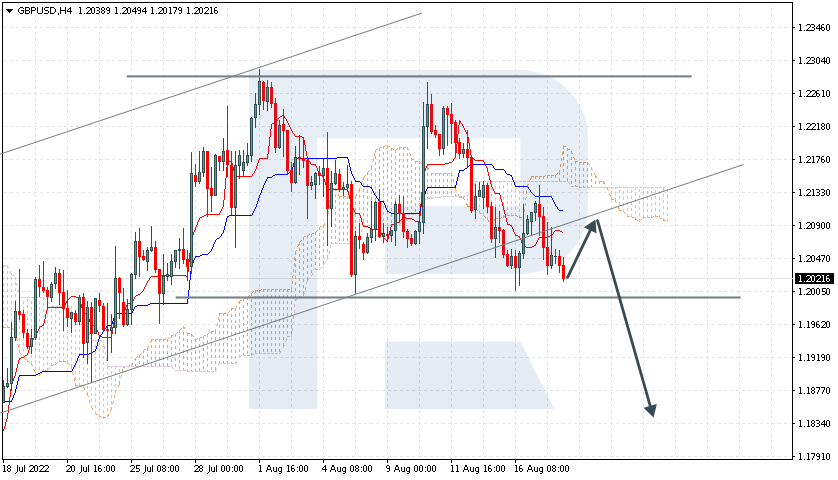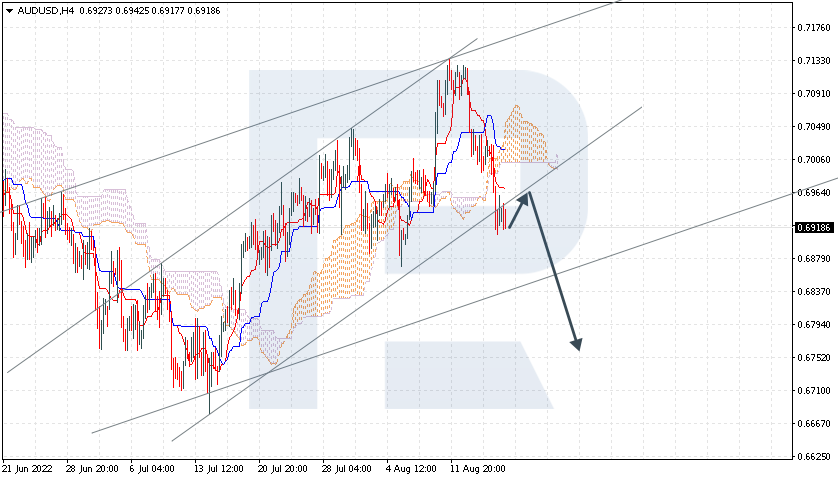
Murrey Math Lines 04.08.2022 (USDCHF, GOLD)

Article By RoboForex.com

USDCHF, “US Dollar vs Swiss Franc”

As we can see in the H4 chart, USDCHF is still trading below the 200-day Moving Average to indicate a possible descending tendency. In this case, the pair is expected to test 2/8, break it, and then continue falling towards the support at 1/8. However, this scenario may be cancelled if the price breaks the resistance at 3/8 to the upside. After that, the instrument may move upwards to reach 4/8.

USDCHFH4
Risk Warning: the result of previous trading operations do not guarantee the same results in the future

In the M15 chart, the pair may break the downside line of the VoltyChannel indicator and, as a result, continue trading downwards.

USDCHF_M15
Risk Warning: the result of previous trading operations do not guarantee the same results in the future

XAUUSD, “Gold vs US Dollar”

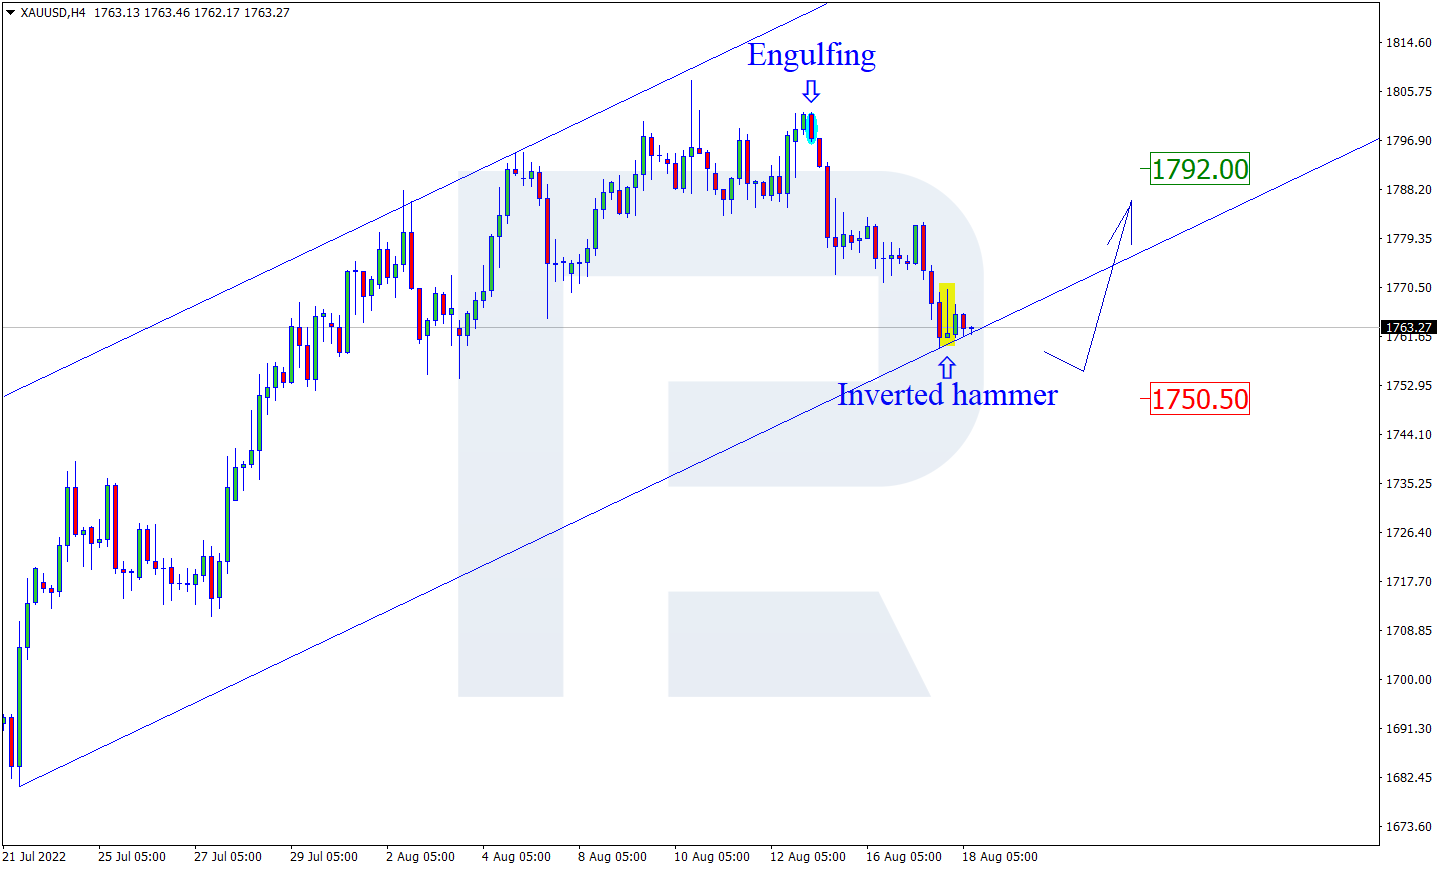
As we can see in the H4 chart, after breaking the 200-day Moving Average, XAUUSD is also trading above it, thus indicating an ascending tendency. In this case, the price is expected to test 5/8, break it, and then continue moving upwards to reach the resistance at 6/8. However, this scenario may no longer be valid if the price breaks the support at 4/8 to the downside. After that, the instrument may reverse and resume falling to return to 3/8.

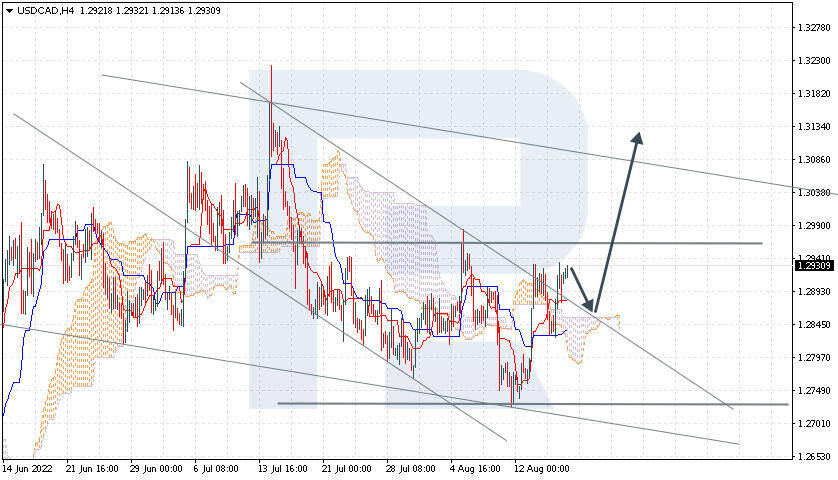
USDCAD_H4
Risk Warning: the result of previous trading operations do not guarantee the same results in the future

In the M15 chart, the pair may break the upside line of the VoltyChannel indicator and, as a result, continue its growth.

USDCAD_M15

Article By RoboForex.com

Attention!
Forecasts presented in this section only reflect the author’s private opinion and should not be considered as guidance for trading. RoboForex LP bears no responsibility for trading results based on trading recommendations described in these analytical reviews.

The Analytical Overview of the Main Currency Pairs on 2022.08.04

By JustForex

The EUR/USD currency pair

Technical indicators of the currency pair:
  • Prev Open: 1.0164
  • Prev Close: 1.0168
  • % chg. over the last day: +0.04%

The US Dollar Index rose on Wednesday after data showed an unexpected recovery in US PMI services in July, which provided further support for the currency after hawkish comments from Federal Reserve officials on Tuesday. With the US Federal Reserve tightening monetary policy, the US dollar is both a source of growth and a safe haven for investors, especially during a war between Ukraine and Russia and new geopolitical tensions between China and Taiwan.

Trading recommendations
  • Support levels: 1.0112, 1.0035, 1.0000
  • Resistance levels: 1.0179, 1.0264, 1.0284, 1.0365, 1.0415, 1.050

From the technical point of view, the trend on the EUR/USD currency pair on the hourly time frame is bullish. The price is still forming a wide volatile balance, but buyers’ pressure has changed to sellers’ initiative. The MACD indicator has become negative. Under such market conditions, buy trades are best sought on intraday time frames from the support level of 1.0112. Sell trades can be considered from the resistance level of 1.0179, but only after additional confirmation and only with short targets.

Alternative scenario: if the price breaks down through the 1.0112 support level and fixes below, the downtrend will likely resume.

EUR/USD
News feed for 2022.08.04:
  • – US Initial Jobless Claims (w/w) at 15:30 (GMT+3);
  • – US FOMC Member Mester Speaks (m/m) at 19:00 (GMT+3).

The GBP/USD currency pair

Technical indicators of the currency pair:
  • Prev Open: 1.2164
  • Prev Close: 1.2146
  • % chg. over the last day: -0.15%

The Bank of England is preparing for its biggest interest rate hike in 27 years because of rising inflation. The BoE is expected to raise interest rates by 50 basis points today, the most considerable increase since 1995. The probability of such a scenario is 70%. So, if 50 basis points raise the rate, the cost of borrowing will rise to 1.75%. This scenario is likely already priced in, and the most important event will be the speech of the governor of the Bank of England, Andrew Bailey. He will voice his views on further easing monetary policy and how quickly the Bank of England will reduce its balance sheet.

Trading recommendations
  • Support levels: 1.2114, 1.2114, 1.2063, 1.1907, 1.1803
  • Resistance levels: 1.2167, 1.2209, 1.2294

From the technical point of view, the GBP/USD currency pair trend on the hourly time frame is bullish. The price is now balanced and trading between the moving averages. The MACD indicator is in the negative zone, and there is an initiative from the sellers. Under such market conditions, it is better to look for buy trades on the intraday time frames from the support level of 1.2114, but only with confirmation since the level was tested yesterday. Sell trades can be considered from the resistance level of 1.2167 or 1.2209, but only after additional confirmation and with short targets.

Alternative scenario: if the price breaks down through the 1.2063 support level and fixes below, the downtrend will likely resume.

GBP/USD
News feed for 2022.08.04:
  • – UK Construction PMI (m/m) at 11:30 (GMT+3);
  • – UK BoE Inflation Report (m/m) at 14:00 (GMT+3);
  • – UK BoE Interest Rate Decision (m/m) at 14:00 (GMT+3);
  • – UK BoE Monetary Policy Statement (m/m) at 14:00 (GMT+3);
  • – UK BoE Gov Bailey Speaks at 14:30 (GMT+3).

The USD/JPY currency pair

Technical indicators of the currency pair:
  • Prev Open: 133.14
  • Prev Close: 133.85
  • % chg. over the last day: +0.53%

The USD/JPY currency pair is returning to an upward movement amid renewed dollar growth. Fundamentally, the difference in the interest rates and diametrically opposite monetary policies between the United States and Japan contributes to the growth of quotes. Most likely, no significant changes are planned before the end of the year.

Trading recommendations
  • Support levels: 132.12, 131.37, 130.85
  • Resistance levels: 135.29, 136.03, 137.11

From the technical point of view, the medium-term trend on the USD/JPY currency pair is bearish. But in the last two trading sessions, the dollar is getting stronger, and now the price is trading between the moving averages. The MACD indicator is in the positive zone, and buyer pressure is increasing. Under such market conditions, buy trades can be sought from the support level of 132.12, but with additional confirmation. Resistance levels of 135.29 may be considered for sell deals, but only with additional confirmation and short targets.

Alternative scenario: If the price fixes above 135.29, the uptrend will likely resume.

USD/JPY
There is no news feed for today.

The USD/CAD currency pair

Technical indicators of the currency pair:
  • Prev Open: 1.2874
  • Prev Close: 1.2840
  • % chg. over the last day: -0.26%

The Canadian dollar is a commodity currency that highly depends on the US Dollar Index and oil prices. Oil prices decreased by 3% yesterday after an unexpected 4.5 million barrels increase in inventories last week (forecast +600K), while the US Dollar Index increased on rising geopolitical tensions in Asia. As a result, the USD/CAD quotes demonstrated growth, but the end of the trading day was for the Canadian. Investors should consider the fact that the interest rates of the Bank of Canada and the US Federal Reserve are now at the same level. This means traders should not expect medium-term trends in this currency pair.

Trading recommendations
  • Support levels: 1.2803, 1.2786
  • Resistance levels: 1.2880, 1.2929, 1.3006, 1.3085, 1.3154

In terms of technical analysis, the USD/CAD currency pair trend is bearish. At the moment, the price is forming a wide balance. The MACD indicator became positive, and there was an initiative of buyers. Under such market conditions, it is better to consider sell deals from the resistance level of 1.2880, but with confirmation. Buy trades should be considered on the lower time frames from the support level of 1.2803 or 1.2789, but only with confirmation and short targets.

Alternative scenario: if the price breaks out and consolidates above the 1.2929 resistance level, the uptrend will likely resume.

USD/CAD
There is no news feed for today.

By JustForex


This article reflects a personal opinion and should not be interpreted as an investment advice, and/or offer, and/or a persistent request for carrying out financial transactions, and/or a guarantee, and/or a forecast of future events.

Oil falls amid an unexpected rise in reserves. China is creating a blockade on Taiwan under the guise of military exercises

By JustForex

Fed officials reiterated Wednesday their determination to curb high inflation. One official noted that a half-percent hike in the Central Bank’s key interest rate next month may be enough to achieve that goal.

In July, the US services sector unexpectedly rebounded due to a strong increase in orders, while supply bottlenecks and price pressures eased. This confirmed the view of the Fed representatives that the economy is not in recession, despite the reduction in production in the first half of the year.

As the stock market closed yesterday, the Dow Jones Index (US30) increased by 1.29%, and the S&P 500 Index (US500) added 1.56%. The NASDAQ Technology Index (US100) jumped by 2.59%.

PayPal (PYPL) was one of the day’s leaders, rising more than 9% after reporting better-than-expected results and announcing a $15 billion share buyback program. The fintech giant also said Elliott Investment Management had invested $2 billion in the company as the activist shareholder hopes to encourage PayPal to explore plans to return capital to shareholders. Moderna (MRNA) shares rose nearly 16% after a report showed better-than-expected second-quarter results thanks to higher sales of the Covid-19 vaccine. Online travel agency Booking Holdings Inc (BKNG) reported an increase in quarterly revenue Wednesday as a surge in bookings amid strong demand for summer travel led to a faster-than-expected recovery.

Alibaba (BABA), Toyota Motor (TM), Amgen (AMGN), ConocoPhillips (COP), Vertex (VRTX), and others report today.

Stock markets in Europe were mostly up on Wednesday. German DAX (DE30) gained 1.03%, French CAC 40 (FR40) jumped by 0.97%, Spanish IBEX 35 (ES35) added 0.56%, British FTSE 100 (UK100) gained 0.13%.

According to Eurostat, Eurozone producer inflation rose another 1.1% in June 2022. Eurozone retail sales showed a decline of 1.2%, with a forecast of rising of 0.4%. This is negative data for the euro. On the other hand, the PMI of business activity in the service sector in Europe has noticeably increased. Still, analysts attribute the growth of the index to the increase in demand for services during the summer season.

Crude oil inventories unexpectedly rose by 4.5 million barrels last week, compared to analysts’ forecast of 600,000 barrels. The OPEC+ group said it would raise its oil production target by just 100,000 BPD. Oil prices decreased by 3% amid the data yesterday.

Asian markets traded flat yesterday. Japan’s Nikkei 225 (JP225) gained 0.53%, Hong Kong’s Hang Seng (HK50) added 0.40%, and Australia’s S&P/ASX 200 (AU200) was down by 0.32%.

China launched an unprecedented live-fire military exercise in six areas around Taiwan on Thursday, a day after US House Speaker Nancy Pelosi visited the island. Taiwanese officials said the exercises violate United Nations rules, invade Taiwan’s territorial space, and pose a direct challenge to free air and sea navigation. China is conducting the drills in the busiest international waterways and air routes. A Taiwanese cabinet spokesman, expressing strong condemnation of the exercises, also said the websites of the defense ministry, foreign ministry, and presidential office had been attacked by hackers.

S&P 500 (F) (US500) 4,155.17 +63.98 (+1.56%)

Dow Jones (US30) 32,812.50 +416.33 (+1.29%)

DAX (DE40) 13,587.56 +138.36 (+1.03%)

FTSE 100 (UK100) 7,445.68 +36.57 (+0.49%)

USD Index 106.38 +0.14 (+0.13%)

Important events for today:
  • – UK Construction PMI (m/m) at 11:30 (GMT+3);
  • – UK BoE Inflation Report (m/m) at 14:00 (GMT+3);
  • – UK BoE Interest Rate Decision (m/m) at 14:00 (GMT+3);
  • – UK BoE Monetary Policy Statement (m/m) at 14:00 (GMT+3);
  • – UK BoE Gov Bailey Speaks at 14:30 (GMT+3);
  • – US Initial Jobless Claims (w/w) at 15:30 (GMT+3);
  • – GUS Natural Gas Storage (w/w) at 17:30 (GMT+3);
  • – US FOMC Member Mester Speaks (m/m) at 19:00 (GMT+3).

By JustForex


This article reflects a personal opinion and should not be interpreted as an investment advice, and/or offer, and/or a persistent request for carrying out financial transactions, and/or a guarantee, and/or a forecast of future events.

BOE Decision: What you need to know

By ForexTime

When is it due?

  • The Bank of England’s (BOE) policy statement is due to be released today (Thursday, August 4th) at 11:00 AM GMT
  • Half an hour later, BOE Governor Andrew Bailey is due to hold a press conference at 11:30 AM GMT


The BOE is widely expected to raise the UK bank rate by 50 basis points (bps) today.

A 50bps hike today would mark the BOE’s largest hike since 1995.

Markets are currently forecasting an 80% chance that the BOE will trigger a larger-than-usual hike, given that a 50bps move would be double the size of its previous four hikes.


The BOE has been hiking its benchmark rates since the end of last year:

  • December: 15bps
  • February: 25bps
  • March: 25bps
  • May: 25bps
  • June: 25bps
  • August: 50bps?

TOTAL: 165bps? (to be determined after today’s decision)


Why is the BOE in a rush to raise interest rates?

One word: inflation.

The UK consumer price index (CPI), which measures changes in the prices of a basket of goods and services, has risen by 9.4% in June 2022 compared to June 2021.

That’s the highest year-on-year advance for the headline CPI since February 1982!

Given that a central bank’s primary method for cooling inflationary pressures is by raising interest rates, no surprise then that the BOE has sent its bank rate to 1.25% (as of last month), which could go up to 1.75% after today’s decision.


What happens next?

As things stand, markets are forecasting that the BOE can only send its benchmark rate higher by another 125bps to 3% after today’s decision (assuming today’s hike is indeed 50bps), before having to reverse course and lower rates in Q2 2023.

Thus, it appears that the BOE is already more than halfway done in this ongoing rate hike cycle.

The reason for this about-turn is because the BOE may be concerned about sending the UK economy deep into a recession. Already back in May earlier this year, the central bank warned of the prospects of a UK recession in 2023.

And with inflation set to reach double-digits in Q4 this year (well above the BOE’s 2% target), along with rates moving higher, such a combo could break the UK economy (i.e. a recession).


How would this impact the Pound?

So far this year, the Pound has already weakened by 10% against the US dollar (remember the good ol days of GBPUSD being above 1.30?).

More recently, GBPUSD a.k.a. “cable” hasn’t been able to keep its head above its 50-day simple moving average (SMA).

  • If the BOE triggers a smaller-than-expected 25bps hike today, that could result further declines for GBPUSD.
  • If the BOE triggers a massive 75bps hike today, that could shock GBPUSD northwards.
  • If Governor Bailey can convince markets (and that’s the key part: markets need to believe the BOE’s message) that the UK economy can indeed withstand interest rates rising past 3% by Q1 2023, that could also translate into further strength for Sterling.
  • If Governor Bailey suggests that the BOE will have to slow down its intended rate hikes, for fear of sending the UK economy into a recession, that could see the Pound move lower.

Expect a combination of the above-listed scenarios.


Key support and resistance levels for GBPUSD

The BOE’s latest policy signals are set to determine whether GBPUSD will be kept above its 50-day SMA, or sent below that key technical indicator.

  • Immediate resistance above 50-day SMA at recent cycle peak of 1.22934
  • Stronger resistance can be seen around 1.24 (end-April lows/mid-June high)


  • Support: 1.200 (psychologically-important level) / 1.19335 mid-June trough
  • Stronger support set to arrive at 1.1760 – lowest since the onset of the pandemic


Overall, I expect that GBPUSD may do no better than 1.24 for the immediate term, barring a shockingly-hawkish tone out of the BOE today, and assuming markets can buy into such an aggressive messaging.

In other words, GBPUSD is likely to remain confined to its downtrend (series of lower highs and lower lows) that has persisted since June 2021, given the dark clouds swirling about the UK economic outlook which have lent themselves to a downward bias for “cable”.


Other points to look out for today:

  1. Details on “Quantitative Tightening”

    Today, the BOE is also expected to unveil how it plans to reduce the 895 billion in “easy money” it has pumped out (by selling gilts) into the UK economy since the 2008 global financial crisis.

    Such details may impact gilt yields, which have a large influence over Sterling’s moves.

  2. BOE’s economic and inflation forecasts

    Markets will be eager to find out how high the BOE thinks UK inflation will go, and the central bank’s forecasts on the likelihood of a UK recession.

    The Pound will be ready to offer an immediate reaction to such economic projections, as they should inform market expectations for how the BOE is able to respond (i.e. how much higher UK rates can go).


Forex-Time-LogoArticle by ForexTime

ForexTime Ltd (FXTM) is an award winning international online forex broker regulated by CySEC 185/12 www.forextime.com

3 Stocks Trading Near 52-Week Highs

By Ino.com

So far this year, the stock market has flashed more red signs than green due to various macroeconomic and geopolitical concerns. The immense volatility weighed heavily on equities and government bond yields.

The CBOE Volatility Index (VIX) gained 29.5% year-to-date.

However, the major stock indexes rose in the last trading session to end their best month since 2020, slashing some losses from a gloomy first half of the year. The S&P 500 gained 9.1% in July, while the Dow Jones Industrial Average rose 6.7%, reflecting their strongest month since November 2020. The Nasdaq Composite rose 12.4%, marking its best month since April 2020.

Chris Zaccarelli, chief investment officer for Independent Advisor Alliance, said, “We are seeing a relief rally in the stock market, as pessimism reached extreme levels, and as longer-term interest rates have been coming back down.”

Optimistic expectations from the upcoming earnings releases have also encouraged investors to take a breather from the idea of a slowing economy and further interest rate hikes.

Occidental Petroleum Corporation (OXY), Molina Healthcare, Inc. (MOH), and Greif, Inc. (GEF) are hovering near their 52-week highs and could be the ideal additions to your watchlist now given their strong fundamentals and momentum.

Occidental Petroleum Corporation (OXY)

OXY is engaged in acquiring, exploring, and developing oil and gas properties in the United States, Middle East, Africa, and Latin America.

The company operates through three segments: Oil and Gas, Chemical, Midstream, and Marketing. It develops, processes, transports, and markets oil and condensate, natural gas liquids (NGLs), and natural gas. It also manufactures basic chemicals.

On June 27, 2022, OXY’s subsidiary, 1PointFive, and Manulife Investment Management entered into a lease agreement for approximately 27,000 acres of timberland in Western Louisiana.

This agreement provides 1PointFive with access to subsurface pore space and surface rights to develop and operate a carbon sequestration hub, with access to permanently store industrial carbon emissions. This is expected to promote the company’s sustainability goals.

OXY’s net sales increased 57.7% year-over-year to $8.35 billion in the fiscal 2022 first quarter ended March 31, 2022. Its income from continuing operations rose 1,530.8% from the prior-year period to $4.88 billion.

The company’s adjusted income attributable to common stockholders and adjusted EPS came in at $2.13 billion and $2.12, up 1,664% and 1,513.3%, respectively, year-over-year.

The consensus EPS estimate of $3.03 for the second quarter (ended June 30, 2022) represents an 846.6% improvement year-over-year. The consensus revenue estimate of $9.81 billion for the to-be-reported quarter indicates a 63.2% increase from the same period last year.

The company has an impressive earnings surprise history; it surpassed the consensus EPS estimates in three of the trailing four quarters.

Over the past year, the stock has gained 145.5% to close the last trading session at $65.75. It is currently trading 11.2% below its 52-week high of $74.04, which it hit on May 31, 2022.

OXY’s POWR Ratings reflect solid prospects. The POWR Ratings assess stocks by 118 different factors, each with its own weighting.

It has an A grade for Momentum and a B for Growth and Quality. It is ranked #38 out of 97 stocks in the B-rated Energy – Oil & Gas industry. Click here to learn more about POWR Ratings.

Molina Healthcare, Inc. (MOH)

MOH provides managed health care services to low-income families and individuals under Medicaid and Medicare programs and through state insurance marketplaces. The company operates through four segments: Medicaid, Medicare, Marketplace, and Other.

It offers healthcare services through contracts with providers, independent physicians and physician groups, hospitals, and ancillary providers.

On July 13, 2022, MOH announced that it had agreed to acquire the assets of My Choice Wisconsin. MOH’s President and CEO Joe Zubretsky said, “The addition of My Choice Wisconsin to Molina’s expanding footprint is not only complementary to our existing Medicaid business in Wisconsin, but also representative of our strategic growth initiatives.”

During the fiscal second quarter (ended June 30, 2022), MOH’s total revenue increased 18.4% year-over-year to $8.05 billion. Its operating income rose 32.2% from the year-ago value to $361 million.

The company’s adjusted net income grew 33.7% from the same period last year to $266 million, while its adjusted EPS came in at $4.55, representing a 33.8% increase year-over-year.

Analysts expect MOH’s EPS and revenue for the fiscal third quarter (ending September 2022) to increase 50.5% and 11.4% year-over-year to $4.26 and $7.84 billion. The company has surpassed the consensus EPS estimates in three of the trailing four quarters.

Over the past year, the stock has gained 28.4% to close the last trading session at $327.72. It is currently trading 6.4% below its 52-week high of $350.19, which it hit on April 21, 2022.

MOH’s strong fundamentals are reflected in its POWR Ratings. The stock has an overall rating of A, which equates to a Strong Buy in the POWR Ratings system. MOH also has an A grade for Quality and a B grade for Value.

The stock is ranked #4 of 11 in the A-rated Medical – Health Insurance industry. Click here to learn more about POWR Ratings.

Greif, Inc. (GEF)

GEF is a global producer of industrial packaging products and services with operations in over 35 countries. The company operates through three segments: Global Industrial Packaging, Paper Packaging & Services, and Land Management.

It produces steel, plastic, fiber drums, intermediate bulk containers, containerboard, uncoated and coated recycled paperboard, tubes and cores, and a diverse mix of specialty products.

On June 23, 2022, the company’s Board of Directors announced a $150 million share repurchase program. GEF has entered into a $75 million accelerated share repurchase agreement with Bank of America, N.A. to repurchase its Class A stock shares and plans to repurchase an aggregate of $75 million shares of its Class A and Class B stock in open market purchases. This reflects the company’s strong cash flows and ability to boost shareholder returns.

For the fiscal second quarter ended April 30, 2022, GEF’s net sales increased 24.4% year-over-year to $1.67 billion. The company’s gross profit increased 27.4% year-over-year to $338.70 million. Also, its adjusted EBITDA increased 42.1% year-over-year to $251 million.

For the third quarter ended July 31, 2022, GEF’s EPS and revenue are expected to increase 3.4% and 7.1% year-over-year to $2 and $1.60 billion, respectively. It has surpassed the consensus EPS estimates in three of the trailing four quarters.

The stock has gained 16.1% over the past year to close the last trading session at $70.62. GEF is currently trading 1.9% below its 52-week high of $72, which it hit on November 10, 2021.

GEF’s POWR Ratings reflect this promising outlook. The stock has an overall rating of B, translating to a Buy in the POWR Ratings system. It also has a B grade for Value and Quality.

Within the A – rated Industrial – Packaging industry, it is ranked #3 out of 22 stocks. Click here to learn more about POWR Ratings.


About the Author

Shweta Kumari’s profound interest in financial research and quantitative analysis led her to pursue a career as an investment analyst. She uses her knowledge to help retail investors make educated investment decisions. Shweta graduated with a bachelor’s degree in accounting and finance and is currently pursuing the Chartered Accountancy course. Shweta is a regular contributor for StockNews.com.

By Ino.com – See our Trader Blog, INO TV Free & Market Analysis Alerts

Source: 3 Stocks Trading Near 52-Week Highs

SPY Set To Lose Its Crown

By Ino.com

Since 2017, the King of the Exchange Traded Fund world has slowly been losing ground to its closest competitors.

The SPDR S&P 500 ETF Trust (SPY), the undisputed ETF King since ETFs became popular, is set to lose its crown within the next few years. Well, perhaps it would be better to say that it will lose one of its crowns or maybe one of its world titles while still holding a few others. Let me explain…

The SPY ETF is and has been, with the exception of just a handful of months over the last 20-plus years, the largest Exchange Traded Fund in terms of assets under management. Currently, SPY has $365 billion under management.

In contrast, the next closest competitor, iShares Core S&P 500 ETF (IVV), has $298 billion, and then there is the Vanguard S&P 500 ETF (VOO) at $264 billion in assets.

The SPDR ETF has more than $65 billion in assets compared to the second largest ETF and more than $100 billion compared to the third largest ETF. So why are there predictions that its competitors will overtake it in the coming years?

First and foremost, since 2017, it has been losing ground to IVV and VOO, and based on results from the first half of 2022, the trend doesn’t appear to be changing. VOO has added $29.2 billion in assets year-to-date, while IVV has added $15.7 billion. On the other hand, SPY has lost $22.7 billion.

Also, it is essential to remember that these three ETFs we are comparing all due literally the same thing, track the S&P 500’s performance.

It is not as if we are comparing a NASDAQ-focused ETF and a S&P 500 ETF, these three funds are all built the same. They own the 500 stocks that make up the S&P 500 based on a market capitalization weighting. That matters because this shows that the three fund’s asset changes are not based on performance but on investor preference showing that they are pulling money from one fund in mass and adding it to the others.

Why is this shift occurring?

Simple! Cost.

Despite being the undisputed King of the ETF world, the SPY has one chink in its amour; it is expensive compared to the competition. Like really expensive. The SPY charges a 0.09% expense ratio. So in dollar terms, that would mean an investor with $10,000 in SPY pays $9.00 per year.

But IVV and VOO only charge 0.03% or $3.00 for every $10,000 invested. SPY is three times as expensive as the competition, which offers a nearly identical product. It makes no sense for long-term buy-and-hold investors to stick with SPY and pay the higher fee.

As for other types of investors, say those who trade or put on hedged positions or different complicated investing strategies, it does still make sense why they would use SPY instead of the alternatives. SPY still has the best liquidity.

The current average daily volume for SPY is 93 million shares trading hands per day. IVV’s average volume is 6.2 million, and VOO’s is 5.6 million. Even these figures back the thesis that long-term buy-and-hold investors are buying IVV and VOO while traders are trading SPY.

Traders don’t care as much about the higher cost when they have access to the type of liquidity SPY offers, allowing them to quickly and seamlessly get in and out of a position. This is why SPY may lose its crown as King of the ETFs from an asset standpoint.

Still, it will not likely lose its title as the most liquid ETF because while the competition may be within striking distance from an asset under management standpoint, they aren’t even in the same ballpark when it comes to average daily volume.

So if you are an investor in SPY, you need to ask yourself why. Do you need the liquidity, or have you just been complacent and not switched to one of the ETFs more suited for your type of investing?

Matt Thalman
INO.com Contributor
Follow me on Twitter @mthalman5513

Disclosure: This contributor did not hold a position in any investment mentioned above at the time this blog post was published. This article is the opinion of the contributor themselves. The above is a matter of opinion provided for general information purposes only and is not intended as investment advice. This contributor is not receiving compensation (other than from INO.com) for their opinion.

By Ino.com – See our Trader Blog, INO TV Free & Market Analysis Alerts

Source: SPY Set To Lose Its Crown

Will the S&P 500 Index Go the Way of Meme Stocks?

Here’s what usually happens when “financial lunacy” is prevalent

By Elliott Wave International

You don’t hear much about the meme stock craze anymore — and for good reason.

It’s all but dead and has been for months (Barron’s, Jan. 28):

A Year After It Began, Meme-Stock Mania Is on Life Support

Early last year, the movement to buy meme stocks — like AMC, Gamestop and others — was largely driven by discussions on the internet, mainly by stock market novices.

When the movement was still going strong, the February 2021 Elliott Wave Financial Forecast, a monthly publication which covers major U.S. financial markets, made this comment about meme stocks:

A mania is pretty funny, especially at the very end, when financial lunacy is so prevalent that many assume it to be permanent.

Here’s an update from the July Elliott Wave Financial Forecast:

As you can see on the chart, the Meme Stock Index is down 65% from its early 2021 peak (as of the time the July Elliott Wave Financial Forecast published). So, indeed, the assumption of permanency was what you would call — misplaced.

What you need to know is that an assumption of permanency is now geared toward the main stock indexes — not just by amateur investors, but professionals (Bloomberg June 27):

S&P Analysts Haven’t Been This Bullish In 20 Years

It’s clear that these S&P analysts are shrugging off the downtrends that began in the Dow Industrials and S&P 500 index in January.

They may turn out to be correct — in other words, the downtrend is over and another major leg up is set to start.

Then again, you may want to consult the stock market’s Elliott wave structure.
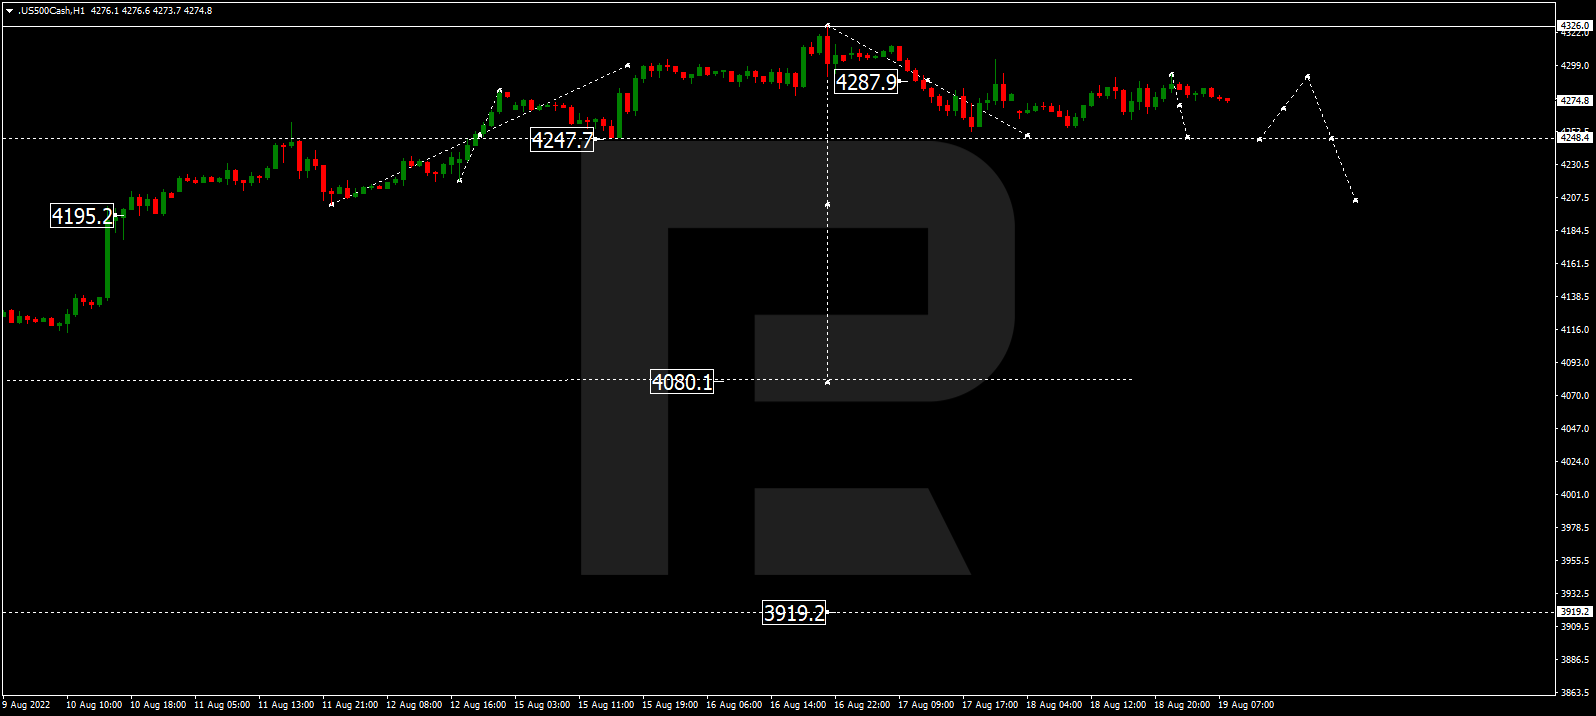
The July Elliott Wave Financial Forecast describes two Elliott wave options for the S&P 500 index between now and the end of summer.

If you’re unfamiliar with Elliott wave analysis, you are encouraged to read Frost & Prechter’s Wall Street classic, Elliott Wave Principle: Key to Market Behavior. Here’s a quote from the book:

In the 1930s, Ralph Nelson Elliott discovered that stock market prices trend and reverse in recognizable patterns. The patterns he discerned are repetitive in form but not necessarily in time or amplitude. Elliott isolated five such patterns, or “waves,” that recur in market price data. He named, defined and illustrated these patterns and their variations. He then described how they link together to form larger versions of themselves, how they in turn link to form the same patterns of the next larger size, and so on, producing a structured progression. He called this phenomenon The Wave Principle.

Although it is the best forecasting tool in existence, the Wave Principle is not primarily a forecasting tool; it is a detailed description of how markets behave. Nevertheless, that description does impart an immense amount of knowledge about the market’s position within the behavioral continuum and therefore about its probable ensuing path. The primary value of the Wave Principle is that it provides a context for market analysis.

Would you like to delve deeper into the Wave Principle?

If your answer is “yes,” here’s good news: You can access the entire online version of the book for free once you join Club EWI, the world’s largest Elliott wave educational community.

A Club EWI membership is free and allows free access to a wealth of Elliott wave resources on investing and trading. These resources include videos and special reports, many of which are from Elliott Wave International’s analysts.

Get started by following this link: Elliott Wave Principle: Key to Market Behavior — get instant access — free.

This article was syndicated by Elliott Wave International and was originally published under the headline Will the S&P 500 Index Go the Way of Meme Stocks?. EWI is the world’s largest market forecasting firm. Its staff of full-time analysts led by Chartered Market Technician Robert Prechter provides 24-hour-a-day market analysis to institutional and private investors around the world.

The cryptocurrency market digest (BTC, SOL). Overview for 03.08.2022

Article By RoboForex.com

After five trading sessions of declining, the BTC managed to reach stability and is even trying to grow a bit. The asset is mostly fluctuating at $23,412.

There isn’t too much activity in the cryptocurrency. It could be explained by controversial external background, investors’ concerns about geopolitics, and so on. However, the fact is: the crypto market has no trading ideas of its own and market players believe it would be unwise to buy without any support from stock indices.

Interestingly enough, the BTC wasn’t too effective in talking advantage of the uptrend in S&P 500 and NASDAQ that took place earlier. Of course, the major crypto asset moved away from the lows, but it still hasn’t been able to break the resistance at $23,500. The daily chart shows that if bulls take control, the BTC may break $23,500 and continue rising to reach $24,200-$24,500. Otherwise, the first downside target might be $22,500.

The crypto market capitalisation is currently estimated at $1.06 trillion; the fear index is up to 34 points.

Minexmr shuts down

One of the key Monero mining pools will shut down on 12 August. It is known that the pool controls about 40% of all Monero mining facilities.

Solana suffered from exploit

Solana seriously suffered from the hacker attack. According to OtterSec, hackers got access to 8,000 wallets and stole over $8 million. The most part of these wallets didn’t record any activities in the last six months. The ecosystem’s reputation might be compromised: all transactions were signed by wallet owners, which means that hackers had their private keys.

Variant: investments in crypto companies

Venture company Variant announced it raised $450 million for two new funds. One of them is Web-3, which will get about $300 million, while the others are new startups. Variant is very interested in crypto projects: earlier, it invested in the DeFi-platform Goldfinch and some other companies.

Article By RoboForex.com

Attention!
Forecasts presented in this section only reflect the author’s private opinion and should not be considered as guidance for trading. RoboForex LP bears no responsibility for trading results based on trading recommendations described in these analytical reviews.

JPY: under pressure. Overview for 03.08.2022

Article By RoboForex.com

After moving away from its 8-week low, USDJPY is recovering.

The Japanese Yen is falling against the USD on Wednesday. The current quote for the instrument is 133.17.

The Yen was in demand when the US bond yield was plunging and the “greenback” was getting weaker, but these tendencies are now over. Nevertheless, the Yen managed to run away from its 8-week lows.

Another factor that supported the Japanese currency was market players’ demand for “safe haven” assets.

Speaking about currency exchange rates yesterday, the Japanese Minister of Finance said that the Yen’s recent dynamics were rather uncontrollable. To make the financial system look stable, currency exchange rates should be stable and reasonable, backed by fundamental indicators.

The Yen might get under pressure if the Bank of Japan keeps the benchmark interest rate negative and provides no insight into what will happen to the Japanese economy in the future.

A bit later, investors will understand what is happening to the Yen right now: whether it’s a rebound from the highs or a proper reversal in favour of the devaluation scenario.

Article By RoboForex.com

Attention!
Forecasts presented in this section only reflect the author’s private opinion and should not be considered as guidance for trading. RoboForex LP bears no responsibility for trading results based on trading recommendations described in these analytical reviews.

The Analytical Overview of the Main Currency Pairs on 2022.08.03

By JustForex

The EUR/USD currency pair

Technical indicators of the currency pair:
  • Prev Open: 1.0261
  • Prev Close: 1.0165
  • % chg. over the last day: -0.94%

New tensions between the US and China triggered a rise in the US dollar. Investors returned to safe-haven assets yesterday amid growing tensions between the US and China over a visit by the US speaker to the island of Taiwan, which China considers its territory. Also, the dollar was strengthened by Fed officials’ statements, which indicated that a 0.75% rate hike at the September meeting is also under active consideration. A possible economic slowdown is needed to slow inflation. The euro and other assets fell against the dollar.

Trading recommendations
  • Support levels: 1.0112, 1.0035, 1.0000
  • Resistance levels: 1.0191, 1.0264, 1.0284, 1.0365, 1.0415, 1.050

From the technical point of view, the trend on the EUR/USD currency pair on the hourly time frame is bullish. The price is still forming a wide volatile balance, but the sellers’ initiative has replaced the buyers’ pressure. The MACD indicator has become negative. Under such market conditions, buy trades are best sought on intraday time frames from the support level of 1.0112. Sell trades can be considered from the resistance level of 1.0191 or 1.0264, but only after additional confirmation and only with short targets.

Alternative scenario: if the price breaks down through the 1.0112 support level and fixes below, the downtrend will likely resume.

EUR/USD
News feed for 2022.08.03:
  • – US FOMC Member Bullard Speaks (m/m) at 01:45 (GMT+3);
  • – German Services PMI (m/m) at 10:55 (GMT+3);
  • – Eurozone Services PMI (m/m) at 11:00 (GMT+3);
  • – Eurozone Retail Sales (m/m) at 12:00 (GMT+3);
  • – US ISM Services PMI (m/m) at 17:00 (GMT+3).

The GBP/USD currency pair

Technical indicators of the currency pair:
  • Prev Open: 1.2241
  • Prev Close: 1.2161
  • % chg. over the last day: -0.65%

The Bank of England will hold its monetary policy and interest rate meeting tomorrow. Five consecutive 25 basis point hikes have raised the bank rate to 1.25%, but actual inflation continues to rise, and inflation expectations remain dangerously high. Three bank officials last time wanted a 50 basis point increase, and with the economy’s apparent growing problems, a majority may now favor a larger move. Also, tomorrow, the Bank of England is due to present a plan to reduce its balance sheet. QE is still a whopping £843.8 billion, and just last month, Bank of England Governor Bailey said that the Central Bank was considering cutting its assets.

Trading recommendations
  • Support levels: 1.2152, 1.2114, 1.2114, 1.2063, 1.1907, 1.1803
  • Resistance levels: 1.2203, 1.2294

From the technical point of view, the GBP/USD currency pair trend on the hourly time frame is bullish. The price is now balanced and trading between the moving averages. The MACD indicator is in the negative zone, and there is an initiative from the sellers. Under such market conditions, it is better to look for buy trades on the intraday time frames from the support level 1.2152 or 1.2114, but only with confirmation. Sell trades can be considered from the resistance level of 1.2203, but only after additional confirmation and with short targets.

Alternative scenario: if the price breaks down through the 1.2006 support level and fixes below, the downtrend will likely resume.

GBP/USD
News feed for 2022.08.03:
  • – UK Services PMI (m/m) at 11:30 (GMT+3).

The USD/JPY currency pair

Technical indicators of the currency pair:
  • Prev Open: 131.69
  • Prev Close: 133.15
  • % chg. over the last day: +1.11%

The Japanese yen was on track for its biggest gain since the coronavirus crisis in March 2020, as growing tensions between the US and China over Taiwan and deepening fears of a global economic slowdown increased the appeal of safe-haven assets. Against the dollar, the Japanese currency brought its cumulative gains to nearly 4.5% in five trading sessions. But the US dollar is also a safe-haven currency, so yesterday, it closed the day in the background of the dollar index growth. It is also worth keeping in mind that the US Federal Reserve is on the path to higher interest rates, while the Bank of Japan keeps its monetary policy soft. Such opposite policy plays in favor of USD/JPY quotes growth.

Trading recommendations
  • Support levels: 132.42, 131.37, 130.85
  • Resistance levels: 133.17, 134.00, 135.29, 136.03, 137.11

From the technical point of view, the medium-term trend on the USD/JPY currency pair is bearish. In the last trading sessions, the Japanese yen has strengthened, but yesterday the dollar intercepted the initiative. The MACD indicator became positive. Under such market conditions, buy trades can be sought from the support level of 132.42 or 131.37, but with additional confirmation. Resistance levels of 134.00 may be considered for sell deals, but only with additional confirmation and short targets.

Alternative scenario: If the price fixes above 135.29, the uptrend will likely resume.

USD/JPY
News feed for 2022.08.03:
  • – Japan Services PMI (m/m) at 03:30 (GMT+3).

The USD/CAD currency pair

Technical indicators of the currency pair:
  • Prev Open: 1.2841
  • Prev Close: 1.2879
  • % chg. over the last day: +0.29%

USD/CAD quotes increased yesterday on the back of a rising dollar and because of lower oil prices. The Canadian weakness was also affected by the manufacturing data. The manufacturing PMI fell from 54.6 to 52.5. The latest survey showed a new decline in production and new orders, while employment growth slowed. The sector was hit particularly hard in July by a drop in export sales. Cost pressures continued on the price front, with higher material, food, and transportation costs often cited as the main drivers of inflation.

Trading recommendations
  • Support levels: 1.2786
  • Resistance levels: 1.2880, 1.2923, 1.3006, 1.3085, 1.3154

In terms of technical analysis, the USD/CAD currency pair trend is bearish. At the moment, the price is forming a wide balance. The MACD indicator became positive, and there was an initiative of buyers. Under such market conditions, it is better to consider sell deals from the resistance level of 1.2880, but with confirmation. Buy trades should be considered on the lower time frames from the support level of 1.2786 or from the lower border of the channel, but only with confirmation and short targets.

Alternative scenario: if the price breaks out and consolidates above the 1.3006 resistance level, the uptrend will likely resume.

USD/CAD
News feed for 2022.08.03:
  • – US Crude Oil Reserves (w/w) at 17:30 (GMT+3).

By JustForex


This article reflects a personal opinion and should not be interpreted as an investment advice, and/or offer, and/or a persistent request for carrying out financial transactions, and/or a guarantee, and/or a forecast of future events.