
By Analytical Department RoboForex
USD/JPY rose to 157.65 on Wednesday, marking a third consecutive day of gains. The yen came under pressure following stronger-than-expected US inflation data, reinforcing expectations that the Federal Reserve will maintain its hawkish stance.
Market focus remains on the Bank of Japan. Following its April meeting, some policymakers signalled the possibility of a further rate hike. Rising global oil prices are adding to inflationary pressures in Japan. The OECD forecasts that the BoJ’s key rate could reach 2% by the end of 2027.
Currency markets are also watching for potential interventions. US Treasury Secretary Scott Bessent noted that Washington and Tokyo view excessive currency volatility as undesirable, which was seen as indirect support for Japan’s efforts to stabilise the yen.
Technical Analysis
Free Reports:
 Download Our Metatrader 4 Indicators – Put Our Free MetaTrader 4 Custom Indicators on your charts when you join our Weekly Newsletter
 Get our Weekly Commitment of Traders Reports - See where the biggest traders (Hedge Funds and Commercial Hedgers) are positioned in the futures markets on a weekly basis.
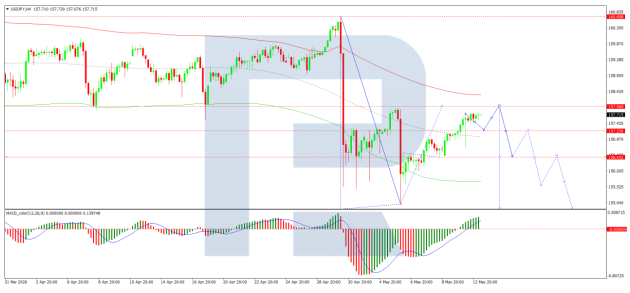
On the H4 chart, USD/JPY is trading around 157.33, with a breakout suggesting further upside towards 157.97. A short-term correction to 156.50 is possible before a potential move higher resumes. The MACD indicator, above zero and pointing firmly upwards, supports further gains.
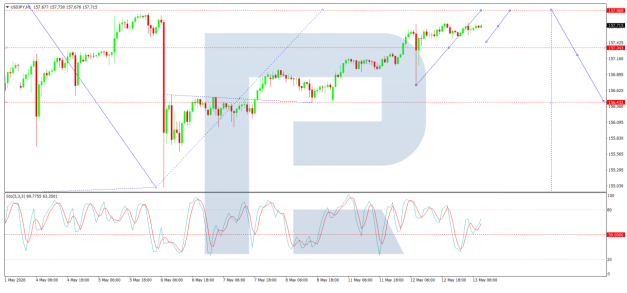
On the H1 chart, USD/JPY has reached 157.77 and is moving lower towards 157.30. A subsequent rise towards 157.97 is possible. The Stochastic oscillator confirms short-term bullish momentum, although a pullback may develop, indicating some near-term downside risk.
Conclusion
USD/JPY is advancing under both external and domestic influences, supported by technical indicators. While short-term corrections are possible, the broader trend remains upward.
Disclaimer
Any forecasts contained herein are based on the author’s particular opinion. This analysis may not be treated as trading advice. RoboForex bears no responsibility for trading results based on trading recommendations and reviews contained herein.

- EUR/USD: Busy Week Ahead Aug 3, 2026
- Positive sentiment in the AI sector supported stock indices. Oil prices remain volatile Aug 3, 2026
- The Tech‑heavy NASDAQ Index jumped by more than 3.3%. The offshore yuan is trading at its highest level since 2023 Jul 31, 2026
- USD/JPY After Volatility: Multiple Events in One Day Jul 31, 2026
- The US indices sell off amid renewed US-Iran clashes. Oil jumps by 7% Jul 30, 2026
- USD/JPY Temporary in Equilibrium: Multiple Factors in Focus Jul 30, 2026
- GBP/USD at Month’s Lows: The Outlook Remains Weak Jul 29, 2026
- Crude oil falls below $80 per barrel. Australia sees inflation slowdown Jul 29, 2026
- The US Tech sector hit by sell‑off. Oil prices decline on renewed negotiations Jul 28, 2026
- Gold Declines, Focus on Fed and Falling Oil Prices Jul 28, 2026