By InvestMacro
Here are the latest charts and statistics for the Commitment of Traders (COT) data published by the Commodities Futures Trading Commission (CFTC).
The latest COT data is updated through Tuesday April 21st and shows a quick view of how large traders (for-profit speculators and commercial entities) were positioned in the futures markets.
Weekly Speculator Changes led by Copper & Gold
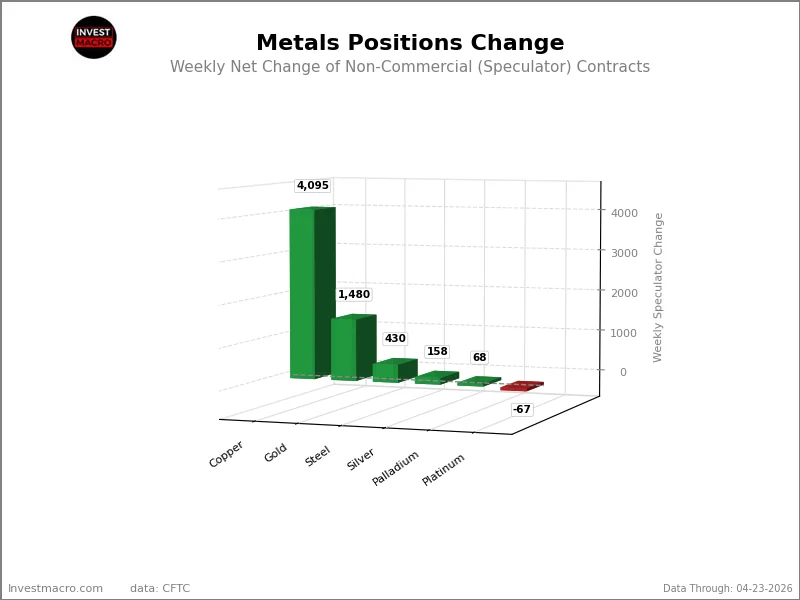
The COT metals markets speculator bets were overall higher this week as five out of the six metals markets we cover had higher positioning while the other one markets had lower speculator contracts.
Leading the gains for the metals was Copper (4,095 contracts) with Gold (1,480 contracts), Steel (430 contracts), Silver (158 contracts) and Palladium (68 contracts) also showing positive weeks.
The only market with a decline in speculator bets for the week was Platinum with a decrease by -67 contracts.
Metals Markets were overall lower in price performance this week.
The Precious Metals market’s price performances were mostly lower across the board this week. Steel was the only gainer and saw just a small edge higher by 0.16%.
On the downside, Copper dipped by -0.78% and was followed by Gold which fell by -1.83%. Platinum was lower by -3.77% followed by Palladium, which dropped by -3.92% on the week.
Silver was the biggest negative returner on the week with a -5.39% decline.
Metals Data:
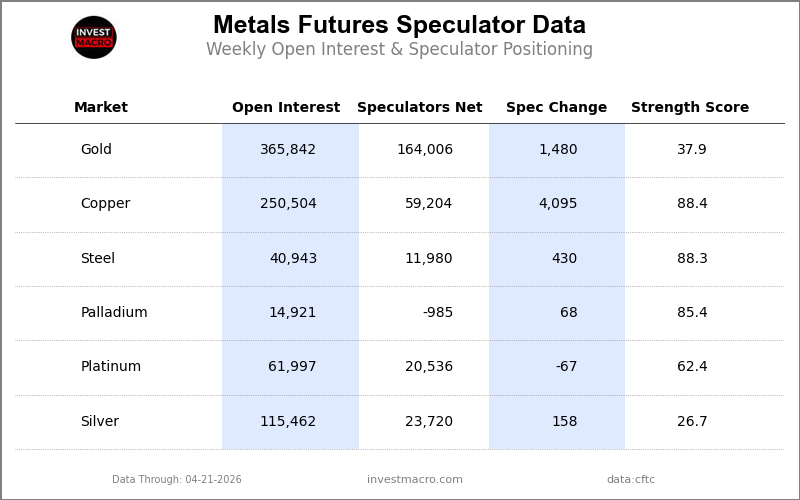
Legend: Weekly Speculators Change | Speculators Current Net Position | Speculators Strength Score compared to last 3-Years (0-100 range)
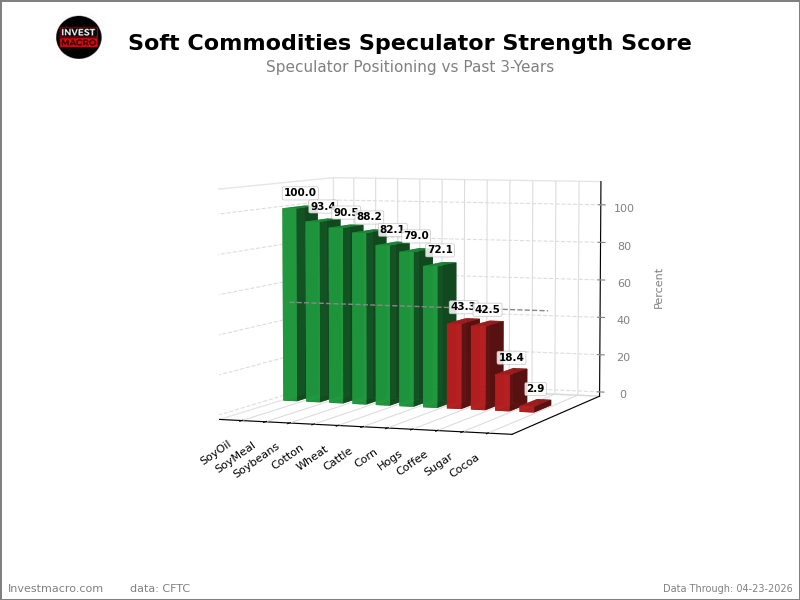
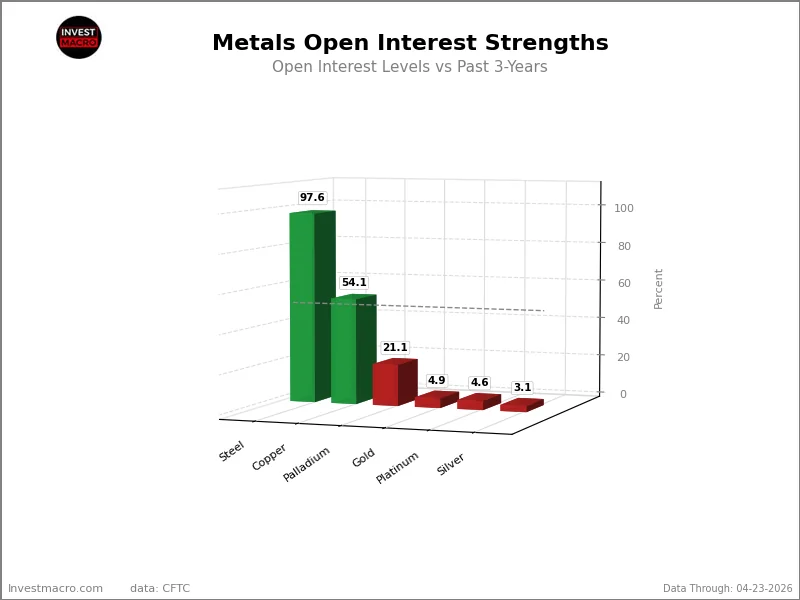
Strength Scores led by Copper & Steel
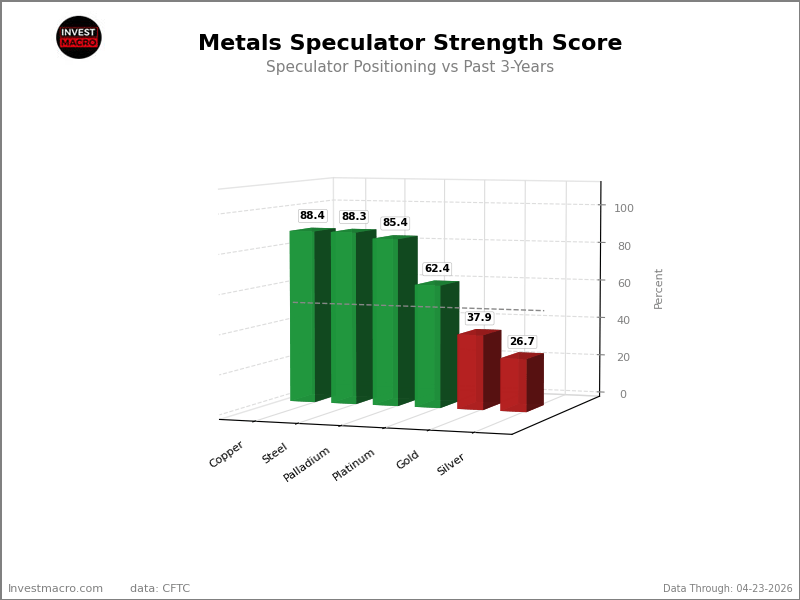
COT Strength Scores (a normalized measure of Speculator positions over a 3-Year range, from 0 to 100 where above 80 is Extreme-Bullish and below 20 is Extreme-Bearish) showed that Copper (88 percent) and Steel (88 percent) lead the metals markets this week. Palladium (85 percent) comes in as the next highest in the weekly strength scores.
On the downside, Silver (27 percent) and Gold (38 percent) come in at the lowest strength level currently.
Strength Statistics:
Gold (37.9 percent) vs Gold previous week (37.3 percent)
Silver (26.7 percent) vs Silver previous week (26.5 percent)
Copper (88.4 percent) vs Copper previous week (84.6 percent)
Platinum (62.4 percent) vs Platinum previous week (62.6 percent)
Palladium (85.4 percent) vs Palladium previous week (85.0 percent)
Steel (88.3 percent) vs Steel previous week (86.3 percent)
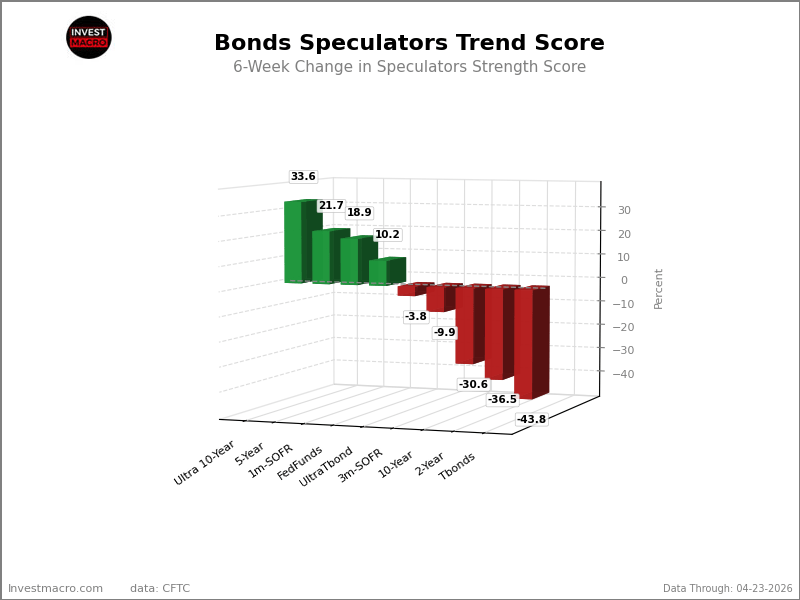
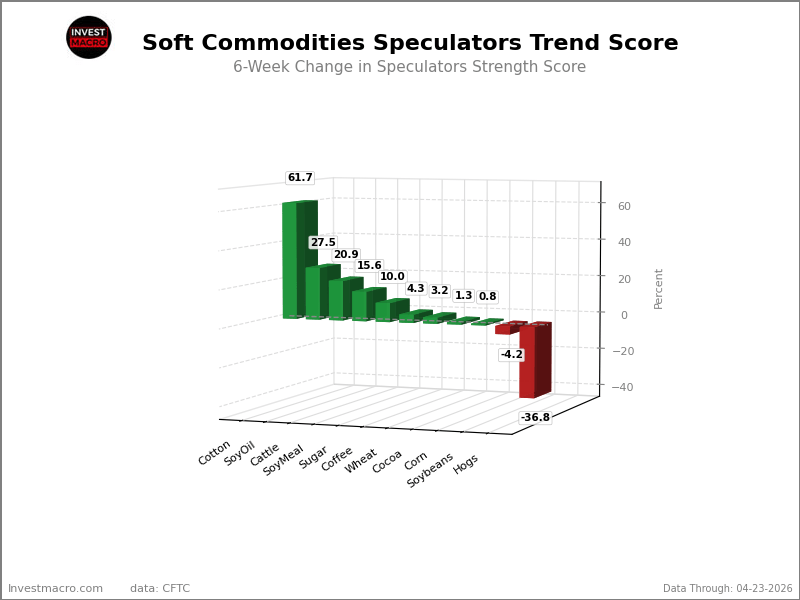
Platinum & Copper top the 6-Week Strength Trends
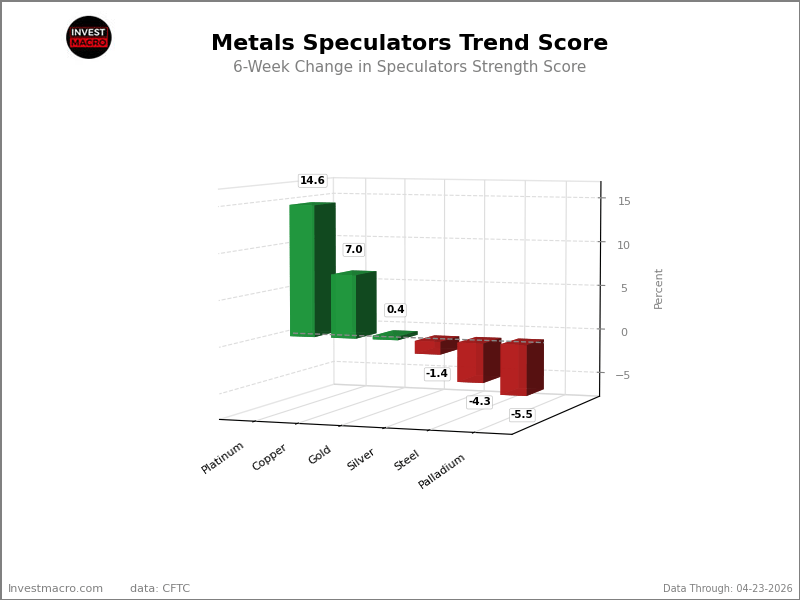
COT Strength Score Trends (or move index, calculates the 6-week changes in strength scores) showed that Platinum (15 percent) and Copper (7 percent) lead the past six weeks trends for metals.
Palladium (-5 percent) leads the downside trend scores currently with Steel (-4 percent) as the next market with lower trend scores.
Move Statistics:
Gold (0.4 percent) vs Gold previous week (1.0 percent)
Silver (-1.4 percent) vs Silver previous week (0.4 percent)
Copper (7.0 percent) vs Copper previous week (-2.4 percent)
Platinum (14.6 percent) vs Platinum previous week (17.0 percent)
Palladium (-5.5 percent) vs Palladium previous week (-8.0 percent)
Steel (-4.3 percent) vs Steel previous week (1.2 percent)
Individual Markets:
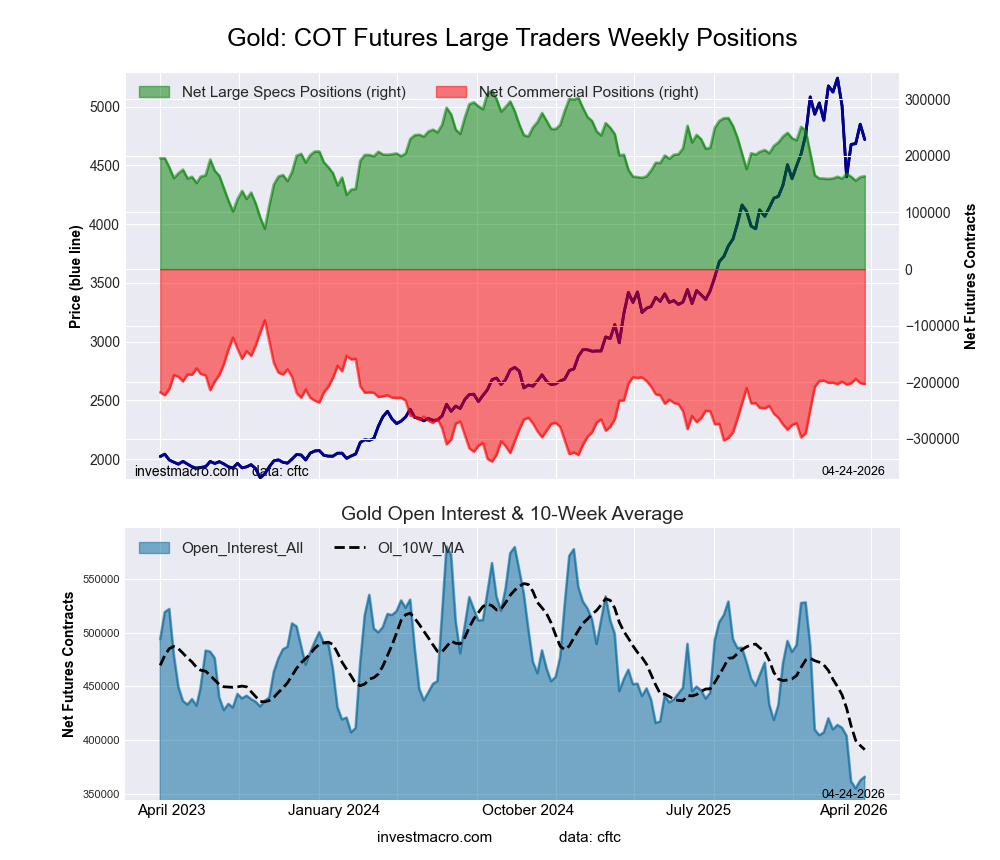
Gold Comex Futures Futures:
 Positioning Notes:
- Gold Comex Futures large speculator standing this week reached a net position of 164,006 contracts in the data reported through Tuesday.
- Weekly Speculator position increase of 1,480 contracts from the previous week which had a total of 162,526 net contracts.
- This week’s current strength score (range over the past 3 years, measured from 0 to 100) shows the speculators are currently Bearish with a score of 37.9 percent.
- The Commercials are Bullish with a score of 54.9 percent.
- The Small Traders (not shown in chart) are Bullish with a score of 79.7 percent.
Price Trend-Following Model: Weak Uptrend
Our weekly trend-following model classifies the current market price position as: Weak Uptrend.
| Gold Futures Statistics | SPECULATORS | COMMERCIALS | SMALL TRADERS |
| – Percent of Open Interest Longs: | 58.2 | 15.4 | 14.3 |
| – Percent of Open Interest Shorts: | 13.4 | 70.9 | 3.6 |
| – Net Position: | 164,006 | -202,940 | 38,934 |
| – Gross Longs: | 212,893 | 56,261 | 52,223 |
| – Gross Shorts: | 48,887 | 259,201 | 13,289 |
| – Long to Short Ratio: | 4.4 to 1 | 0.2 to 1 | 3.9 to 1 |
| NET POSITION TREND: | |||
| – Strength Index Score (3 Year Range Pct): | 37.9 | 54.9 | 79.7 |
| – Strength Index Reading (3 Year Range): | Bearish | Bullish | Bullish |
| NET POSITION MOVEMENT INDEX: | |||
| – 6-Week Change in Strength Index: | 0.4 | 0.0 | -2.7 |
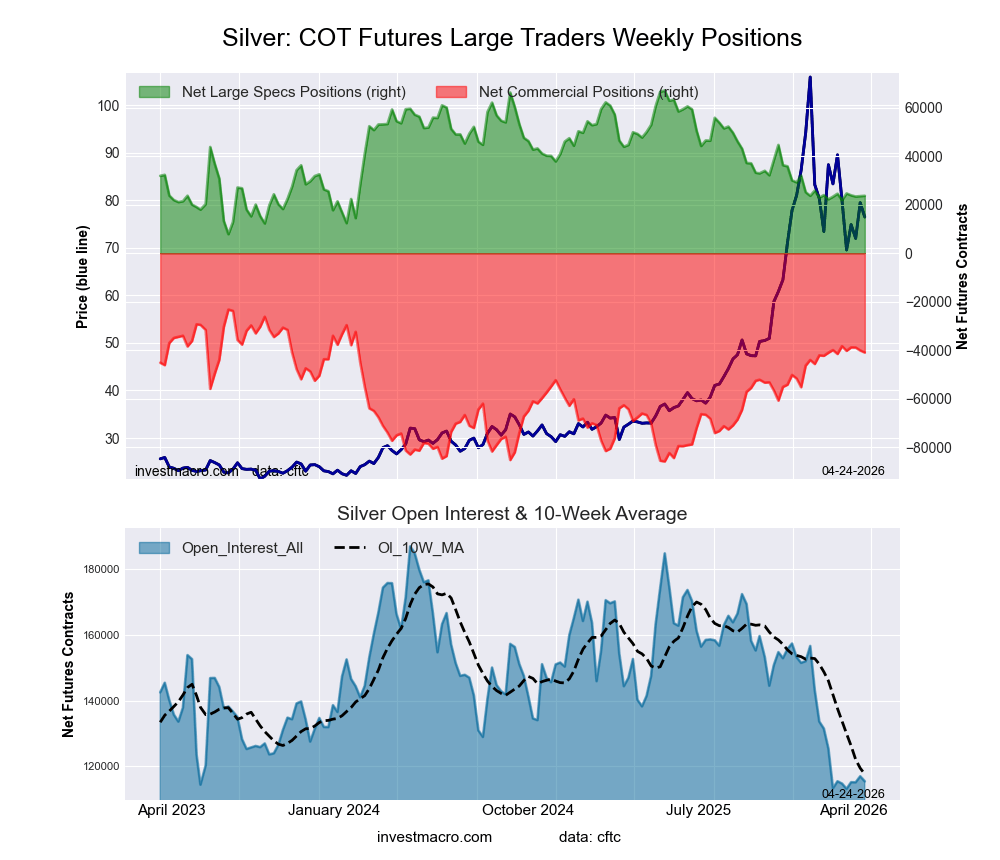
Silver Comex Futures Futures:
 Positioning Notes:
- Silver Comex Futures large speculator standing this week reached a net position of 23,720 contracts in the data reported through Tuesday.
- Weekly Speculator position advance of 158 contracts from the previous week which had a total of 23,562 net contracts.
- This week’s current strength score (range over the past 3 years, measured from 0 to 100) shows the speculators are currently Bearish with a score of 26.7 percent.
- The Commercials are Bullish with a score of 71.7 percent.
- The Small Traders (not shown in chart) are Bearish with a score of 47.7 percent.
Price Trend-Following Model: Weak Uptrend
Our weekly trend-following model classifies the current market price position as: Weak Uptrend.
| Silver Futures Statistics | SPECULATORS | COMMERCIALS | SMALL TRADERS |
| – Percent of Open Interest Longs: | 28.8 | 28.0 | 22.7 |
| – Percent of Open Interest Shorts: | 8.2 | 63.5 | 7.8 |
| – Net Position: | 23,720 | -40,985 | 17,265 |
| – Gross Longs: | 33,233 | 32,357 | 26,253 |
| – Gross Shorts: | 9,513 | 73,342 | 8,988 |
| – Long to Short Ratio: | 3.5 to 1 | 0.4 to 1 | 2.9 to 1 |
| NET POSITION TREND: | |||
| – Strength Index Score (3 Year Range Pct): | 26.7 | 71.7 | 47.7 |
| – Strength Index Reading (3 Year Range): | Bearish | Bullish | Bearish |
| NET POSITION MOVEMENT INDEX: | |||
| – 6-Week Change in Strength Index: | -1.4 | 0.9 | 1.5 |
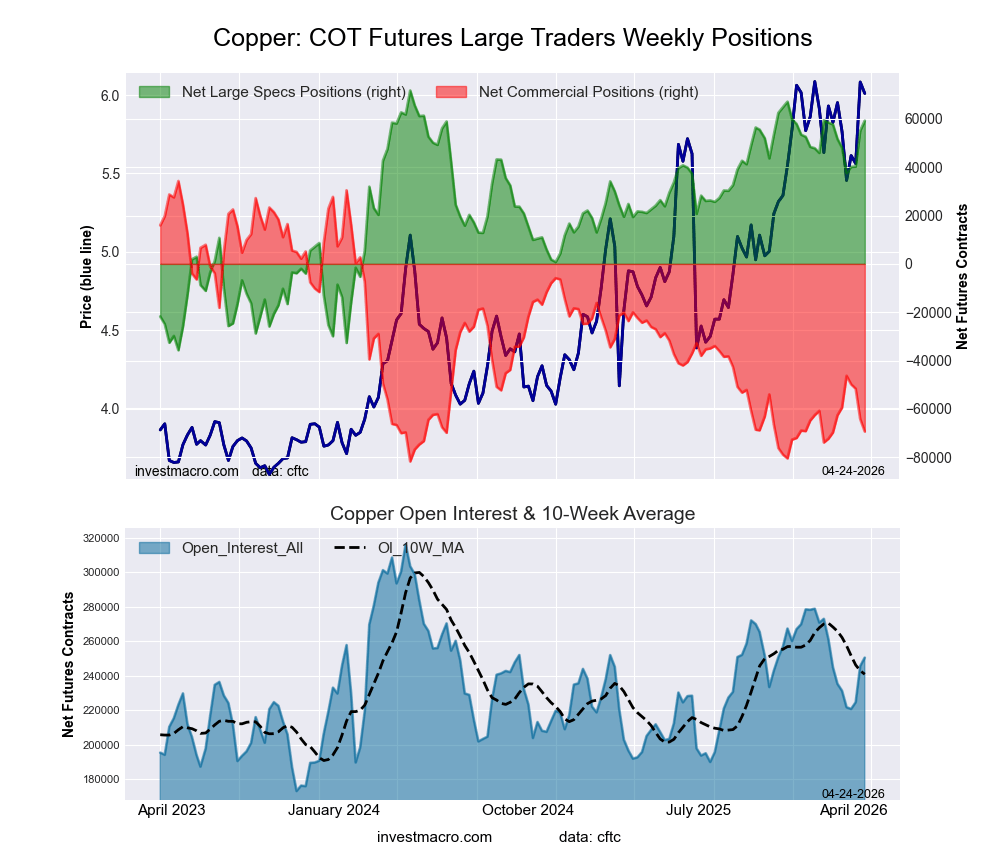
Copper Grade #1 Futures Futures:
 Positioning Notes:
- Copper Grade #1 Futures large speculator standing this week reached a net position of 59,204 contracts in the data reported through Tuesday.
- Weekly Speculator position boost of 4,095 contracts from the previous week which had a total of 55,109 net contracts.
- This week’s current strength score (range over the past 3 years, measured from 0 to 100) shows the speculators are currently Bullish-Extreme with a score of 88.4 percent.
- The Commercials are Bearish-Extreme with a score of 10.7 percent.
- The Small Traders (not shown in chart) are Bullish with a score of 66.6 percent.
Price Trend-Following Model: Strong Uptrend
Our weekly trend-following model classifies the current market price position as: Strong Uptrend.
| Copper Futures Statistics | SPECULATORS | COMMERCIALS | SMALL TRADERS |
| – Percent of Open Interest Longs: | 36.0 | 35.1 | 8.2 |
| – Percent of Open Interest Shorts: | 12.4 | 62.7 | 4.1 |
| – Net Position: | 59,204 | -69,335 | 10,131 |
| – Gross Longs: | 90,142 | 87,855 | 20,417 |
| – Gross Shorts: | 30,938 | 157,190 | 10,286 |
| – Long to Short Ratio: | 2.9 to 1 | 0.6 to 1 | 2.0 to 1 |
| NET POSITION TREND: | |||
| – Strength Index Score (3 Year Range Pct): | 88.4 | 10.7 | 66.6 |
| – Strength Index Reading (3 Year Range): | Bullish-Extreme | Bearish-Extreme | Bullish |
| NET POSITION MOVEMENT INDEX: | |||
| – 6-Week Change in Strength Index: | 7.0 | -5.8 | -4.3 |
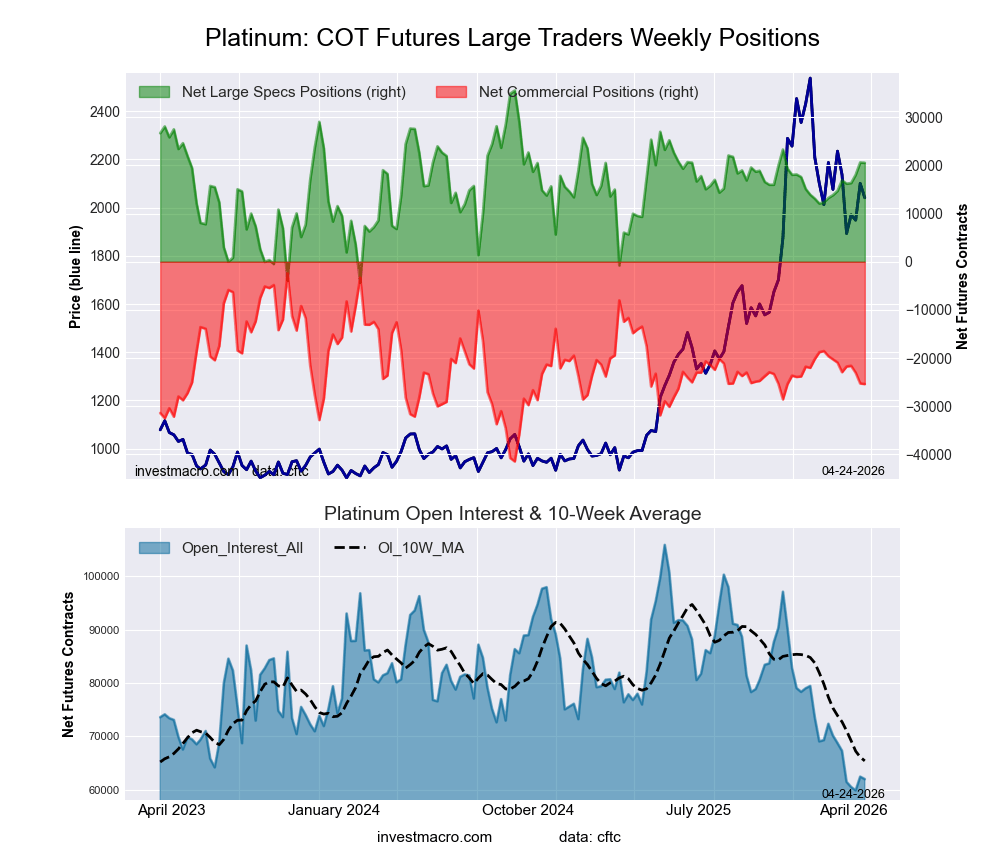
Platinum Futures Futures:
 Positioning Notes:
- Platinum Futures large speculator standing this week reached a net position of 20,536 contracts in the data reported through Tuesday.
- Weekly Speculator position decline of -67 contracts from the previous week which had a total of 20,603 net contracts.
- This week’s current strength score (range over the past 3 years, measured from 0 to 100) shows the speculators are currently Bullish with a score of 62.4 percent.
- The Commercials are Bearish with a score of 41.1 percent.
- The Small Traders (not shown in chart) are Bullish with a score of 54.5 percent.
Price Trend-Following Model: Strong Downtrend
Our weekly trend-following model classifies the current market price position as: Strong Downtrend.
| Platinum Futures Statistics | SPECULATORS | COMMERCIALS | SMALL TRADERS |
| – Percent of Open Interest Longs: | 46.7 | 27.6 | 12.7 |
| – Percent of Open Interest Shorts: | 13.6 | 68.6 | 4.9 |
| – Net Position: | 20,536 | -25,387 | 4,851 |
| – Gross Longs: | 28,940 | 17,133 | 7,859 |
| – Gross Shorts: | 8,404 | 42,520 | 3,008 |
| – Long to Short Ratio: | 3.4 to 1 | 0.4 to 1 | 2.6 to 1 |
| NET POSITION TREND: | |||
| – Strength Index Score (3 Year Range Pct): | 62.4 | 41.1 | 54.5 |
| – Strength Index Reading (3 Year Range): | Bullish | Bearish | Bullish |
| NET POSITION MOVEMENT INDEX: | |||
| – 6-Week Change in Strength Index: | 14.6 | -11.4 | -15.8 |
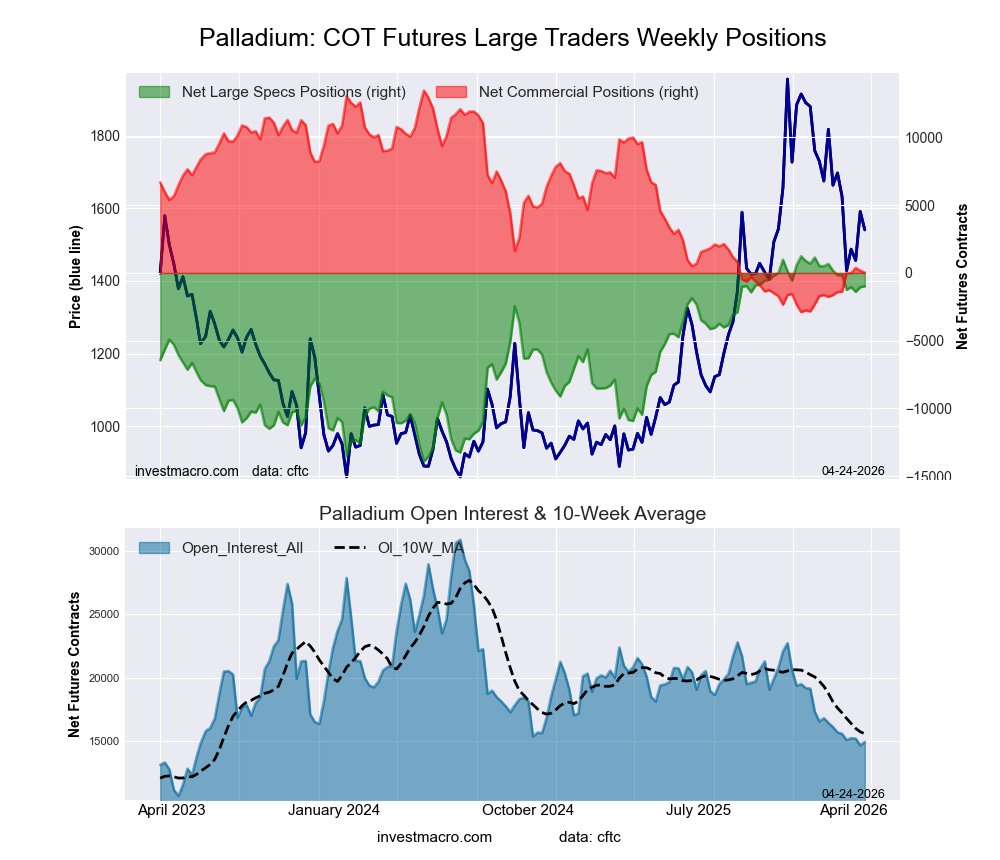
Palladium Futures Futures:
 Positioning Notes:
- Palladium Futures large speculator standing this week reached a net position of -985 contracts in the data reported through Tuesday.
- Weekly Speculator position boost of 68 contracts from the previous week which had a total of -1,053 net contracts.
- This week’s current strength score (range over the past 3 years, measured from 0 to 100) shows the speculators are currently Bullish-Extreme with a score of 85.4 percent.
- The Commercials are Bearish-Extreme with a score of 17.9 percent.
- The Small Traders (not shown in chart) are Bullish with a score of 53.1 percent.
Price Trend-Following Model: Strong Downtrend
Our weekly trend-following model classifies the current market price position as: Strong Downtrend.
| Palladium Futures Statistics | SPECULATORS | COMMERCIALS | SMALL TRADERS |
| – Percent of Open Interest Longs: | 46.1 | 35.5 | 15.4 |
| – Percent of Open Interest Shorts: | 52.7 | 35.3 | 9.0 |
| – Net Position: | -985 | 30 | 955 |
| – Gross Longs: | 6,884 | 5,300 | 2,297 |
| – Gross Shorts: | 7,869 | 5,270 | 1,342 |
| – Long to Short Ratio: | 0.9 to 1 | 1.0 to 1 | 1.7 to 1 |
| NET POSITION TREND: | |||
| – Strength Index Score (3 Year Range Pct): | 85.4 | 17.9 | 53.1 |
| – Strength Index Reading (3 Year Range): | Bullish-Extreme | Bearish-Extreme | Bullish |
| NET POSITION MOVEMENT INDEX: | |||
| – 6-Week Change in Strength Index: | -5.5 | 8.8 | -20.9 |
Steel Futures Futures:
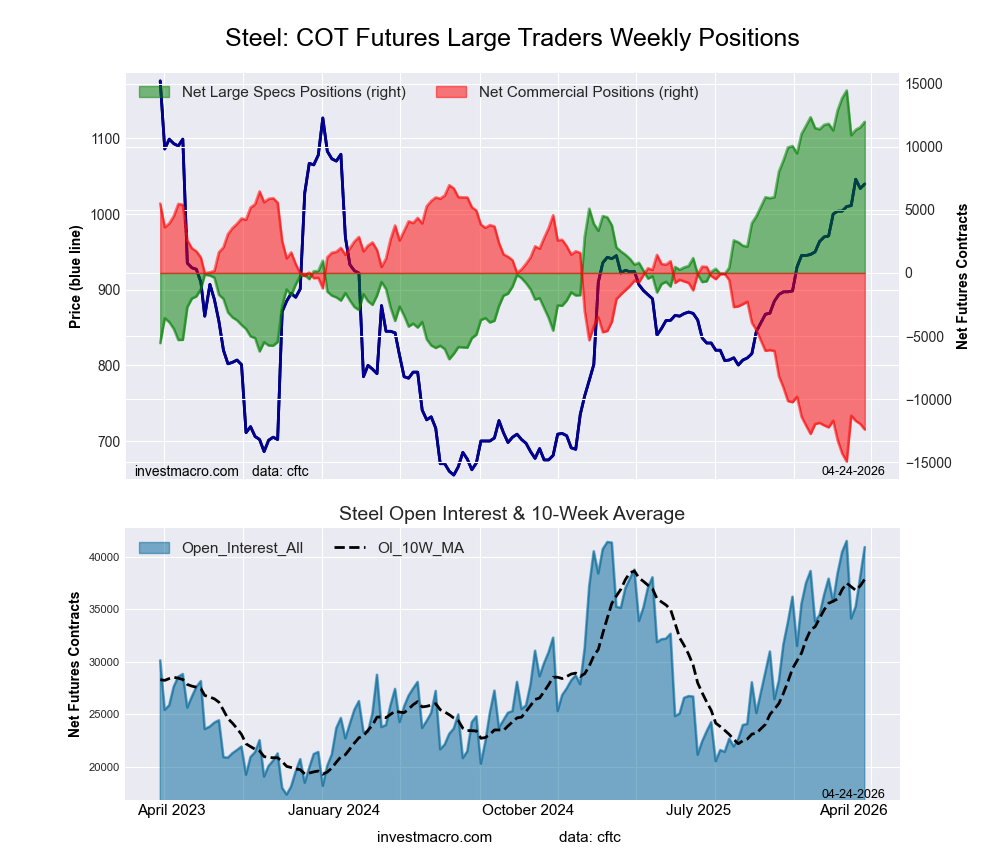 Positioning Notes:
- Steel Futures large speculator standing this week reached a net position of 11,980 contracts in the data reported through Tuesday.
- Weekly Speculator position increase of 430 contracts from the previous week which had a total of 11,550 net contracts.
- This week’s current strength score (range over the past 3 years, measured from 0 to 100) shows the speculators are currently Bullish-Extreme with a score of 88.3 percent.
- The Commercials are Bearish-Extreme with a score of 11.6 percent.
- The Small Traders (not shown in chart) are Bullish-Extreme with a score of 92.5 percent.
Price Trend-Following Model: Uptrend
Our weekly trend-following model classifies the current market price position as: Uptrend.
| Steel Futures Statistics | SPECULATORS | COMMERCIALS | SMALL TRADERS |
| – Percent of Open Interest Longs: | 30.9 | 65.7 | 1.4 |
| – Percent of Open Interest Shorts: | 1.7 | 96.0 | 0.4 |
| – Net Position: | 11,980 | -12,415 | 435 |
| – Gross Longs: | 12,665 | 26,882 | 590 |
| – Gross Shorts: | 685 | 39,297 | 155 |
| – Long to Short Ratio: | 18.5 to 1 | 0.7 to 1 | 3.8 to 1 |
| NET POSITION TREND: | |||
| – Strength Index Score (3 Year Range Pct): | 88.3 | 11.6 | 92.5 |
| – Strength Index Reading (3 Year Range): | Bullish-Extreme | Bearish-Extreme | Bullish-Extreme |
| NET POSITION MOVEMENT INDEX: | |||
| – 6-Week Change in Strength Index: | -4.3 | 3.9 | 8.4 |
Article By InvestMacro – Receive our weekly COT Newsletter
*COT Report: The COT data, released weekly to the public each Friday, is updated through the most recent Tuesday (data is 3 days old) and shows a quick view of how large speculators or non-commercials (for-profit traders) were positioned in the futures markets.
The CFTC categorizes trader positions according to commercial hedgers (traders who use futures contracts for hedging as part of the business), non-commercials (large traders who speculate to realize trading profits) and nonreportable traders (usually small traders/speculators) as well as their open interest (contracts open in the market at time of reporting). See CFTC criteria here.