By InvestMacro
Here are the latest charts and statistics for the Commitment of Traders (COT) data published by the Commodities Futures Trading Commission (CFTC).
The latest COT data is updated through Tuesday April 1st and shows a quick view of how large market participants (for-profit speculators and commercial traders) were positioned in the futures markets. All currency positions are in direct relation to the US dollar where, for example, a bet for the euro is a bet that the euro will rise versus the dollar while a bet against the euro will be a bet that the euro will decline versus the dollar.
Weekly Speculator Changes led by Australian Dollar
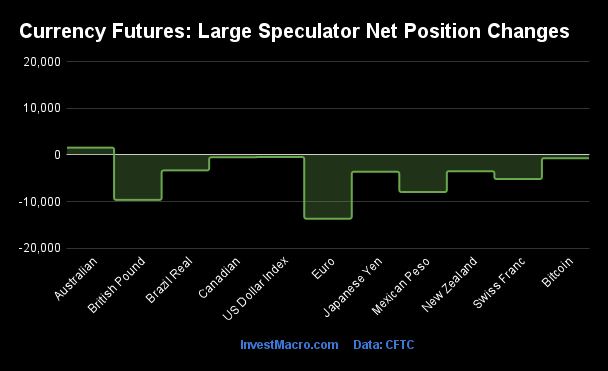
The COT currency market speculator bets were decisively lower this week (through Tuesday) as just one out of the eleven currency markets we cover had higher positioning while the other ten markets had lower speculator contracts.
Leading the gains for the currency markets was the Australian Dollar with a small gain of 1,583 contracts for the week.
The currencies seeing declines in speculator bets on the week were the EuroFX (-13,690 contracts), the British Pound (-9,657 contracts), the Mexican Peso (-7,959 contracts), the Swiss Franc (-5,171 contracts), the Japanese Yen (-3,602 contracts), the New Zealand Dollar (-3,481 contracts), the Brazilian Real (-3,314 contracts), Bitcoin (-688 contracts), the Canadian Dollar (-482 contracts) and with the US Dollar Index (-427 contracts) also registering lower bets on the week.
FX Roundup: Currency Speculators dropped their Bullish Bets before last week’s turmoil
Highlighting the COT currency’s data for last week was that the currency bets were overall down before last week’s late-week turmoil on the US tariffs announcement. The COT data is updated each week through Tuesday (released on Friday), so we only get a glimpse to what the speculators & commercials did before the Thursday & Friday selloffs.
The specs reduced their bullish bets across the board last week except for a small uptick in bets for the Australian dollar. The largest decreases were for the Euro, British Pound and the Mexican Peso — which were three currency positions that had been seeing recent speculator sentiment gains and had overall bullish net positioning. The Swiss Franc, the Yen, the NZD and the Brazilian Real saw more modest declines. The Australian Dollar saw a small rise but the overall AUD speculator position remains very bearish at a -76,863 net contract standing at the moment. It is hard to read into any of these moves because they could be and likely to be dwarfed by this coming week’s data and positioning changes.
The price action from last week was obviously dominated by the last two days which saw a giant whipsaw take place from Thursday to Friday. Thursday’s price action had strong bullish jumps for all the major currencies, except for the US Dollar Index, which took a huge hit by over -1.50 percent. The Yen, the Swiss Franc and the Mexican Peso led the way on Thursday with increases by over +2.0 percent each while the other majors saw gains in the neighborhood of +1.0 percent.
Friday, however, was a different story and everything pretty much reversed itself. The US Dollar Index led the way on Friday with a jump by approximately +1.0 percent. The next strongest currency turned out to be the safe haven Swiss Franc — which only fell by about -0.08 percent. The other (normally) safe haven Japanese Yen dipped by -0.32 percent and the Euro fell by -0.84 percent. After that, there was a sea of red with prices dropping for the other major much more sharply — the Aussie experienced a giant drop by -5 percent, the NZD by -3.85 percent, the Real by -3.78 percent and the Peso by -2.80 percent. The Canadian Dollar and British Pound saw declines each by over 1.00 percent.
Next week, to say the least, will be an interesting one after the market digests the recent news, retrenches and re-positions itself going forward. There is considerable risk the trends continue lower like Friday but there is a possibility that like the initial shock of Covid, some markets take a plunge and then turnaround again. Stay alert.
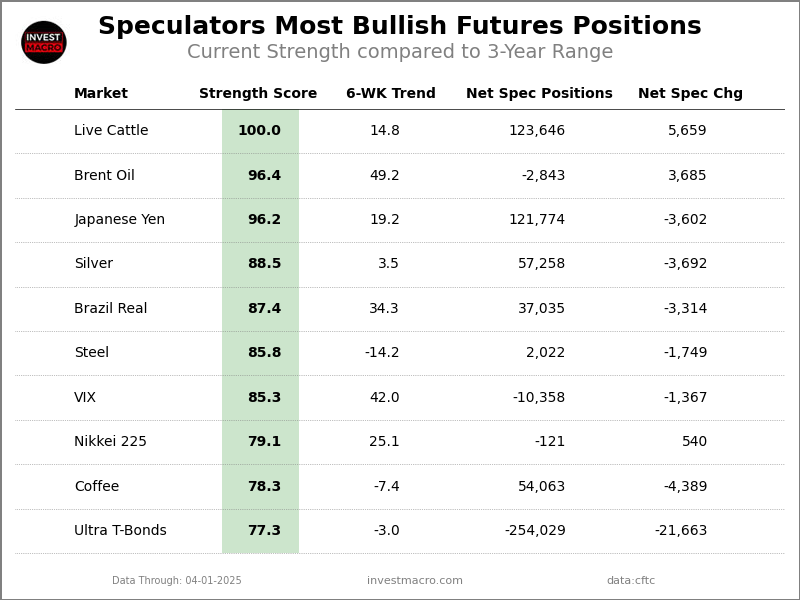
Currencies Net Speculators Leaderboard
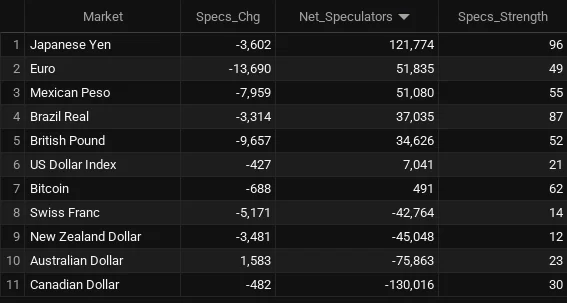
Legend: Weekly Speculators Change | Speculators Current Net Position | Speculators Strength Score compared to last 3-Years (0-100 range)
Strength Scores led by Japanese Yen & Brazilian Real
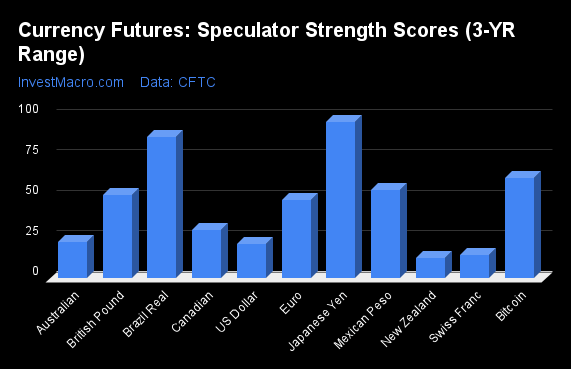
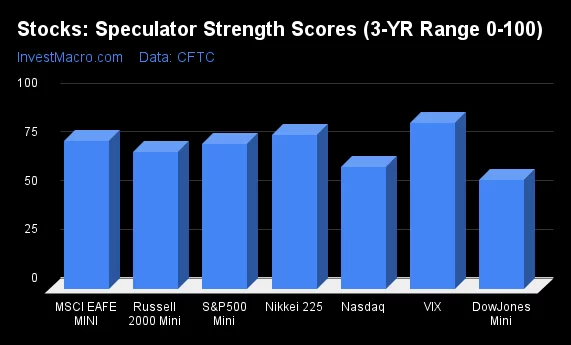
COT Strength Scores (a normalized measure of Speculator positions over a 3-Year range, from 0 to 100 where above 80 is Extreme-Bullish and below 20 is Extreme-Bearish) showed that the Japanese Yen (96 percent) and the Brazilian Real (87 percent) lead the currency markets this week. Bitcoin (62 percent), Mexican Peso (55 percent) and the British Pound (52 percent) come in as the next highest in the weekly strength scores.
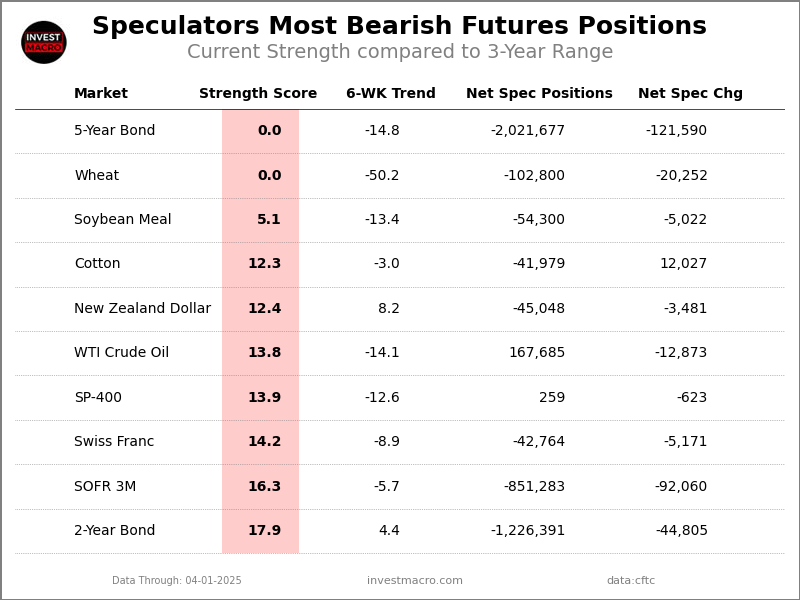
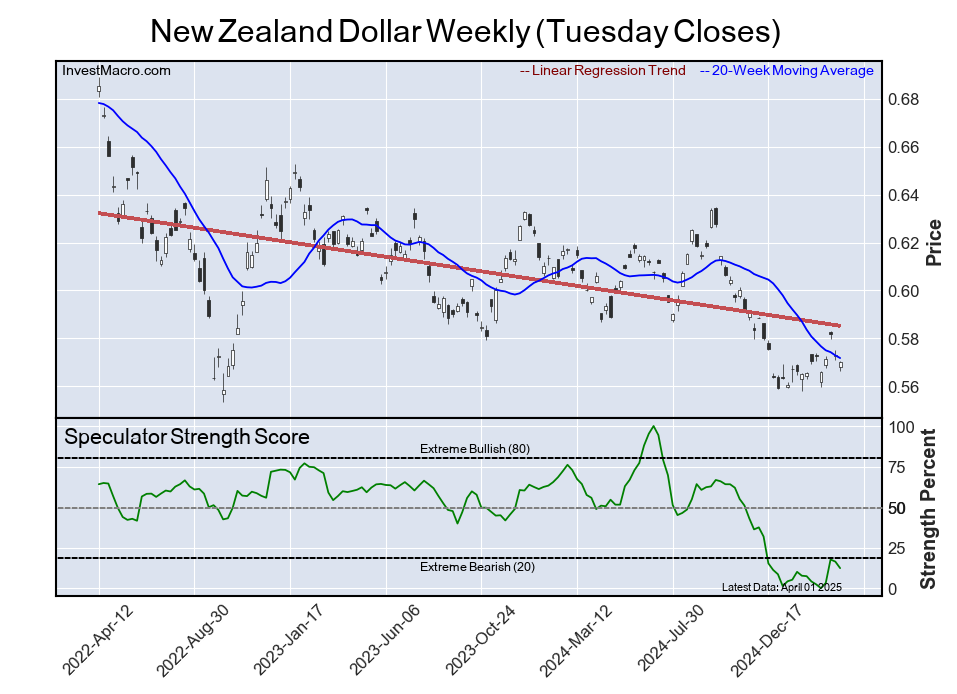
On the downside, the New Zealand Dollar (12 percent) and the Swiss Franc (14 percent) come in at the lowest strength levels currently and are in Extreme-Bearish territory (below 20 percent). The next lowest strength scores were the US Dollar Index (21 percent) and the Australian Dollar (22 percent).
3-Year Strength Statistics:
US Dollar Index (21.3 percent) vs US Dollar Index previous week (22.2 percent)
EuroFX (48.5 percent) vs EuroFX previous week (53.7 percent)
British Pound Sterling (51.7 percent) vs British Pound Sterling previous week (56.0 percent)
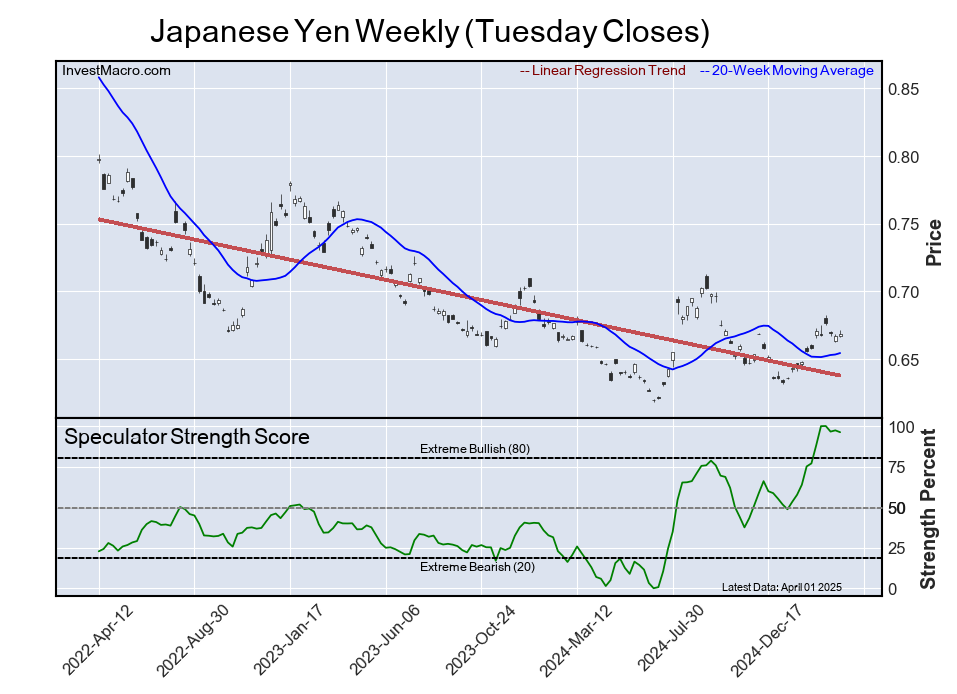
Japanese Yen (96.2 percent) vs Japanese Yen previous week (97.3 percent)
Swiss Franc (14.2 percent) vs Swiss Franc previous week (24.7 percent)
Canadian Dollar (29.7 percent) vs Canadian Dollar previous week (29.9 percent)
Australian Dollar (22.5 percent) vs Australian Dollar previous week (21.3 percent)
New Zealand Dollar (12.4 percent) vs New Zealand Dollar previous week (16.4 percent)
Mexican Peso (54.8 percent) vs Mexican Peso previous week (58.9 percent)
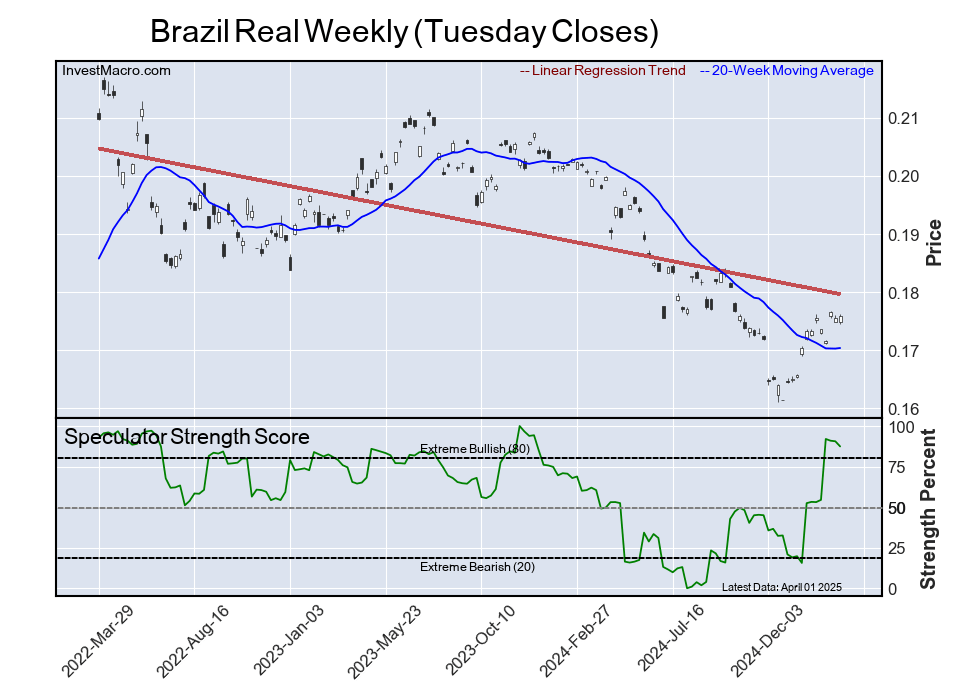
Brazilian Real (87.4 percent) vs Brazilian Real previous week (90.6 percent)
Bitcoin (62.0 percent) vs Bitcoin previous week (77.0 percent)
EuroFX & Brazilian Real top the 6-Week Strength Trends
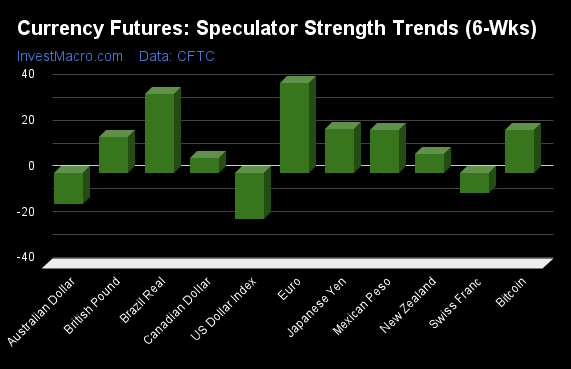
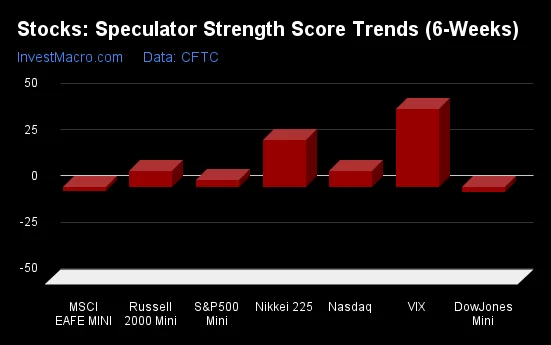
COT Strength Score Trends (or move index, calculates the 6-week changes in strength scores) showed that the EuroFX (39 percent) and the Brazilian Real (34 percent) lead the past six weeks trends for the currencies. The Japanese Yen (19 percent), the Mexican Peso (19 percent) and Bitcoin (19 percent) are the next highest positive movers in the 3-Year trends data.
The US Dollar Index (-20 percent) leads the downside trend scores currently with the Australian Dollar (-14 percent) and the Swiss Franc (-9 percent) following next with lower trend scores.
3-Year Strength Trends:
US Dollar Index (-20.2 percent) vs US Dollar Index previous week (-16.2 percent)
EuroFX (39.3 percent) vs EuroFX previous week (49.5 percent)
British Pound Sterling (15.8 percent) vs British Pound Sterling previous week (21.3 percent)
Japanese Yen (19.2 percent) vs Japanese Yen previous week (22.2 percent)
Swiss Franc (-8.9 percent) vs Swiss Franc previous week (2.3 percent)
Canadian Dollar (6.6 percent) vs Canadian Dollar previous week (9.5 percent)
Australian Dollar (-13.6 percent) vs Australian Dollar previous week (-8.4 percent)
New Zealand Dollar (8.2 percent) vs New Zealand Dollar previous week (9.0 percent)
Mexican Peso (18.6 percent) vs Mexican Peso previous week (22.0 percent)
Brazilian Real (34.3 percent) vs Brazilian Real previous week (37.4 percent)
Bitcoin (18.7 percent) vs Bitcoin previous week (33.7 percent)
Individual COT Forex Markets:
US Dollar Index Futures:
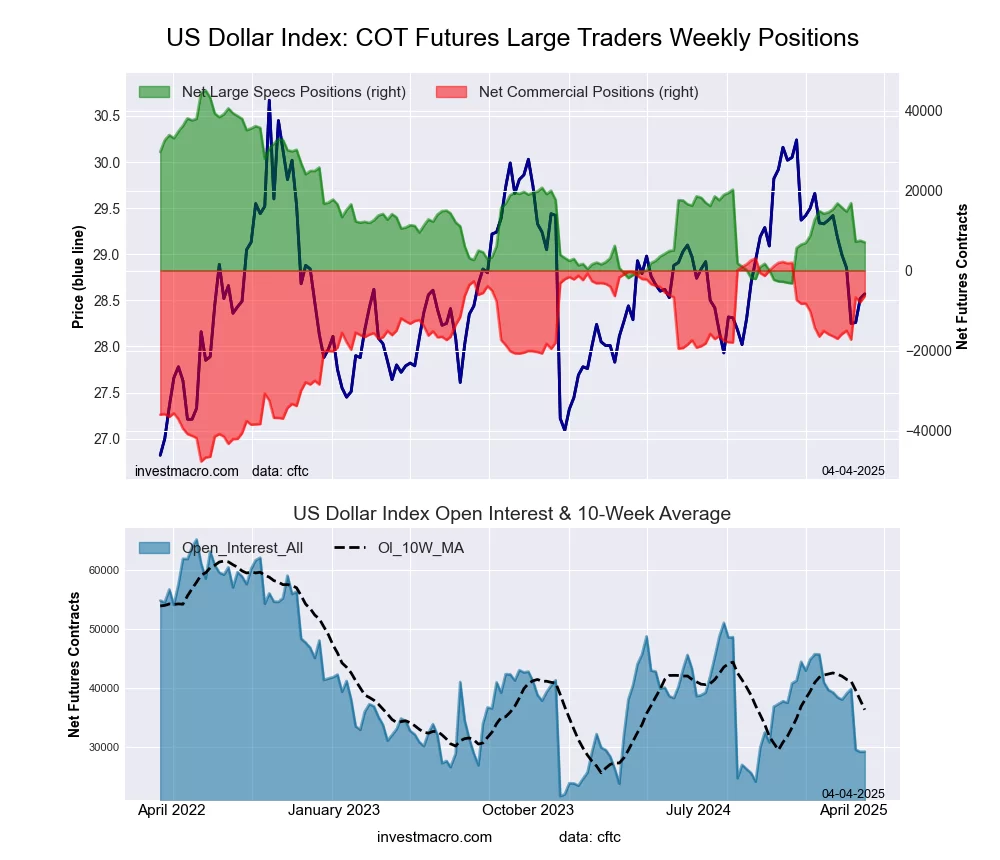 The US Dollar Index large speculator standing this week equaled a net position of 7,041 contracts in the data reported through Tuesday. This was a weekly decrease of -427 contracts from the previous week which had a total of 7,468 net contracts.
This week’s current strength score (the trader positioning range over the past three years, measured from 0 to 100) shows the speculators are currently Bearish with a score of 21.3 percent. The commercials are Bullish-Extreme with a score of 81.5 percent and the small traders (not shown in chart) are Bearish-Extreme with a score of 18.4 percent.
Price Trend-Following Model: Strong Downtrend
Our weekly trend-following model classifies the current market price position as: Strong Downtrend.
| US DOLLAR INDEX Statistics | SPECULATORS | COMMERCIALS | SMALL TRADERS |
| – Percent of Open Interest Longs: | 80.7 | 4.6 | 7.4 |
| – Percent of Open Interest Shorts: | 56.7 | 26.4 | 9.6 |
| – Net Position: | 7,041 | -6,397 | -644 |
| – Gross Longs: | 23,640 | 1,340 | 2,164 |
| – Gross Shorts: | 16,599 | 7,737 | 2,808 |
| – Long to Short Ratio: | 1.4 to 1 | 0.2 to 1 | 0.8 to 1 |
| NET POSITION TREND: | | | |
| – Strength Index Score (3 Year Range Pct): | 21.3 | 81.5 | 18.4 |
| – Strength Index Reading (3 Year Range): | Bearish | Bullish-Extreme | Bearish-Extreme |
| NET POSITION MOVEMENT INDEX: | | | |
| – 6-Week Change in Strength Index: | -20.2 | 21.0 | -10.8 |
Euro Currency Futures:
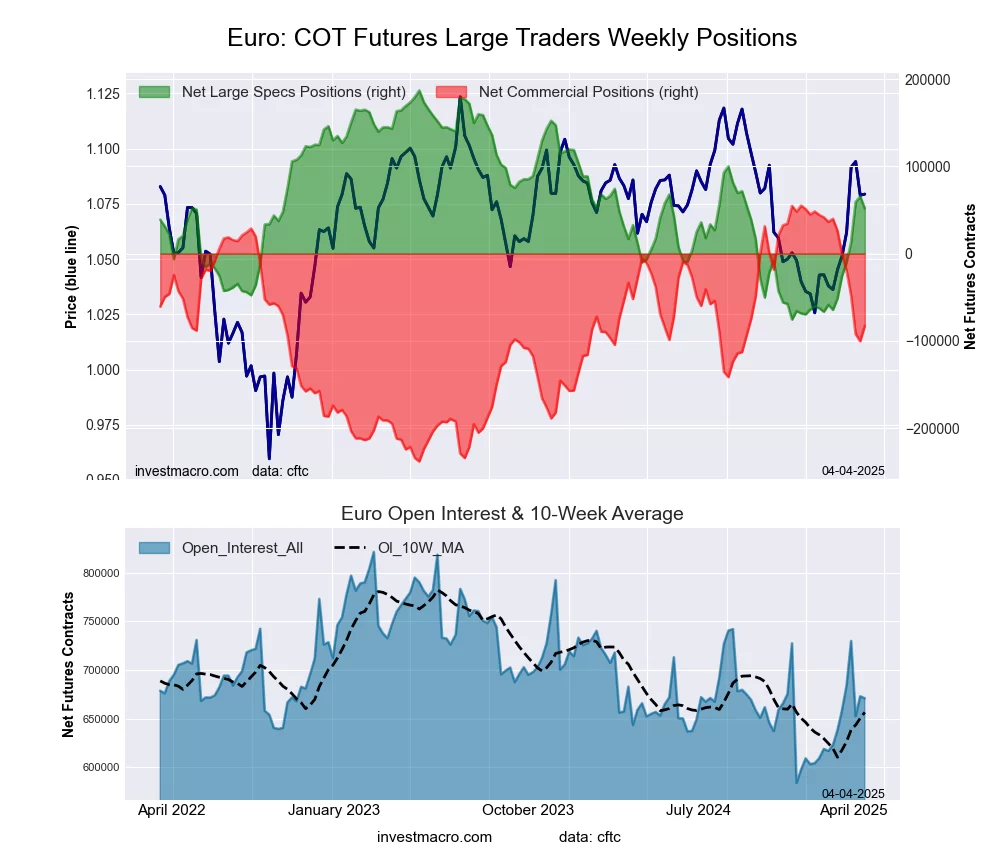 The Euro Currency large speculator standing this week equaled a net position of 51,835 contracts in the data reported through Tuesday. This was a weekly fall of -13,690 contracts from the previous week which had a total of 65,525 net contracts.
This week’s current strength score (the trader positioning range over the past three years, measured from 0 to 100) shows the speculators are currently Bearish with a score of 48.5 percent. The commercials are Bullish with a score of 53.0 percent and the small traders (not shown in chart) are Bearish with a score of 42.2 percent.
Price Trend-Following Model: Strong Uptrend
Our weekly trend-following model classifies the current market price position as: Strong Uptrend.
| EURO Currency Statistics | SPECULATORS | COMMERCIALS | SMALL TRADERS |
| – Percent of Open Interest Longs: | 27.3 | 56.6 | 11.9 |
| – Percent of Open Interest Shorts: | 19.6 | 68.9 | 7.3 |
| – Net Position: | 51,835 | -82,872 | 31,037 |
| – Gross Longs: | 183,247 | 379,419 | 80,132 |
| – Gross Shorts: | 131,412 | 462,291 | 49,095 |
| – Long to Short Ratio: | 1.4 to 1 | 0.8 to 1 | 1.6 to 1 |
| NET POSITION TREND: | | | |
| – Strength Index Score (3 Year Range Pct): | 48.5 | 53.0 | 42.2 |
| – Strength Index Reading (3 Year Range): | Bearish | Bullish | Bearish |
| NET POSITION MOVEMENT INDEX: | | | |
| – 6-Week Change in Strength Index: | 39.3 | -37.2 | 12.9 |
British Pound Sterling Futures:
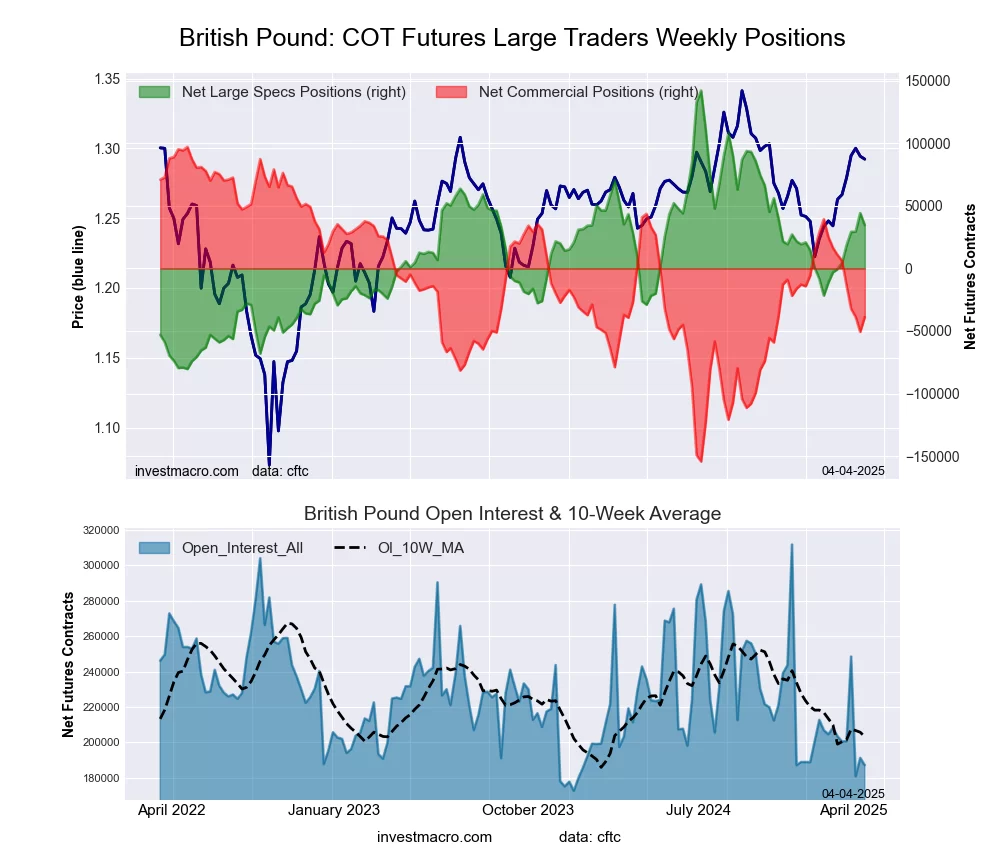 The British Pound Sterling large speculator standing this week equaled a net position of 34,626 contracts in the data reported through Tuesday. This was a weekly fall of -9,657 contracts from the previous week which had a total of 44,283 net contracts.
This week’s current strength score (the trader positioning range over the past three years, measured from 0 to 100) shows the speculators are currently Bullish with a score of 51.7 percent. The commercials are Bearish with a score of 46.0 percent and the small traders (not shown in chart) are Bullish with a score of 70.9 percent.
Price Trend-Following Model: Strong Uptrend
Our weekly trend-following model classifies the current market price position as: Strong Uptrend.
| BRITISH POUND Statistics | SPECULATORS | COMMERCIALS | SMALL TRADERS |
| – Percent of Open Interest Longs: | 56.1 | 26.9 | 16.2 |
| – Percent of Open Interest Shorts: | 37.6 | 47.6 | 13.9 |
| – Net Position: | 34,626 | -38,790 | 4,164 |
| – Gross Longs: | 104,986 | 50,320 | 30,248 |
| – Gross Shorts: | 70,360 | 89,110 | 26,084 |
| – Long to Short Ratio: | 1.5 to 1 | 0.6 to 1 | 1.2 to 1 |
| NET POSITION TREND: | | | |
| – Strength Index Score (3 Year Range Pct): | 51.7 | 46.0 | 70.9 |
| – Strength Index Reading (3 Year Range): | Bullish | Bearish | Bullish |
| NET POSITION MOVEMENT INDEX: | | | |
| – 6-Week Change in Strength Index: | 15.8 | -19.7 | 30.2 |
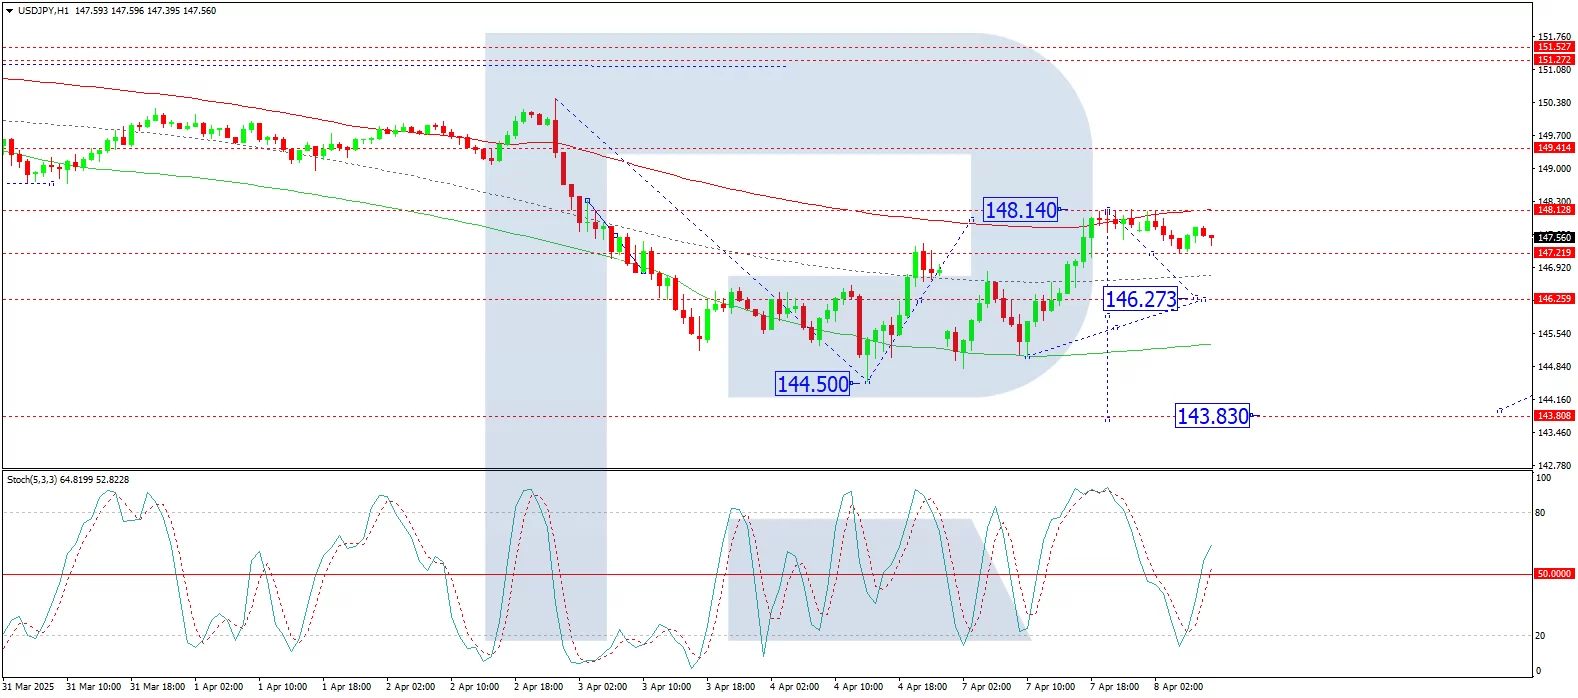
Japanese Yen Futures:
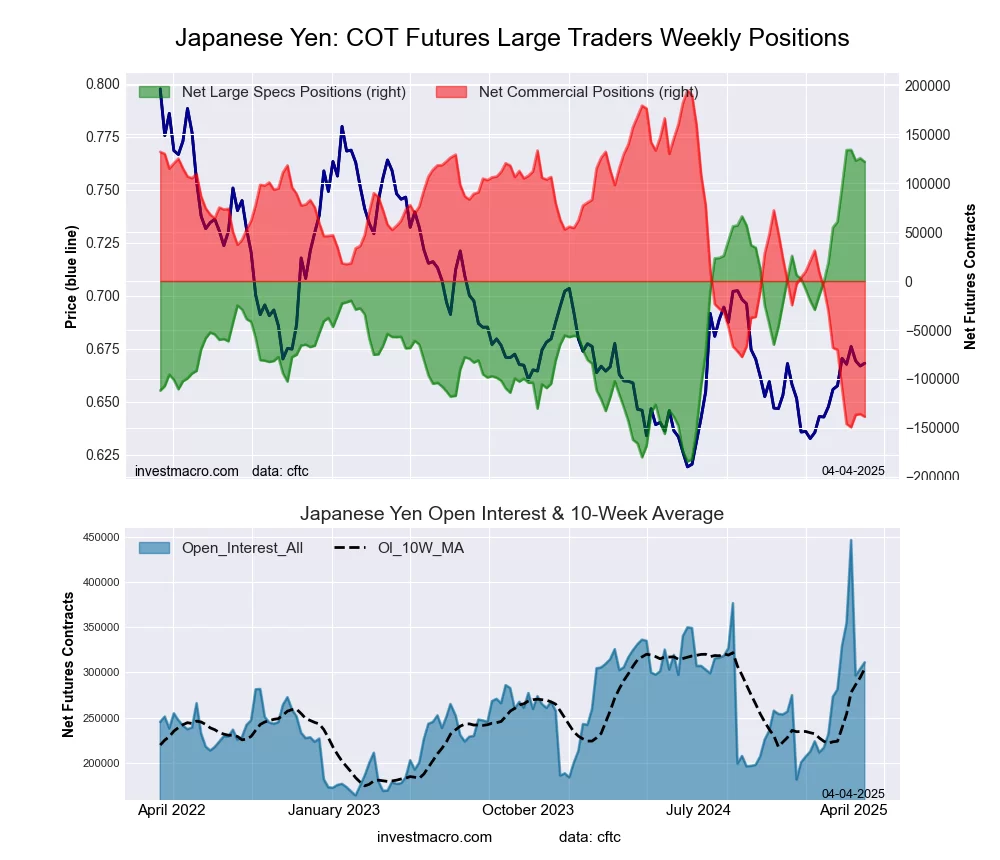 The Japanese Yen large speculator standing this week equaled a net position of 121,774 contracts in the data reported through Tuesday. This was a weekly fall of -3,602 contracts from the previous week which had a total of 125,376 net contracts.
This week’s current strength score (the trader positioning range over the past three years, measured from 0 to 100) shows the speculators are currently Bullish-Extreme with a score of 96.2 percent. The commercials are Bearish-Extreme with a score of 3.1 percent and the small traders (not shown in chart) are Bullish-Extreme with a score of 100.0 percent.
Price Trend-Following Model: Strong Uptrend
Our weekly trend-following model classifies the current market price position as: Strong Uptrend.
| JAPANESE YEN Statistics | SPECULATORS | COMMERCIALS | SMALL TRADERS |
| – Percent of Open Interest Longs: | 51.9 | 31.2 | 15.5 |
| – Percent of Open Interest Shorts: | 12.8 | 75.7 | 10.1 |
| – Net Position: | 121,774 | -138,547 | 16,773 |
| – Gross Longs: | 161,566 | 96,971 | 48,102 |
| – Gross Shorts: | 39,792 | 235,518 | 31,329 |
| – Long to Short Ratio: | 4.1 to 1 | 0.4 to 1 | 1.5 to 1 |
| NET POSITION TREND: | | | |
| – Strength Index Score (3 Year Range Pct): | 96.2 | 3.1 | 100.0 |
| – Strength Index Reading (3 Year Range): | Bullish-Extreme | Bearish-Extreme | Bullish-Extreme |
| NET POSITION MOVEMENT INDEX: | | | |
| – 6-Week Change in Strength Index: | 19.2 | -19.9 | 18.1 |
Swiss Franc Futures:
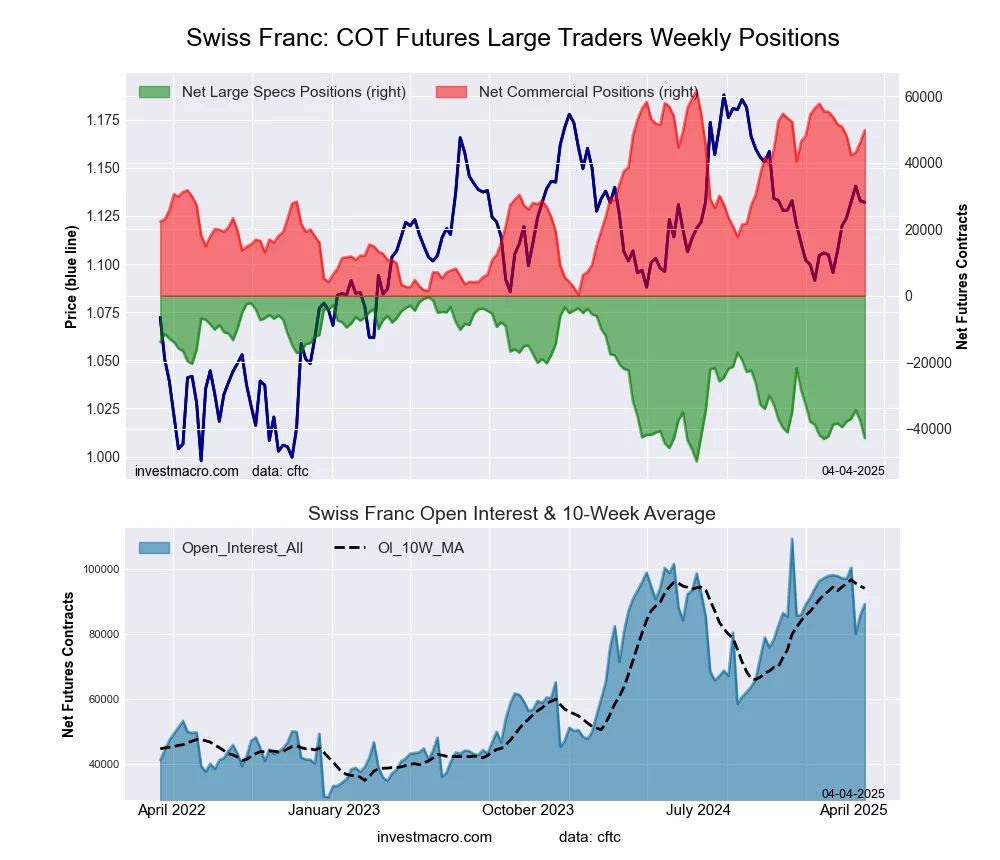 The Swiss Franc large speculator standing this week equaled a net position of -42,764 contracts in the data reported through Tuesday. This was a weekly reduction of -5,171 contracts from the previous week which had a total of -37,593 net contracts.
This week’s current strength score (the trader positioning range over the past three years, measured from 0 to 100) shows the speculators are currently Bearish-Extreme with a score of 14.2 percent. The commercials are Bullish-Extreme with a score of 80.6 percent and the small traders (not shown in chart) are Bearish with a score of 49.1 percent.
Price Trend-Following Model: Strong Uptrend
Our weekly trend-following model classifies the current market price position as: Strong Uptrend.
| SWISS FRANC Statistics | SPECULATORS | COMMERCIALS | SMALL TRADERS |
| – Percent of Open Interest Longs: | 4.6 | 83.8 | 11.4 |
| – Percent of Open Interest Shorts: | 52.6 | 28.0 | 19.3 |
| – Net Position: | -42,764 | 49,769 | -7,005 |
| – Gross Longs: | 4,143 | 74,797 | 10,177 |
| – Gross Shorts: | 46,907 | 25,028 | 17,182 |
| – Long to Short Ratio: | 0.1 to 1 | 3.0 to 1 | 0.6 to 1 |
| NET POSITION TREND: | | | |
| – Strength Index Score (3 Year Range Pct): | 14.2 | 80.6 | 49.1 |
| – Strength Index Reading (3 Year Range): | Bearish-Extreme | Bullish-Extreme | Bearish |
| NET POSITION MOVEMENT INDEX: | | | |
| – 6-Week Change in Strength Index: | -8.9 | -2.8 | 26.0 |
Canadian Dollar Futures:
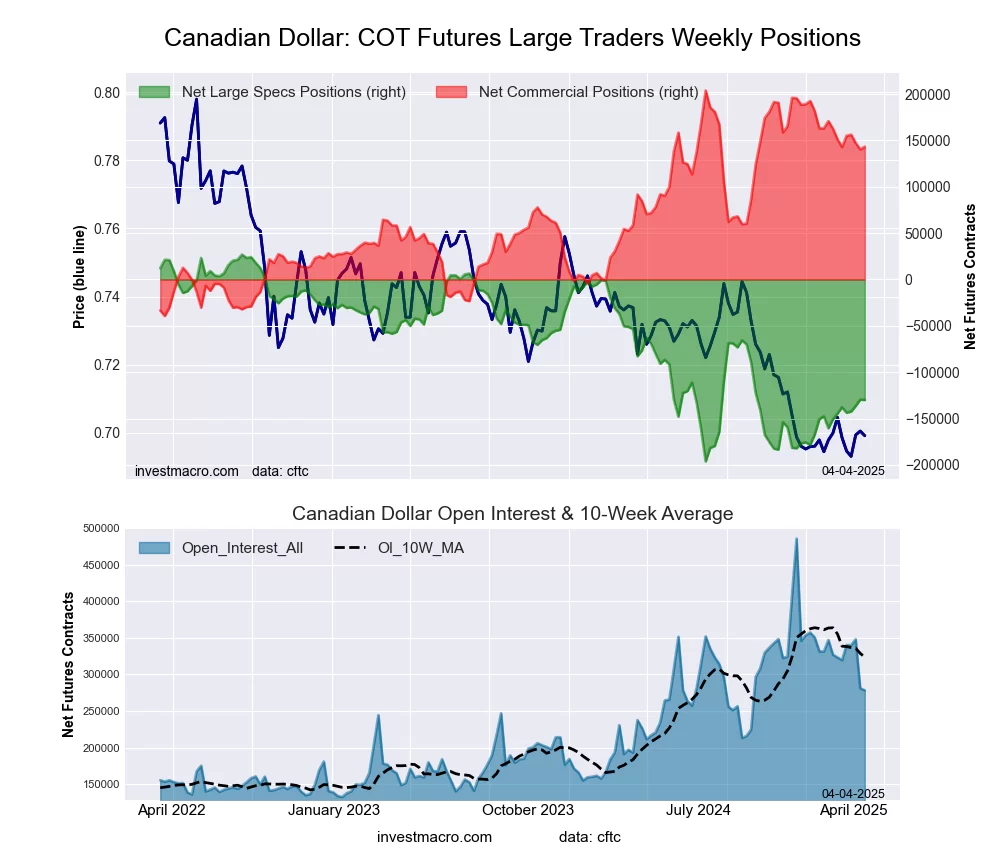 The Canadian Dollar large speculator standing this week equaled a net position of -130,016 contracts in the data reported through Tuesday. This was a weekly decline of -482 contracts from the previous week which had a total of -129,534 net contracts.
This week’s current strength score (the trader positioning range over the past three years, measured from 0 to 100) shows the speculators are currently Bearish with a score of 29.7 percent. The commercials are Bullish with a score of 75.1 percent and the small traders (not shown in chart) are Bearish-Extreme with a score of 5.6 percent.
Price Trend-Following Model: Weak Downtrend
Our weekly trend-following model classifies the current market price position as: Weak Downtrend.
| CANADIAN DOLLAR Statistics | SPECULATORS | COMMERCIALS | SMALL TRADERS |
| – Percent of Open Interest Longs: | 6.3 | 84.0 | 8.6 |
| – Percent of Open Interest Shorts: | 53.0 | 32.5 | 13.4 |
| – Net Position: | -130,016 | 143,318 | -13,302 |
| – Gross Longs: | 17,606 | 233,760 | 23,892 |
| – Gross Shorts: | 147,622 | 90,442 | 37,194 |
| – Long to Short Ratio: | 0.1 to 1 | 2.6 to 1 | 0.6 to 1 |
| NET POSITION TREND: | | | |
| – Strength Index Score (3 Year Range Pct): | 29.7 | 75.1 | 5.6 |
| – Strength Index Reading (3 Year Range): | Bearish | Bullish | Bearish-Extreme |
| NET POSITION MOVEMENT INDEX: | | | |
| – 6-Week Change in Strength Index: | 6.6 | -3.2 | -18.4 |
Australian Dollar Futures:
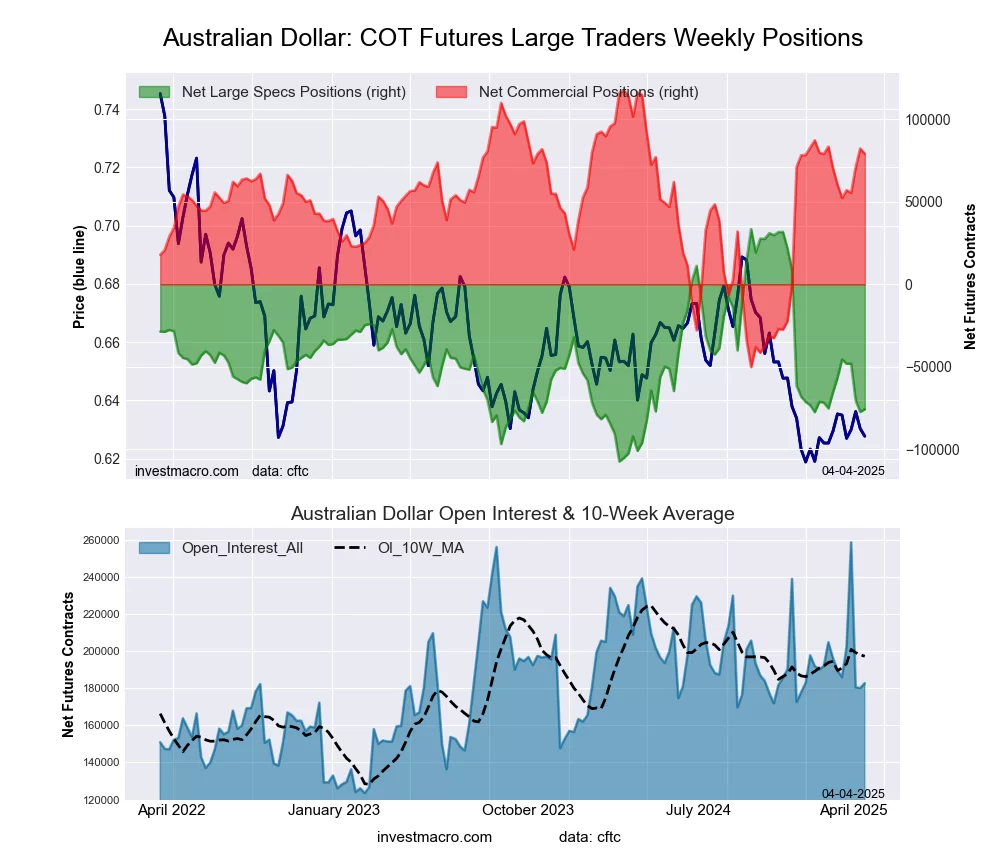 The Australian Dollar large speculator standing this week equaled a net position of -75,863 contracts in the data reported through Tuesday. This was a weekly lift of 1,583 contracts from the previous week which had a total of -77,446 net contracts.
This week’s current strength score (the trader positioning range over the past three years, measured from 0 to 100) shows the speculators are currently Bearish with a score of 22.5 percent. The commercials are Bullish with a score of 77.1 percent and the small traders (not shown in chart) are Bearish with a score of 40.4 percent.
Price Trend-Following Model: Strong Downtrend
Our weekly trend-following model classifies the current market price position as: Strong Downtrend.
| AUSTRALIAN DOLLAR Statistics | SPECULATORS | COMMERCIALS | SMALL TRADERS |
| – Percent of Open Interest Longs: | 14.3 | 65.3 | 13.5 |
| – Percent of Open Interest Shorts: | 55.8 | 22.0 | 15.3 |
| – Net Position: | -75,863 | 79,152 | -3,289 |
| – Gross Longs: | 26,211 | 119,373 | 24,740 |
| – Gross Shorts: | 102,074 | 40,221 | 28,029 |
| – Long to Short Ratio: | 0.3 to 1 | 3.0 to 1 | 0.9 to 1 |
| NET POSITION TREND: | | | |
| – Strength Index Score (3 Year Range Pct): | 22.5 | 77.1 | 40.4 |
| – Strength Index Reading (3 Year Range): | Bearish | Bullish | Bearish |
| NET POSITION MOVEMENT INDEX: | | | |
| – 6-Week Change in Strength Index: | -13.6 | 11.2 | 0.9 |
New Zealand Dollar Futures:
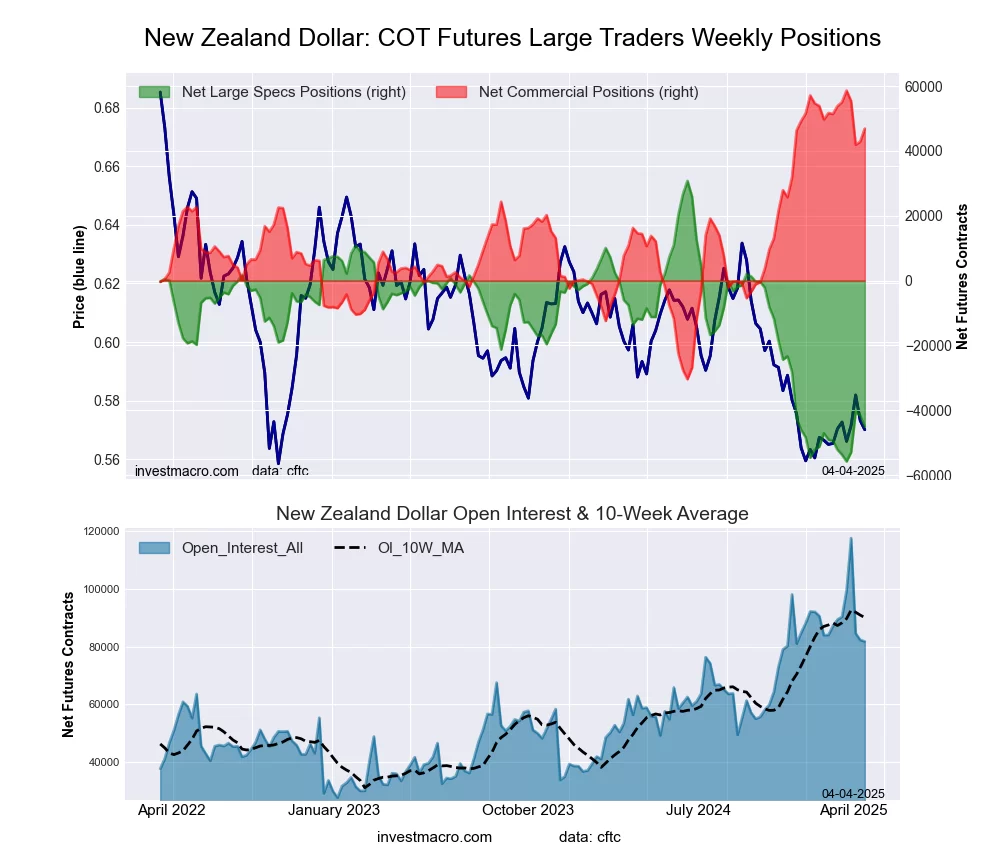 The New Zealand Dollar large speculator standing this week equaled a net position of -45,048 contracts in the data reported through Tuesday. This was a weekly lowering of -3,481 contracts from the previous week which had a total of -41,567 net contracts.
This week’s current strength score (the trader positioning range over the past three years, measured from 0 to 100) shows the speculators are currently Bearish-Extreme with a score of 12.4 percent. The commercials are Bullish-Extreme with a score of 86.8 percent and the small traders (not shown in chart) are Bearish with a score of 30.0 percent.
Price Trend-Following Model: Strong Downtrend
Our weekly trend-following model classifies the current market price position as: Strong Downtrend.
| NEW ZEALAND DOLLAR Statistics | SPECULATORS | COMMERCIALS | SMALL TRADERS |
| – Percent of Open Interest Longs: | 13.6 | 81.8 | 4.4 |
| – Percent of Open Interest Shorts: | 68.7 | 24.4 | 6.7 |
| – Net Position: | -45,048 | 46,893 | -1,845 |
| – Gross Longs: | 11,164 | 66,892 | 3,613 |
| – Gross Shorts: | 56,212 | 19,999 | 5,458 |
| – Long to Short Ratio: | 0.2 to 1 | 3.3 to 1 | 0.7 to 1 |
| NET POSITION TREND: | | | |
| – Strength Index Score (3 Year Range Pct): | 12.4 | 86.8 | 30.0 |
| – Strength Index Reading (3 Year Range): | Bearish-Extreme | Bullish-Extreme | Bearish |
| NET POSITION MOVEMENT INDEX: | | | |
| – 6-Week Change in Strength Index: | 8.2 | -7.8 | -2.2 |
Mexican Peso Futures:
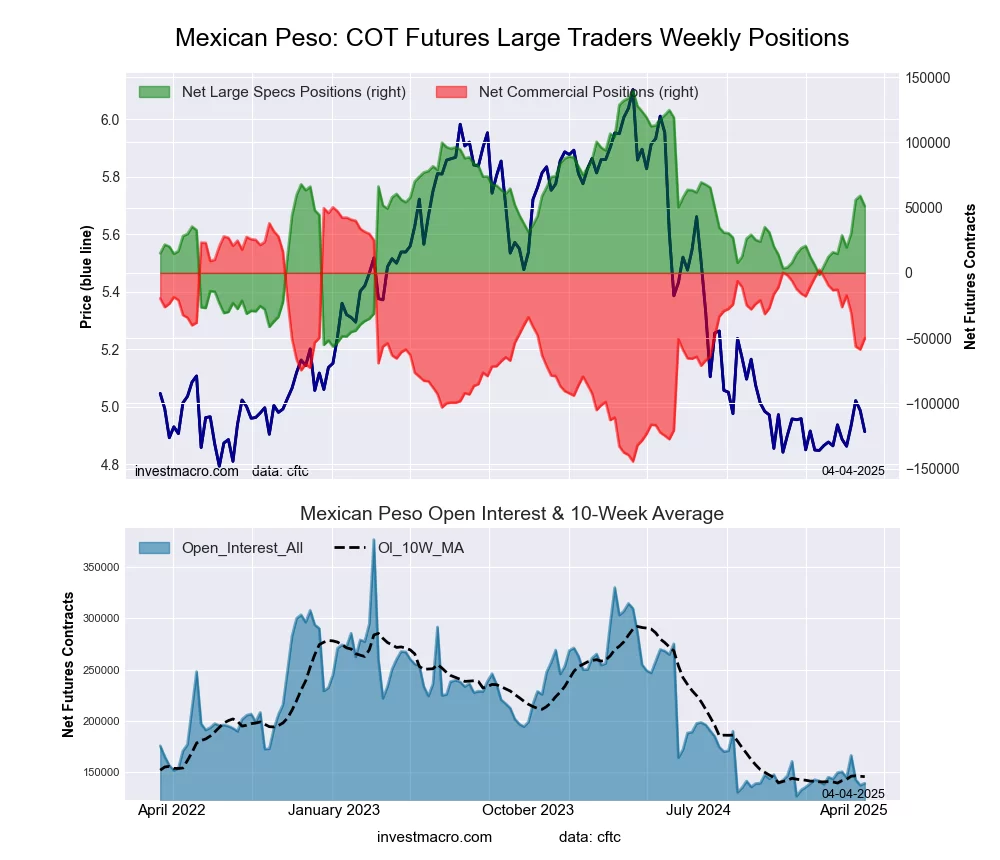 The Mexican Peso large speculator standing this week equaled a net position of 51,080 contracts in the data reported through Tuesday. This was a weekly lowering of -7,959 contracts from the previous week which had a total of 59,039 net contracts.
This week’s current strength score (the trader positioning range over the past three years, measured from 0 to 100) shows the speculators are currently Bullish with a score of 54.8 percent. The commercials are Bearish with a score of 48.4 percent and the small traders (not shown in chart) are Bearish-Extreme with a score of 17.4 percent.
Price Trend-Following Model: Weak Uptrend
Our weekly trend-following model classifies the current market price position as: Weak Uptrend.
| MEXICAN PESO Statistics | SPECULATORS | COMMERCIALS | SMALL TRADERS |
| – Percent of Open Interest Longs: | 62.2 | 31.4 | 3.1 |
| – Percent of Open Interest Shorts: | 25.6 | 67.4 | 3.8 |
| – Net Position: | 51,080 | -50,125 | -955 |
| – Gross Longs: | 86,757 | 43,822 | 4,295 |
| – Gross Shorts: | 35,677 | 93,947 | 5,250 |
| – Long to Short Ratio: | 2.4 to 1 | 0.5 to 1 | 0.8 to 1 |
| NET POSITION TREND: | | | |
| – Strength Index Score (3 Year Range Pct): | 54.8 | 48.4 | 17.4 |
| – Strength Index Reading (3 Year Range): | Bullish | Bearish | Bearish-Extreme |
| NET POSITION MOVEMENT INDEX: | | | |
| – 6-Week Change in Strength Index: | 18.6 | -19.2 | 5.0 |
Brazilian Real Futures:
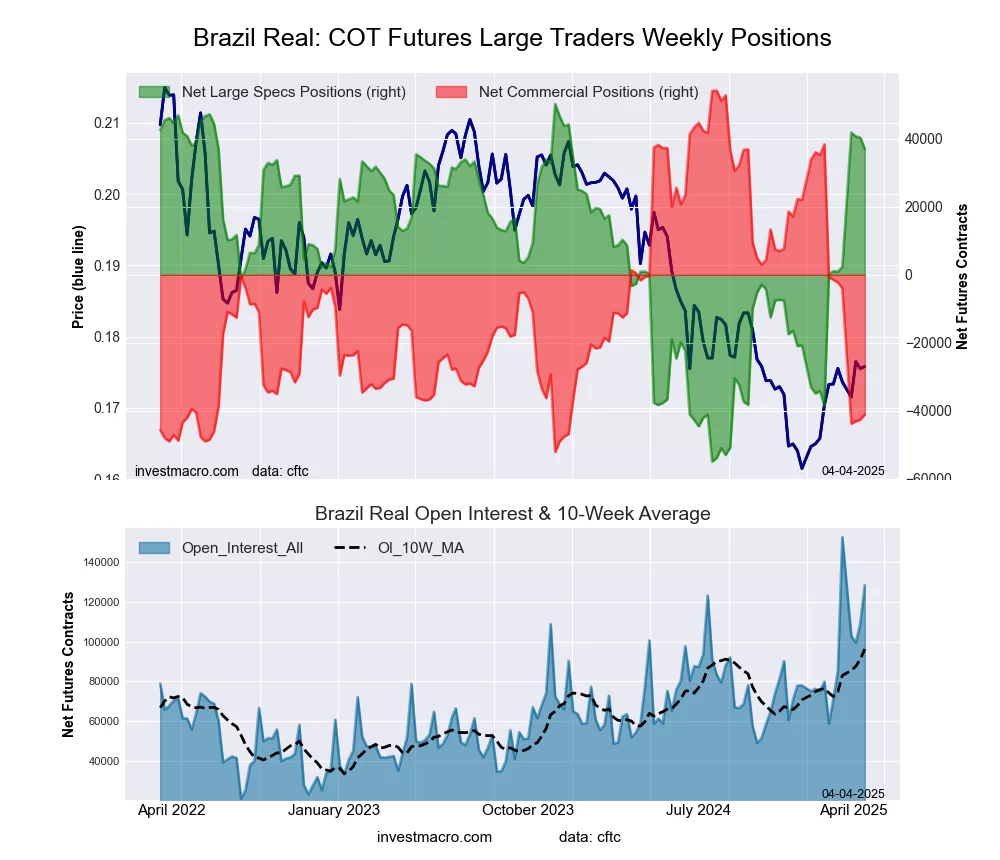 The Brazilian Real large speculator standing this week equaled a net position of 37,035 contracts in the data reported through Tuesday. This was a weekly reduction of -3,314 contracts from the previous week which had a total of 40,349 net contracts.
This week’s current strength score (the trader positioning range over the past three years, measured from 0 to 100) shows the speculators are currently Bullish-Extreme with a score of 87.4 percent. The commercials are Bearish-Extreme with a score of 10.4 percent and the small traders (not shown in chart) are Bearish with a score of 43.5 percent.
Price Trend-Following Model: Uptrend
Our weekly trend-following model classifies the current market price position as: Uptrend.
| BRAZIL REAL Statistics | SPECULATORS | COMMERCIALS | SMALL TRADERS |
| – Percent of Open Interest Longs: | 54.2 | 34.3 | 4.4 |
| – Percent of Open Interest Shorts: | 25.4 | 66.3 | 1.2 |
| – Net Position: | 37,035 | -41,050 | 4,015 |
| – Gross Longs: | 69,590 | 44,065 | 5,617 |
| – Gross Shorts: | 32,555 | 85,115 | 1,602 |
| – Long to Short Ratio: | 2.1 to 1 | 0.5 to 1 | 3.5 to 1 |
| NET POSITION TREND: | | | |
| – Strength Index Score (3 Year Range Pct): | 87.4 | 10.4 | 43.5 |
| – Strength Index Reading (3 Year Range): | Bullish-Extreme | Bearish-Extreme | Bearish |
| NET POSITION MOVEMENT INDEX: | | | |
| – 6-Week Change in Strength Index: | 34.3 | -36.5 | 15.4 |
Bitcoin Futures:
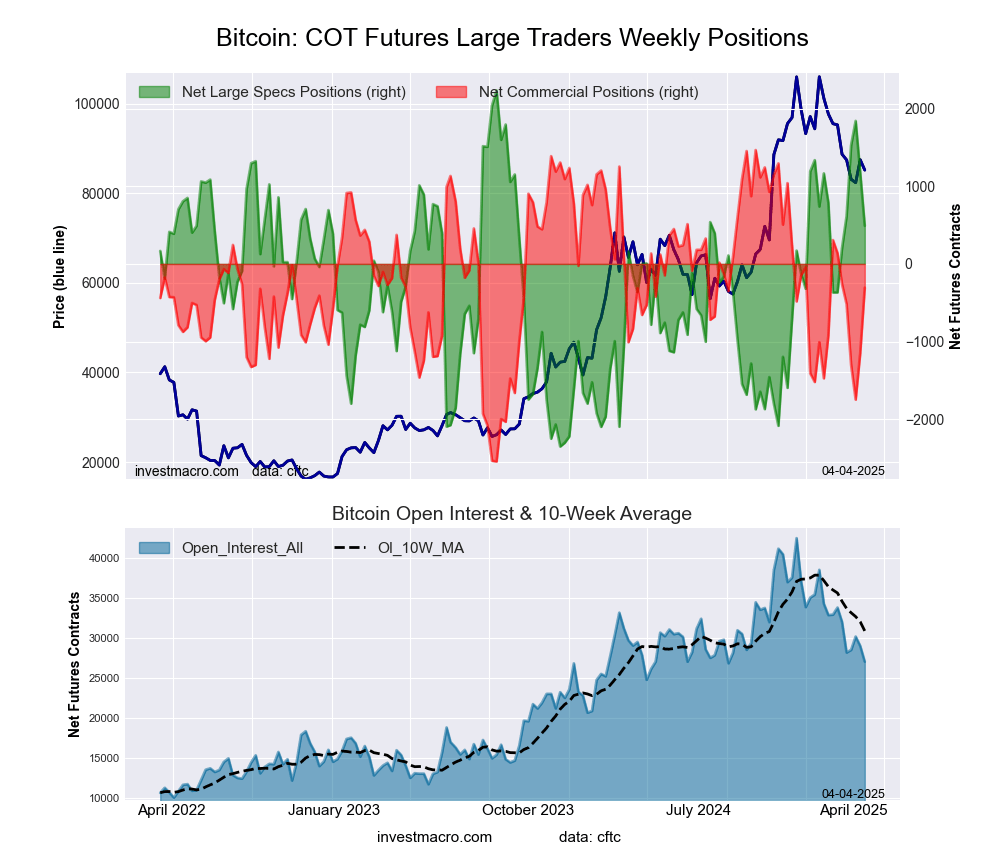 The Bitcoin large speculator standing this week equaled a net position of 491 contracts in the data reported through Tuesday. This was a weekly fall of -688 contracts from the previous week which had a total of 1,179 net contracts.
This week’s current strength score (the trader positioning range over the past three years, measured from 0 to 100) shows the speculators are currently Bullish with a score of 62.0 percent. The commercials are Bullish with a score of 55.8 percent and the small traders (not shown in chart) are Bearish-Extreme with a score of 3.0 percent.
Price Trend-Following Model: Strong Downtrend
Our weekly trend-following model classifies the current market price position as: Strong Downtrend.
| BITCOIN Statistics | SPECULATORS | COMMERCIALS | SMALL TRADERS |
| – Percent of Open Interest Longs: | 86.3 | 3.3 | 4.0 |
| – Percent of Open Interest Shorts: | 84.5 | 4.5 | 4.7 |
| – Net Position: | 491 | -306 | -185 |
| – Gross Longs: | 23,373 | 901 | 1,077 |
| – Gross Shorts: | 22,882 | 1,207 | 1,262 |
| – Long to Short Ratio: | 1.0 to 1 | 0.7 to 1 | 0.9 to 1 |
| NET POSITION TREND: | | | |
| – Strength Index Score (3 Year Range Pct): | 62.0 | 55.8 | 3.0 |
| – Strength Index Reading (3 Year Range): | Bullish | Bullish | Bearish-Extreme |
| NET POSITION MOVEMENT INDEX: | | | |
| – 6-Week Change in Strength Index: | 18.7 | -11.1 | -28.6 |
Article By InvestMacro – Receive our weekly COT Newsletter
*COT Report: The COT data, released weekly to the public each Friday, is updated through the most recent Tuesday (data is 3 days old) and shows a quick view of how large speculators or non-commercials (for-profit traders) were positioned in the futures markets.
The CFTC categorizes trader positions according to commercial hedgers (traders who use futures contracts for hedging as part of the business), non-commercials (large traders who speculate to realize trading profits) and nonreportable traders (usually small traders/speculators) as well as their open interest (contracts open in the market at time of reporting). See CFTC criteria here.